MMW QUIZZES 3 and 4
1/58
Earn XP
Description and Tags
SIGMA
Name | Mastery | Learn | Test | Matching | Spaced |
|---|
No study sessions yet.
59 Terms
Classify the data
lot areas of houses in a village
ratio
Classify the data
types of fruits
nominal
Classify the data
movie ratings (poor, fair, good, excellent)
ordinal
Classify the data
time of day on a 12-hour clock (3:00, 6:00, 9:00)
interval
Classify the data
Height of students in centimeters
ratio
what is statistics?
the science of collecting, analyzing, and interpreting data
which of the following is an example of descriptive statistics?
calculating the average age of studens in a class
what is the difference between a population and a sample?
a sample is a subset of a population, and it is always larger than a sample
which of the following is a qualitative variable?
gender
what type of graph is used to observe trends over time?
line graph
which of the following is NOT a measure of central tendency?
range
what is the mean of the dataset:
5, 10, 15, 20, 25
15
the median of a dataset is
the middle value when the data is sorted
what measure of central tendency is most affected by outliers?
mean
what is the mode of the dataset:
2, 4, 4, 6, 8, 8, 8, 10
8
which of the following best describes the first quartile (Q1)?
the value below which 25% of the data lies
in a dataset, the second quartile (Q2) is also known as
the median
which of the following statements is true about the interquartile range (IQR)?
IQR is the range between Q1 and Q3
which percentile corresponds to the median of a dataset?
50th percentile
which of the following a measure of variation or dispersion?
range
which of the following is true about the range of a dataset?
it is the difference between the highest and lowest values in the dataset
what does a larger standard deviation indicate about a dataset?
the data points are more spread out from the mean
if the variance of a dataset is 0, what can be concluded?
all values in the dataset are equal
the interquartile range (IQR) of a dataset is
the difference between the first and third quartiles (Q3 - Q1)
in a normal curve, the ordinate is highest at
mean
in normal distribution,
mean = median = mode
the shape of the normal curve depends upon the value of
standard deviation
the total area of the normal probability distribution is
1
A student’s score on a test is 90, and the class mean is 80 with an SD of 5.
What is the z score for the student’s score?
2
which of the following characteristics is true for a normal distribution?
it is symmetrical around the mean
in a standard normal distribution, the mean is
0
what percentage of the data lies within one standard deviation of the mean in a normal distribution?
68%
which of the following is the correct shape of a normal distribution curve?
bell-shaped
the median of a normal distribution corresponds to a value of Z is
0
in a normal distribution, Q1 = 20, and Q3 = 40, then the mean is equal to
30
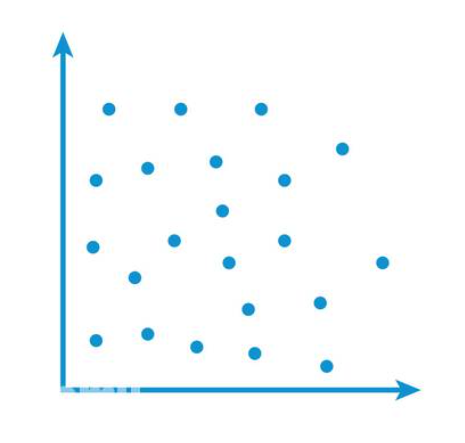
what type of correlation is most appropriate to describe the data shown in the scatter plot?
negligible correlation
if the values of two variables move in the same direction,
the correlation is said to be positive
in a normal distribution, about 99.7% of the data lies within three standard deviations of the mean
true
the area under the normal distribution curve represents the probability of a random variable falling within a certain range
true
a negative correlation means that as one variable increases, the other variable decreases
true
in simple linear regression, if the correlation coefficient is close to 0, it suggests there is no linear relationship between the two variables
true
the mean of the standard normal distribution is 0
true
the total area under the normal curve is infinite
false
in simple linear regression, the independent variable and dependent variable must always have a linear relationship
false
a correlation coefficient of 0 indicates that there is no linear relationship between two variables
true
for a normal distribution, its mean, median, and mode are equal
true