C4.1 - Populations & Communities
1/22
There's no tags or description
Looks like no tags are added yet.
Name | Mastery | Learn | Test | Matching | Spaced | Call with Kai |
|---|
No analytics yet
Send a link to your students to track their progress
23 Terms
Population
A group of individuals of the same species living in a specific area at the same time, sharing resources and interacting with one another.
Estimation of population size
Random sampling: every member of a population has an equal chance of being selected for the sample
sampling errors are always possible: difference between the true and estimated value
to reduce sampling error —> bigger quadrants
methods depend on if sessile or motile
Sessile: random quadrat sampling
Mark boundary + generate random numbers to determine coordinates + estimate how much of total area covered by quadrants + estimate population size
Standard deviation indicates the degree of variability
Motile: capture-mark-release-recapture + the Lincoln index
capture - mark - release - recapture - calculate Lincoln indexx
m = number of individuals captured + marked first time
N = total number of individuals captured in 2nd sample
R = number of recaptured marked individuals
M x N/R
Assumptions made: no migration, no deaths, marked + unmarked have same chance of being recaptured, no births, marks remain visible (carving shell), marks do not affect survival (maybe it causes them to be eaten by predators)
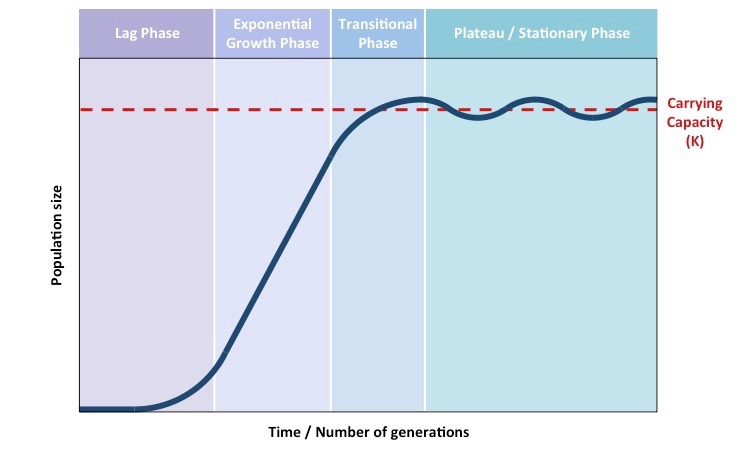
Population growth curves
Graphical representations of how populations change over time, often including phases such as lag, exponential, transitional + plateau/carrying capacity phases - Sigmoid-curve
EXAMPLE: Eurasian collared dove
Lag
An adaptation period
Doves are adjusting to their new conditions
The length of the lag phase can vary considerably - based on how different the conditions are from the conditions that the bacteria came from
Exponential: happens when density dependent factors are not effective/movement into a new niche where resources are abundant
reproduction
little to inhibit growth (like resources or space is not a limiting factor)
Positive feedback (more doves = more doves)
Transitional
Growth slows
Not exponential
Resources are limiting factor
Plateau
Equal births and deaths
Max population number the ecosystem can support
Modelling of the sigmoid population growth curve
Using duckweed / yeast
Start with small number of organisms + abundant resources - exponential growth stage
As time goes on can estimate populations + at what population size is carrying capacity reached
Can investigate carrying capacity or variables that affect growth
Negative feedback control of population size by density-dependent factors
Negative feedback control: populations might rise and fall periodically but are relatively stable over time
factors bringing populations down when too high and up when too low
Density-Dependent: have an increasing effect when the population is bigger
Disease/parasites
Predation
Competition
Density-Independent: same effect no matter the population size
Flooding
Drought
Forest fire
Example:
if way over carrying capacity with more breeding + fewer deaths - density dependent factors play a big role in population size
Density dependent factors cause more deaths and fewer births
if way below carrying capacity with more deaths + fewer births - density dependent factors don’t play a big role
Density dependent factors cause more birth + fewer deaths
Competition vs cooperation in intraspecific relationships
Relationships that exist between individuals of same species
Competition: occupy the same ecological niche
In plants = Competition for light: Wild garlic = crowded in woodland so not all get light, Competition for pollinators in flowering plants: honey bee is dusted with pollen as feeds on nectar in dandelion, Competition for soil nutrients
In animals = competition for food, territory, mates
Leads to natural selection because some individuals will have traits that help them outcompete others
Cooperation: mutually beneficial relationship
Parental care in animals: one female eider duck take care of 40+ offspring not only own offspring
Defense against predation: California sea lions circle ‘bait ball’ of Mackerel - tightly packed + move fast
Communal roosting in animals: Emperor penguins huddling to conserve body heat
Community
Group of populations living/interacting together in an area
Herbivory as a category of interspecific relationship within communities
Primary consumers feeding on producers
may or may not kill the producer
E.g.
Sheep grazing grasses
Aphids eating sap from phloem
Predation as a category of interspecific relationship within communities
One consumer species (predator) killing + eating another consumer species (prey)
E.g.
hawk eating a mouse
Dolphin eating a fish
Ladybug eating an aphid
Predator-Prey relationships as an example of density-dependent control of animal populations
Cyclical process - more prey = more predators food = more predators = eat more prey = less prey = less predator food = less predators = less predation = more prey
Mutualism as a category of interspecific relationship within communities
Two species living in a close association, both benefiting from the association
usually from different kingdoms because they bring very different things to the relationship
E.g.
Photosynthesising zooxanthellae (algae) living in polyp cells of hard corals + exchanging materials with corals
Coral produces co2 for algae + algae produces o2 + carbohydrates for coral
Coral provides protected environment close to the surface where algae can absorb light
Mycorrhizal fungi growing into roots of orchids + exchanging nutrients
Mycorrhizal fungi penetrate seed + provide mineral ions (nitrogen, phosphorus) + water
Orchids is dependant on mutualistic relationships because is tiny seed with little food storage
When orchid photosynthesis = provide mycorrhizae with carbohydrates
Rhizobium bacteria living in root nodules of Fabaceae family (peas) + exchanging materials with the plant
Rhizobium bacteria can ‘fix’ nitrogen from air + convert to ammonium/nitrate ions and supply that to plant
Fabaceae plant supply bacteria with carbohydrate + protected place to live
Nitrogen availability = limiting factor to growth - cannot obtain from air only from soil
Parasitism as a category of interspecific relationship within communities
One species (parasite) living inside/on surface of host + obtaining food from the host - host is harmed but not killed, parasite benefits
E.g.
Ticks on skin of deer feeding by sucking blood
Roundworm living in gut of raccoons + absorbing foods digested by racoon
Pathogenicity as a category of interspecific relationship within communities
One species (pathogen) living inside other species (host) + causing disease in host
E.g.
Potato blight fungus infecting potato plants
Tuberculosis bacterium infecting badgers
HIV in humans
Interspecific relationship vs Infraspecific relationship
Interspecific: relationships between different species
Infraspecific: relationships between individuals of the same species
Interspecific competition as a category of interspecific relationship within communities
Two species competing for a limited resource (plants = water, light, nutrients / animals =water, food, territory, oxygen)
E.g. Barnacles competing for space + food on rocky shores/trees
Tests for interspecific competition
Testing for interspecific competition:
Chi-squared test for species association
Field observation: random quadrat sampling to collect quantitative data over time - works very well for sessile organism
How many times species A occurs by itself and how many times species B occurs by itself
Null hypothesis: two species are distributed independently
Alternative hypothesis: two species are associated
Rejection of null hypothesis does not necessarily mean they are competing
Further investigation would be needed:
Field manipulation: removing one of competing species from area + observing consequences
Laboratory experiments: using controlled conditions to explore interactions between species + consequences when isolated
Use of the chi-squared test for association between two species
Expected: row total x column total/ grand total
To calculate X²: (O-E)²/ E
then add together all values which gives u X²
P-value is always: 0.05
Degrees of freedom: (# rows - 1) x (# columns - 1) - will always be one for BIOLOGY
Look at critical value table
where degrees of freedom = 1 and p value is 0.05 the critical value is 3.84
If X² > critical value you reject null
Resource competition between endemic + invasive species
Endemic species: occur naturally in an area
Alien species (introduced outside their range by human activity) become invasive species if successful enough
Invasive (only invasive if spread rapidly) species: alien to that environment spread rapidly due to lack of density-dependent factors like natural predators + introduced artificially (deliberately or on accident)
Endemic + invasive species competing for one+ same resources means endemic realised niche is reduced + species may go extinct by outcompeting
E.g. Eurasian red squirrel (endemic) + grey squirrel (invasive)
30 grey squirrels introduced from U.S as an ornamental species
Now: red squirrel is only found in North England, Wales, and Scotland
Antibiotics in interspecific competition
Most metabolic pathways are common to most organisms but targeting a unique metabolic pathway can control that population
Secreted by microorganisms to kill other competing microorganism
E.g. Penicillium fungi - secrete penicillin (antibiotic) which kills saprotrophic gram-positive bacteria in soil
Allelopathy in interspecific competition
Most metabolic pathways are common to most organisms but targeting a unique metabolic pathway can control that population
Some plants release secondary metabolites in soil which negatively impact growth + create a competitive disadvantage for neighboring plants
E.g. Eastern black walnut tree which releases chemical into soil —> inhibits root growth + photosynthesis in competitors
Top down control of populations
Something from higher in the food chain affects a lower level (predation)
E.g. Wolves in Yellowstone National Park (more wolves = less elk = more plants)
Predator population goes up = less herbivores = more producers = less nutrients
Bottom up control of populations
Something from a lower level in the food chain affects a higher level (nutrient sources)
Most common limitations on producers = mineral nutrients in soil, light, water
Not enough nutrients in soil = not many producer = not many herbivores = not many predators
Meres
Small lakes
Shallow meres: sunlight penetrate to bed, water plants photosynthesise to top, invertebrates shelter among water plants + feed on algae (keep water clear)
Deep meres: sunlight can’t penetrate far (bc dense population of algae), fish easily find invertebrates, invertebrates feed less on algae, dense growth of algae
Carrying capacity
Maximum population size that an organism can support