ch 10 Basic Macroeconomic Relationships and GDP Analysis
1/27
There's no tags or description
Looks like no tags are added yet.
Name | Mastery | Learn | Test | Matching | Spaced |
|---|
No study sessions yet.
28 Terms
GDP
Total expenditure in an economy: C + I + G + NX.
C
Consumption; household spending on goods and services.
I
Investment; spending on capital goods for future use.
G
Government spending on goods and services.
NX
Net exports; exports minus imports.
DI
Disposable income; income available for spending or saving.
S
Savings; portion of disposable income not spent.
Dissaving
Consuming more than disposable income allows.
APC
Average propensity to consume; fraction of income consumed.
APS
Average propensity to save; fraction of income saved.
MPC
Marginal propensity to consume; change in consumption per income change.
MPS
Marginal propensity to save; change in saving per income change.
Investment Demand Curve
Graph showing relationship between interest rates and investment.
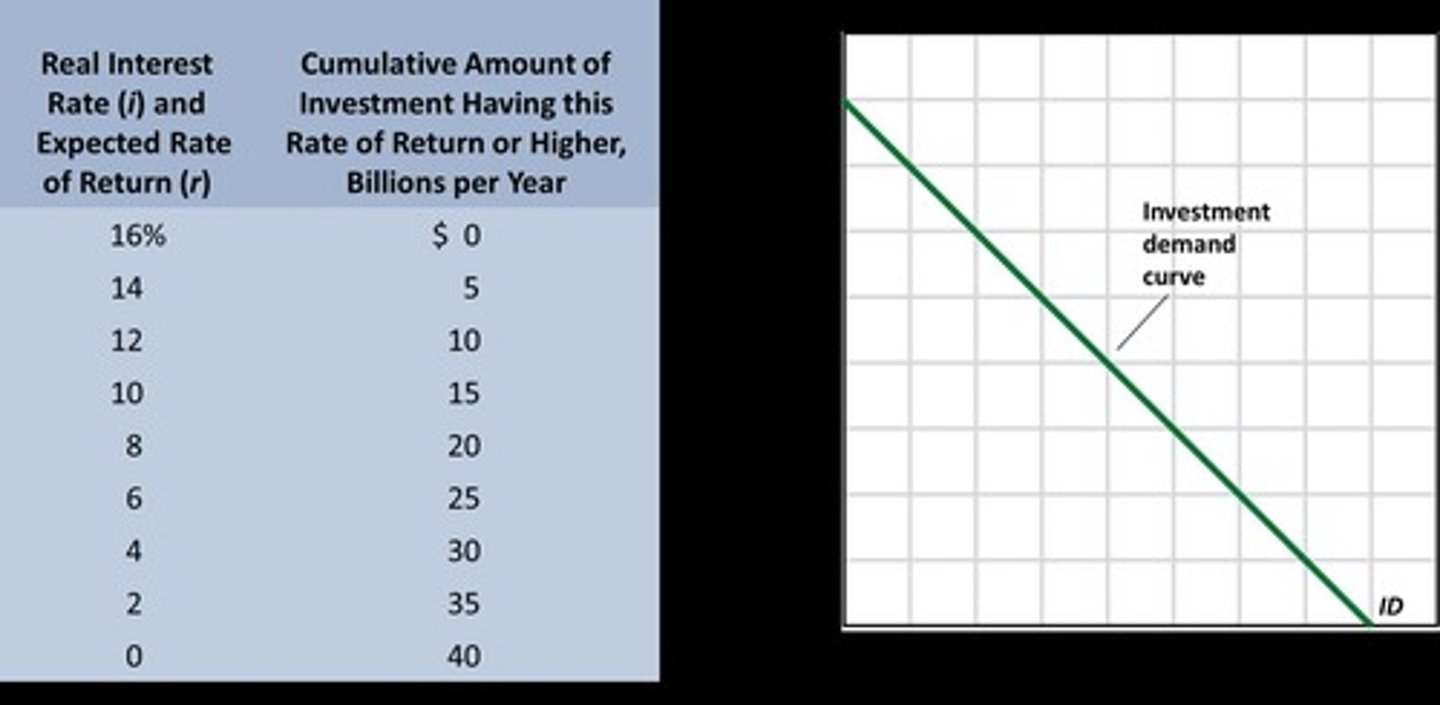
Expected Rate of Return
Projected profit percentage from an investment.
Real Interest Rate
Nominal rate adjusted for inflation expectations.
Multiplier Effect
Change in GDP resulting from initial spending change.
Multiplier Formula
Multiplier = 1 / (1 - MPC).
Nonincome Determinants
Factors affecting consumption beyond disposable income.
Wealth
Total assets owned by an individual or household.
Borrowing
Taking loans to finance consumption or investment.
Expectations
Future outlook influencing consumer and investor behavior.
Real GDP
GDP adjusted for inflation; reflects true economic output.
Instability of Investment
Investment fluctuations due to various economic factors.
Changes in Investment Demand
Shifts caused by costs, taxes, and expectations.
Variability of Expectations
Fluctuations in consumer and investor confidence.
Economic Domino Effect
Cascading economic impacts from individual spending changes.
Consumption Schedule
Graph showing planned consumption at different income levels.
Saving Schedule
Graph showing planned savings at different income levels.