Quality control, Quality Assurance, Statistics
1/73
There's no tags or description
Looks like no tags are added yet.
Name | Mastery | Learn | Test | Matching | Spaced | Call with Kai |
|---|
No analytics yet
Send a link to your students to track their progress
74 Terms
quality assurance
n Well defined, organized program designed
to enhance patient care through ongoing
assessment of important aspects of patient
care and the correction of identified
problems
n The evaluation and monitoring of all
aspects of a process or system to identify,
correct, and prevent unacceptable results
what does quality assurance include?
n Ensure quality in laboratory testing and test results.
n Reduces laboratory associated medical errors.
n Improves patient safety
n Control/monitor personnel competence
n Quality of test materials, reagents, instruments
n Education/training
n Reporting of results
n Patient & physician satisfaction
n It is the patient that becomes the ultimate beneficiary of
improved services and reliable test performance.
QA in the lab
n QA in the laboratory includes all processes to
ensure quality results.
n QA is the Sum of all the process
n Coordinated events... not a single event.
n Provide the best services to assist physicians in
maintaining excellence in patient care.
n Results in best outcomes for patients.
n It is the sum of three QA components:
– Pre-analytical
– Analytical
– Post analytical
quality control
n QC is a Set of statistical methods
n For monitoring Test Characteristics
n Establishes Accuracy and Precision
n Recognizing and minimizing analytical errors.
n Reduce systematic and random errors. “Zero Defects”
n Detects “out of control” situations before they become critical.
n Imparts credibility and reliability of test results for physicians
n Eliminates crisis management
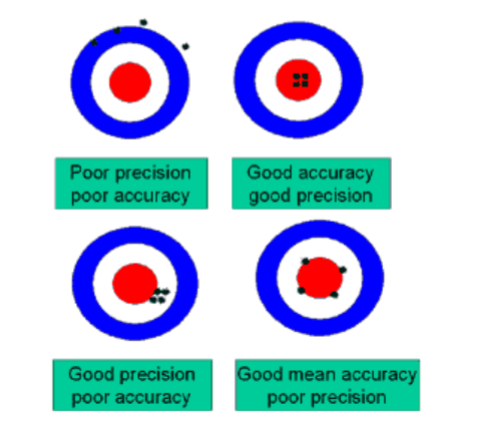
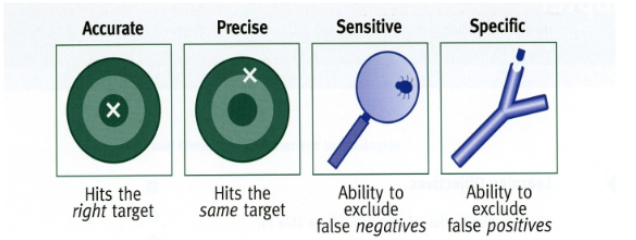
accuracy
n The extent to which a measurement agrees
with the true value.
n The closeness of a test value to the true
value
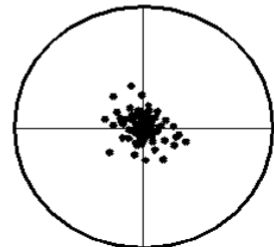
precision
n The agreement between
replicate measurements.
n Reproducibility
n Measured by variance.
n The smaller the variance,
the greater the precision
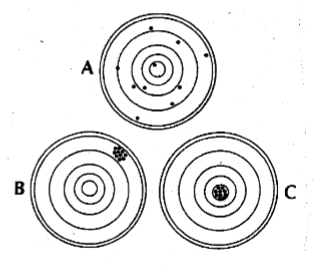
accuracy vs precision
mean
n The arithmetic average of a group of statistics (observations)
n Measure of the central tendency of the distribution
n Related to accuracy and systematic error
n Measures the middle or center of distribution.
n Therefore, should be equal dispersion of values above and below the
mean
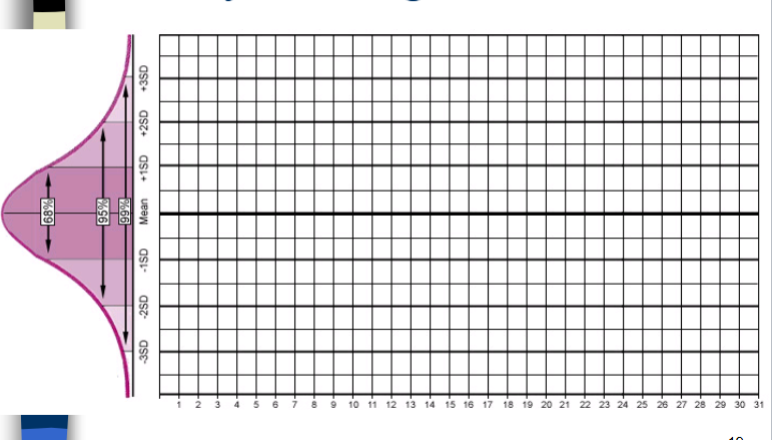
n Locations and dispersion in Gaussian distribution
_
X = ΣX/n
μ = ΣX/n
median
n The middle value of a set of numbers
n Divides the observations into two groups
n Each containing equal observations
n One group smaller, one group larger
n Observations are arranged in increasing order
n 50% of the values lie above and below the median
n Odd number; middle value
n Even number; average of two middle values
range
difference between the largest and smallest value
variance
s² = Σ(X - X)² / n-1 = σ²
n The measurement of precision about the
mean
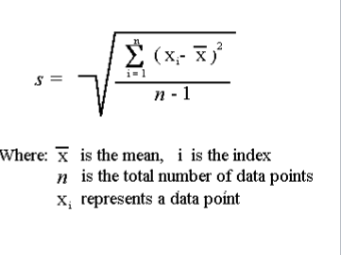
standard deviation
n (SD or s) Is the measure of
precision or dispersion of
values about the mean.
n Square root of variance
n √σ2 = σ
n Related to imprecision and
random error
n The > the S.D.,
– The greater the random error
– And the poorer the precision
coefficient of variation
n An expression of the standard deviation as a % of the mean
_
n CV = s/Mean x 100, CV = (s/x)100
n Comparison of the relative variability in two sets of values
n Not all lab data is expressed in similar units of measure
gausian distribution
n The normal distribution of occurrences or the
normal frequencies of values.
n 68% of the values will be within the X + 1s
n 95.5% of the values will be within the X + 2s
n 99.7% of the values will be within the X + 3s
confidence limits, confidence intervals
According to the Central Limit Theory
n The limits between which we expect a specified proportion of a population to
lie
n The percentage of data contained with intervals that include the mean SD units
n Distribution of observations about the mean will follow a Gaussian
distribution
n If we say “68.2% of all data lie within some value of the true mean...”
n Then this value serves as a 68.2% confidence limit.
n 95% confidence limit = Mean ± 2 SD
n 99% confidence limit = Mean ± 3 SD
levy-jennings charts
n Control values are plotted on the Y axis versus time on the
X axis.
n For each control monitored...
– Calculate the Mean, 1s, 2s and 3s values
n Label mean ± 1s and ± 2s on LJ chart
– 95 % tolerance limits
n Charts - specific for each lot number
n LJ chart allows for visual inspection of daily control values
n Inspect charts using the Westgard Multi rule system
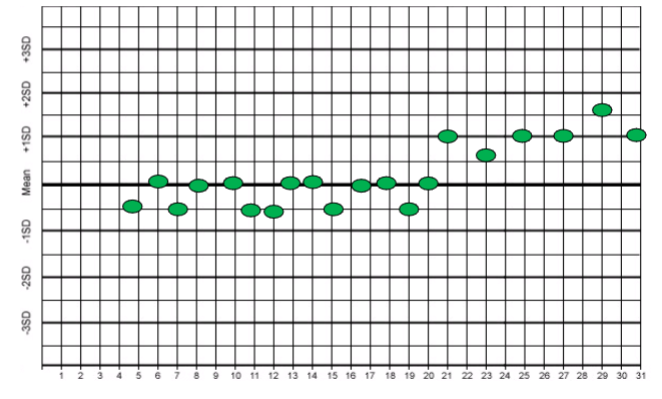
“in control” situations
n Normal dispersion about the mean
n Mean is the central tendency, central limit
– Approximate frequency of values above and below the
mean
n Values are between +/- 2 s
– 95% C.I.
n No shifts or trends
n Reagents and controls have not deteriorated
n No evidence of Random or Systematic error
out of control situations
n When control values fall outside the 95 % C.I.
n Shifts and/or trends
n Show variance or imprecision
n And inaccuracy in test values
n Random or system errors
n Reagents, operator, instrument failure
n Needs remedy, troubleshooting, resolving
n To restore accuracy and precision
shift
n Values suddenly distribute themselves to one side of the
mean
n An abrupt change in the mean that becomes continuous
n And remain at a constant level for several consecutive days
n Indicative of something new:
– New reagents
– New Control lot numbers
– New standards
– New Instrument parts
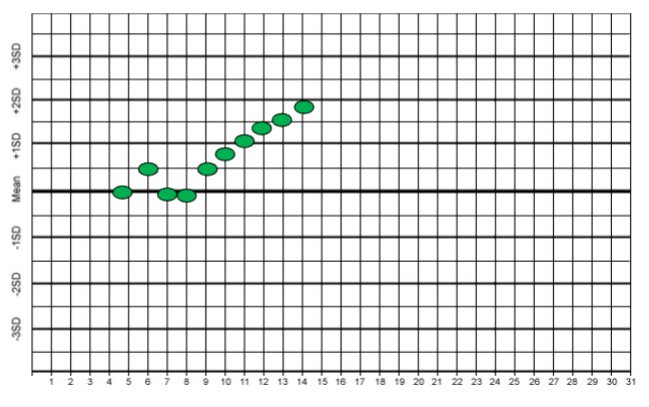
trend
n A gradual change of the mean that proceeds in one
direction.
n Systematic error
n Drift of values over several consecutive days
n Occurs when the analytical method suffers from
progressively developing problems
n Persist over several consecutive days (5)
n Indicates
– Systematic error
– Gradual deterioration of reagents, standards and
controls
– Deterioration of Instrument performance
• (i.e.. Light source, detector, electrodes)
random error
– Error that whose sources cannot be identified,
predicted or determined
– Are the result of chance, and do not affect the
entire batch
– Instrument/operator variability
– Affect precision
– Cannot be detected by control values
systematic error
n Systematic Errors affect all determination in the
batch run
n Can be detected using control specimens
n May be due to:
– Deterioration of reagents
– Deterioration of control material
– Instrument calibration drift
– Deterioration of instrument components, (detectors,
electrodes, optics, tubing)
– Interfering substances that give false values
westgard multirule system (12s)
– One control measurement exceeding control
limits of X + 2s
– Provides a warning
– Does not mean to reject an entire batch run
13s Rule
n When one control
measurement exceeds
control limits set at X
+ 3s
n The control rule
whereby a run is
rejected
n Primarily sensitive to
random error
22s rule
when two consecutive control measurements exceed the same limit, which is either X + 2s or x - 2s
the run is rejected
R4s rule
when the range or difference between the high and low control measurements within a run exceeds 4s
a run is rejected
primarily sensitive to random errors
41s rule
when four consecutive control measurements exceed the same limit, either x + 1 s or x -1s
the run is rejected
sensitive to systematic errors
10x rule
n When 10 consecutive
control measurements
fall on one side of the
mean
n sensitive to systematic
errors
n Run should be rejected
trouble shooting procedures for out of control situations
n Rerun previous control
n Review maintenance or problem log
n Inspect instrument visually
– for leaks, disconnected tubes, wires, reagent depletion
n Observe for persistent abnormality
n Review QC data for shifts and trends
n Identify specific nature of problem
n Check trouble shooting manual
n Notify supervisor and manufacturer's service department
n Complete necessary adjustments for correction
n Document symptoms and corrective action taken
n Repeat controls to ensure return to functioning state
control materials
n Material to be tested in patient runs
n Has a known 95% reference range values for
several blood analytes
n Used as a target for assay methods
n Gives reasonable determination of accuracy and
precision of the test run
n Monitored daily, weekly, monthly for quality
control purposes
characteristics of control materials
n Should be the same matrix as the test specimen
n Should be stable after reconstitution for several days
n Should be available in aliquots
n Should have little vial - vial variation
n Should be performed in decision making ranges
n Should be checked visibly for deterioration
n Should always check expiration dates
commercial control materials
n ASSAYED CONTROLS
– Accompanied by a list of values
– State the mean + 2s for each lab parameter they are
tested for
– Match the lot number of the vial to the number of the
certificate
– Requires reconstitution with volumetric pipet (if
lyophilized
– More expensive than Un-assayed controls
unassayed controls
n Constituent values are unknown
n Must be assayed within the institution prior to
implementation
n Must compute your tolerance limits prior to
implementation
– Mean
– Sd
– Mean + sd = 95% c.l.
n Less expensive than assayed material
control levels
n The Joint commission (TJC)
– Accreditation of Health Care Organizations
– Must run a minimum of 2 level controls, or...
n Perform controls in medical decision-making
ranges
– 3 control levels for most chemistry and heme values
– Low, Normal and High range controls
– 2 decision levels for urinalysis and coagulation
n Clinical Laboratory Improvement Act, (CLIA)
frequency of control testing
n Run controls with each run of manual test
procedures
n Run once each shift
n Minimum of every 24 hours
n Run each after Calibration sequence
calibration materials
n Calibrator or Standards:
– Material whose pre-test values are well established
– To be used in the calibration of test methods
– A sample with known concentration of material
– Values that have a reasonable estimate of truth
– Used to set or adjust the accuracy, linearity or
sensitivities of analytical methods
primary standards (calibrator)
aqueous based solution or material with pre-determined value
verifying the pre-test values of blood analytes
secondary standard (calibrator)
material with the same matrix as the specimen (i.e serum or urine calibrators)
reference methods or method of choice
n A method whose accuracy and precision is well
established
n Used as reference point to compare other methods
n Mass Spectrometry
n Gas chromatography
n HPLC
determination of population reference (normal) ranges
used to interpret lab results
used to determine medical decisions
monitor patient therapy
use of incorrect reference intervals
can compromise the quality of patient outcomes
reference ranges
each laboratory must set its own reference ranges (CLIA)
the patient/client population from one facility could be quite different from a neighboring facility
reference range can change with geography, age, ethnic origin, and sex
selection of subjects for study
n Use 20-40 subjects
n Provide a variety of demographic factors
– (age, race, activity level)
n Equal representation from both sexes
n Assume subjects are healthy
n Subjects should not suffer from known
disease
control of pre-analytical variables
n Prior diet
n fasting/nonfasting
n physical activity
n stress
n time of collection
n body posture
n site preparation
n equipment/technique
n transport
n separation of serum
n storage
statistical methods
calculate the mean
calculate the standard deviation, (s)
calculate the 95% confidence limits (interval)
mean +- 2s
method evaluation
linearity
precision
accuracy
linearity
preliminary checks on the accuracy of the new method
performed a by assaying a set of standards of known purity
standards must span the desired range of analytical measurement
CLSI (Clinical laboratory standards Insititute)
method: uses patients samples having values at specific levels
plot concentration vs absorbance
n Check for linearity and accuracy of measurement
at major medical decision points
n Check the low and the high end of the
manufacturer’s published range of linearity
n The laboratory cannot report patient results that
exceed the limits of linearity established in the lab
– These values need to be diluted so assay values fall
within linearity
– Multiply result by dilution factor
measurement of precision
within run - precision
between-run precision
F-test
within-run precision
checks the ability of a method to repeat a value regardless where the sample is placed in the run
aliquotes of the sample are tested/placed at selected points in the run
the SD and CV should be calculated for each value (CV < 5%)
between run precision
ability of a method to repeat or reproduce values
compares values from different test runs
this verifies that the lab will obtain the same value for an analyte on a patient even when the sample is tested on different runs
evaluation of precision between two methods
n F TEST:
– Is used to compare the precision of a new test method
to that of a reference method
– Determines if there is a statistical significant difference
in the standard deviations of the two test methods
– The F test is a comparison of the sizes of the SD of
two test methods
– F = larger variance= S12/S22
smaller variance
• S1 = is the larger SD
• S2 = is the smaller SD
F test
the paired t Test
n Must first calculate the Statistical Bias:
_ _
n Bias = Y - X
– Y = Mean of New Method
– X = Mean of Existing method
n Then calculate the SD of the differences (SDd) by
SDd = √ E [(Y - X) - Bias]2
n - 1
n Now calculate the standard error of the mean
(SEM):
SEM = SDd/√ n
n Then obtain the t value by:
t = Bias/SEM
n Compare the calculated t value with the critical t value
from the table
n If the calculated t is less than the critical T, from t chart
n Then there is no difference between the means of two
methods
n The bias is essentially zero or not statistically significant
paired t test example
n Two methods for cholesterol are compared by running 40 paired patient
samples one time on each instrument
n The following results are obtained:
Instrument Mean SD
Method x (reference) 235 mg/dl 3.8
Method y (candidate) 246 mg/dl 3.4
n Assuming the samples are collected and stored in the same manner, what is the
bias of method y?
n Bias = Mean y – Mean x = 11
n SDd = 1.20 SEM = 19
n T = 11/19 = 0.57
n T value from chart = 1.645 @ t.o5
n What conclusions can be made about the accuracy of new method?
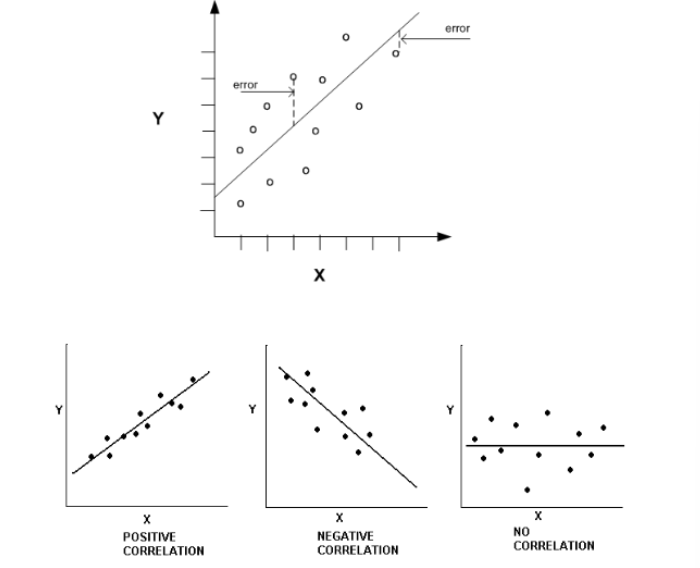
linear regression analyis
n An evaluation of the correlation between two methods
n Can be done by plotting the reference methods on the x axis and the
new method on the y axis
n Perfect correlation is achieved when values are exactly the same for
both methods
n This is indicated by a straight line
n Ideally, the slope = 1.0, Y intercept = 0
– = change Y/ change X
n y = mx + b
– x and y are the variables
– m = slope
– b = y intercept
interpretation of charts
n The > drift of origin, > the inaccuracy, the < correlation
n The > slope, > variance in new method
n the new method tends to report out higher values
– As values increase, new method looses accuracy
– Proportional error
– Measures higher and higher
n The < slope, > variance in new method
– As values increase, new method measures lower values
– Measures lower and lower
quality assurance programs
internal quality control programs
– Use of commercial controls
– Establish the target ranges for the control sample
– Monitors control results over time
– Used to detect significant changes test precision and
accuracy
– Monitors of Levy-Jennings control charts to detect
random and systematic error
external QC programs
n Laboratory uses an outside unbiased source
– to verify the quality of patient results
n Involves testing unknown samples from an outside agency
– Aka Proficiency or Survey samples
n The lab assays the unknown samples “blind assay”
n Send results back to the agency
n Accuracy and precision are determined
n Accuracy is compared with other labs using similar
methods
n Comparison by laboratories within a peer group
n Proficiency Testing
n Tied to requirements for Accreditation
types of external QC programs
Types of External QC programs
n Most common external QC program is proficiency
testing.
– College of American Pathologist (CAP) Proficiency
program.
– New York State Proficiency program.
• Necessary for testing specimens in NYS
– Pennsylvania State DOH Proficiency program
– American Proficiency Institute (API)
diagnostic method evaluation
sensitivity
specificity
sensitivity
n Analytical:
– The ability of an analytical method to detect the
smallest quantity of component that differs from zero
n Diagnostic:
– The measure of positive tests when the disease state the
test is detecting is present
– Percent of Positive tests in patients when the disease is
present
– SENSITIVITY = TP/ TP + FN x 100
specificity
n Analytical:
– The certainty that the substance being measured is that
substance only and no other substance
n Diagnostic:
– A measure of the negative test results when the disease
is not present
– Percent of subjects without the disease who have a
negative test
– SPECIFICITY = TN/TN + FP x 100
n TP = True positives
– Number of patients who have the disease and test positive
n FP = False positives
– Number of patients who lack the disease and test positive
n TN = True negatives
– Number of patients who lack the disease and test negative
n FN = False negatives
– Number of patients who have the disease but test negative
accuracy and precision
n Accuracy means the assay is determining the correct concentration.
n Precision is the reproducibility of an assay
n Sensitivity and specificity are subsets of accuracy and precision
n An assay that has the ability to produce accurate and precise results and
does not produce false positives is considered specific
n An assay that has the ability to produce accurate and precise results and
does not produce false negatives is said to be sensitive
calculations
n A manufacturer evaluates a new pregnancy test. They enlist 800
subjects, 300 pregnant and 500 non pregnant females. Calculate the
sensitivity and specificity
n Results Pregnant subjects(300) Non Pregnant(500)
n Positive 250 (TP) 4 (FP)
n Negative 50 (FN) 496 (TN)
n Total 300 (TP+FN) 500 (TN+FP)
n Sensitivity = TP/(TP+FN) X 100
n = 250/300 x 100 = 83%
n Specificity = TN/(TN+FP) X 100
n = 496/500 x 100 = 99%
predicative value, PV
Used to evaluate the diagnostic usefulness for a test
n The ability of a test to correctly diagnose disease compared
to the prevalence of the disease in the population being
tested
n The effect of disease frequency
n Incidence: number of cases of disease during a specified
period of time
prevalence: the frequency of the disease at a designated point in time
positive predictive value (PPV) of a test result
n The ability of a method to correctly predict the presence of
a disease in those who test positive for the disease
n The likelihood a positive test indicates disease
n PPV = TP/ (TP + FP) x 100 = TP/positive calls
n TP = True positives
n FP = False positives
n TN = True negatives
n FN = False negatives
negative predictive value (NPV) of a test result
n The likelihood a negative test indicates the absence of a
disease
n NPV = TN/ TN +FN x 100 = TN/all negative calls
n TP = True positives
n FP = False positives
n TN = True negatives
n FN = False negatives
example 1
n A manufacturer of a new test for Prostate Specific Antigen (PSA)
claimed the new assay was more sensitive and specific for prostate
cancer than any existing method
n In a large clinical trial, blood samples form 10,000 men were tested
with the new PSA test
n 2000 men tested positive, 8000 tested negative
n Of the 2000 positives, 1900 later developed prostate CA (TP)
n Of the 8000 negatives, 30 later developed prostate CA(FN)
n Calculate the positive predictive value:
n PPV = TP/(TP+FP) X 100
n PPV = 1900/(1900+100) X100 =
n = 95%
n So what can the physician conclude from this data?
example 2
Example #2
n After reading several articles on CA 125 test for ovarian cancer from
lay periodicals, a female patient goes to her doctor and demands to be
tested for CA-125
n At her request, the physician orders the lab test. Test results come
back negative for CA-125
n The patient wants to know if this means she doesn’t have ovarian
cancer?
n The physician quotes a recent study of 3870 undiagnosed females that
were tested for CA 125
n Of the 3870, 3096 tested negative for CA-125
n Of the 3096 negatives, 15 patients later developed ovarian cancer (FN)
– 3096 – 15 = 3081(TN)
n What is the negative predictive value?
n NPV = TN/(TN + FN) X 100
n NPV = 3081/(3081+15) x 100 = 99.5%
n How should the physician respond?
statistical significane (p-level)
n The statistical significance of a result is an estimated
measure of the degree to which it is "true" ("representative
of the population")
n Technically, the value of the p-level represents a
decreasing index of the reliability of a result
n The higher the p-level, the less we can believe that the
observed relation between variables in the sample is a
reliable indicator of the relation between the respective
variables in the population
n Specifically, the p-level represents the probability of error
that is involved in accepting our observed result as valid
p-level
n A p-level of .05 (i.e.,1/20) indicates that there is a 5%
probability that the relation between the variables found in
our sample is a "fluke."
n In other words, assuming that in the population there was
no relation between those variables whatsoever, and we
were repeating experiments one after another, we could
expect that approximately in every 20 replications of the
experiment there would be one in which the relation
between the variables in question would be equal or
stronger than in ours
n In many areas of research, the p-level of .05 is customarily
treated as a "border-line acceptable" error level
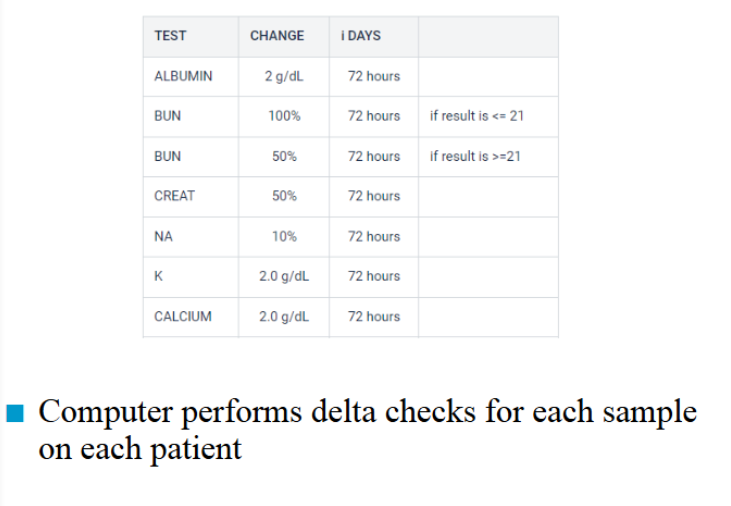
delta checks
n Method of detecting random error in individual samples.
n The δ check compares the difference of the patient’s two
most recent lab results within a 3 day period to a δ limit
(percent difference)
n Same patient
– Specific analyte
– Uses a predetermined allowable difference
n Purpose is to detect sample identification errors
n Can also be caused by random analytical errors and
interfering substances
– i.e.. Hemolytic, lipemia, non-fasting specimens, IV fluid
contamination
n Also caused by changes in disease and treatment,
– I.e.. Loss of blood, post-transfusion, electrolyte infusion
delta check example
n AST ALT ALP TP ALB TBILI
Day 1 20 15 40 8.2 3.6 0.8
Day 2 22 14 55 8.4 4.2 δ 1.0
What could be the cause of these results?
a. sample drawn from two different patients
b. misidentification/incorrect sample
c. change in disease or treatment
d. hemolysis or lipemia
e. the patient was not fasting on day 2
critical values
n Are test values which indicate a potentially life-threatening
situation for the patient
n May warrant immediate action to be taken by the physician
n Test values need to be called to the patient care area
(inpatient or outpatient)
n Document phone #, date and time, name of person you
spoke to and your name
n Have them repeat (read-backs) the values to you to check
for transcription errors
common critical values
n Potassium < 3.0 or > 6.0 mmol/L
n Sodium < 120 or > 160 mmol/L
n Calcium < 6.0 or > 13.0 mg/dl
n Magnesium < 1.0 or > 4.7 mg/dl
n Ammonia > 60 umol/L
n Glucose <40 > 500 mg/dl
n WBC < 2.0 > 30,000 /ul
n Hemoglobin < 7.0 > 20 g/dl
n Hct < 22 > 60
n Platelets <40,000 > 1,000,000 /ul
n PT > 27 sec
n APTT > 100 sec
n Salicylate > 30mg/dl
n HIV antibody: Positive