Econ Final - 9 Graphs to Remember
1/14
There's no tags or description
Looks like no tags are added yet.
Name | Mastery | Learn | Test | Matching | Spaced | Call with Kai |
|---|
No study sessions yet.
15 Terms
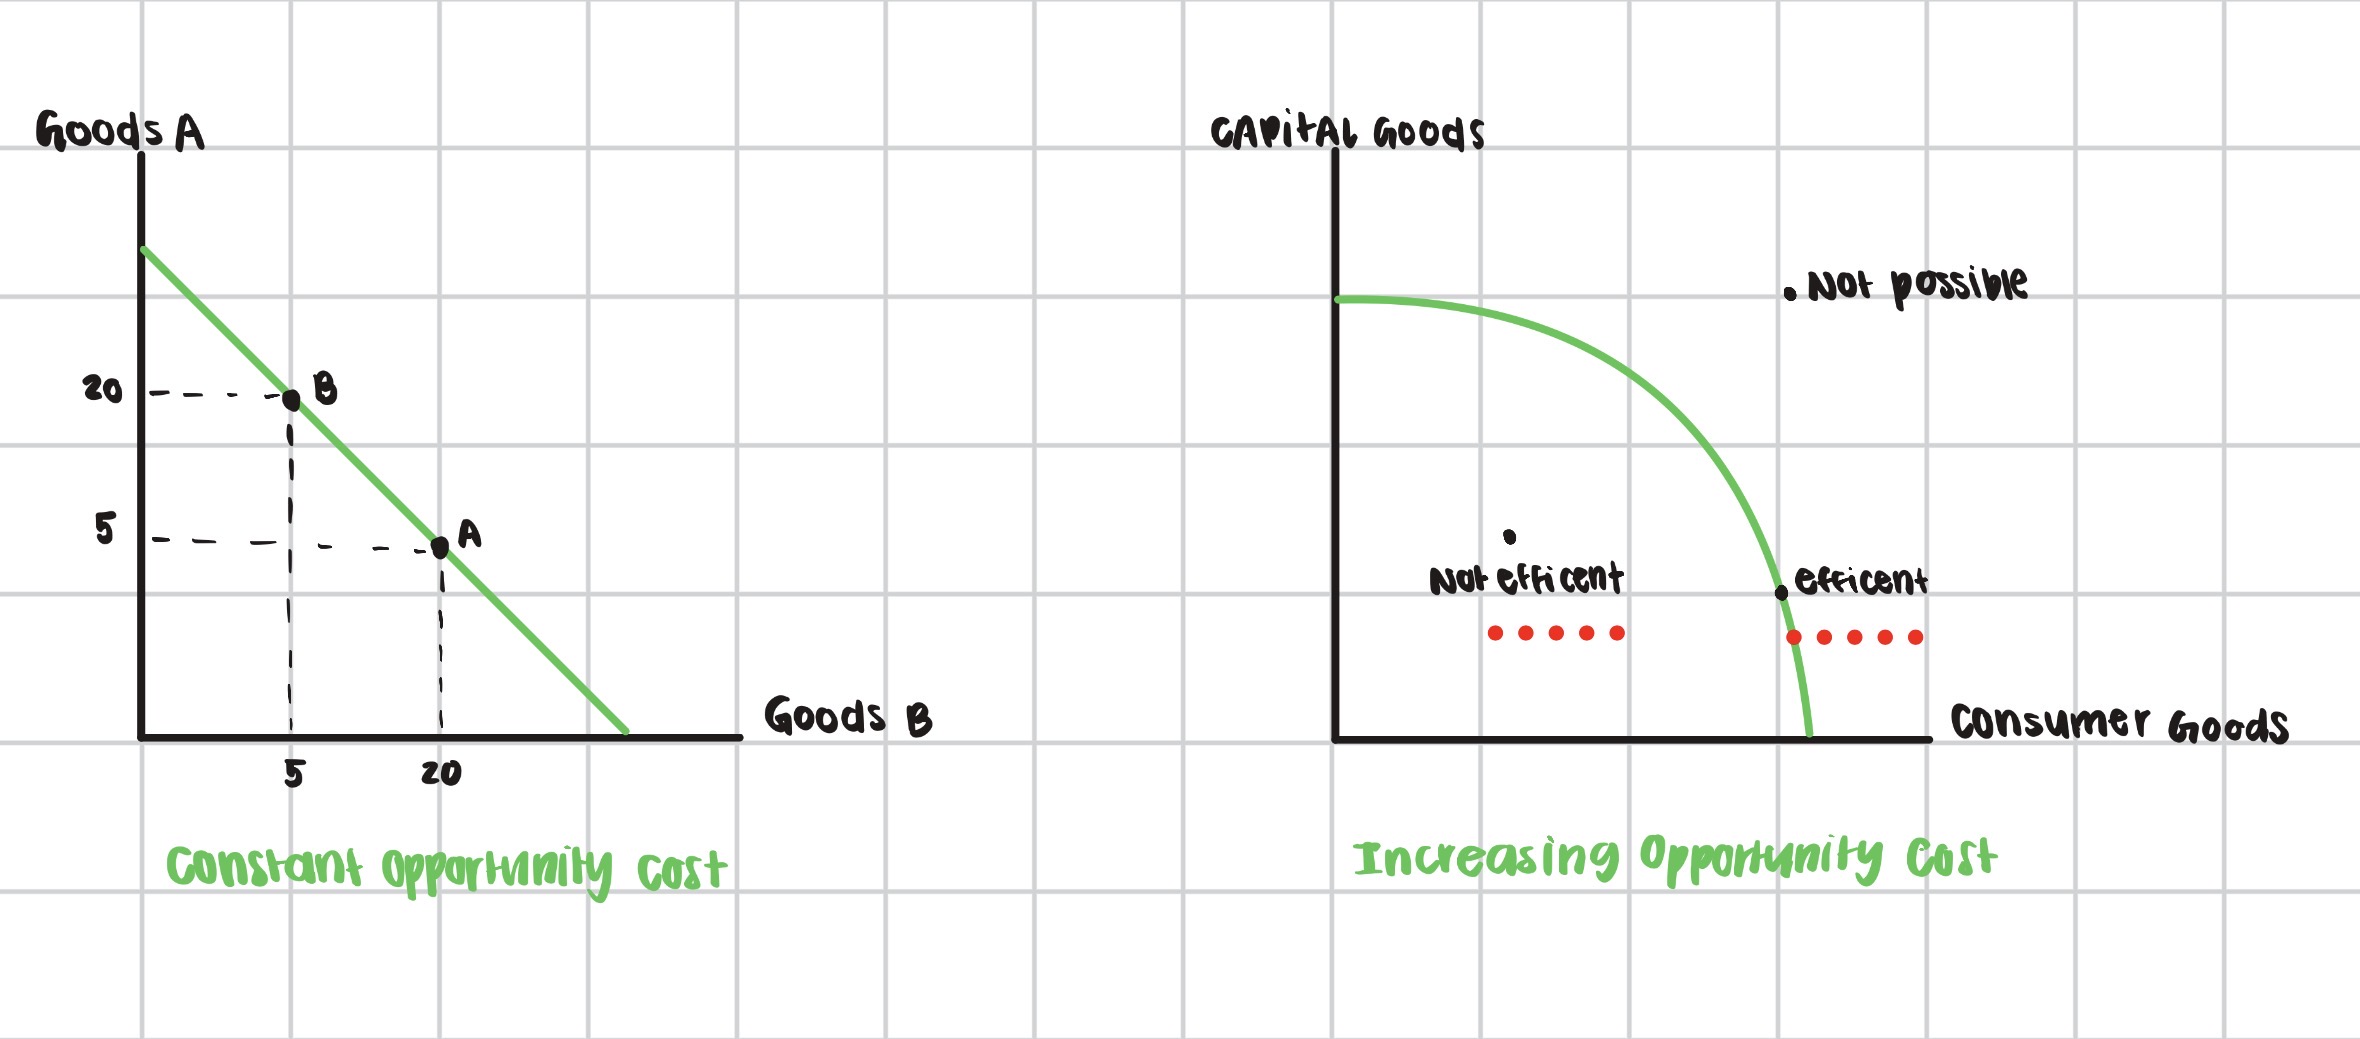
PPC Curve
Supply & Demand Curve
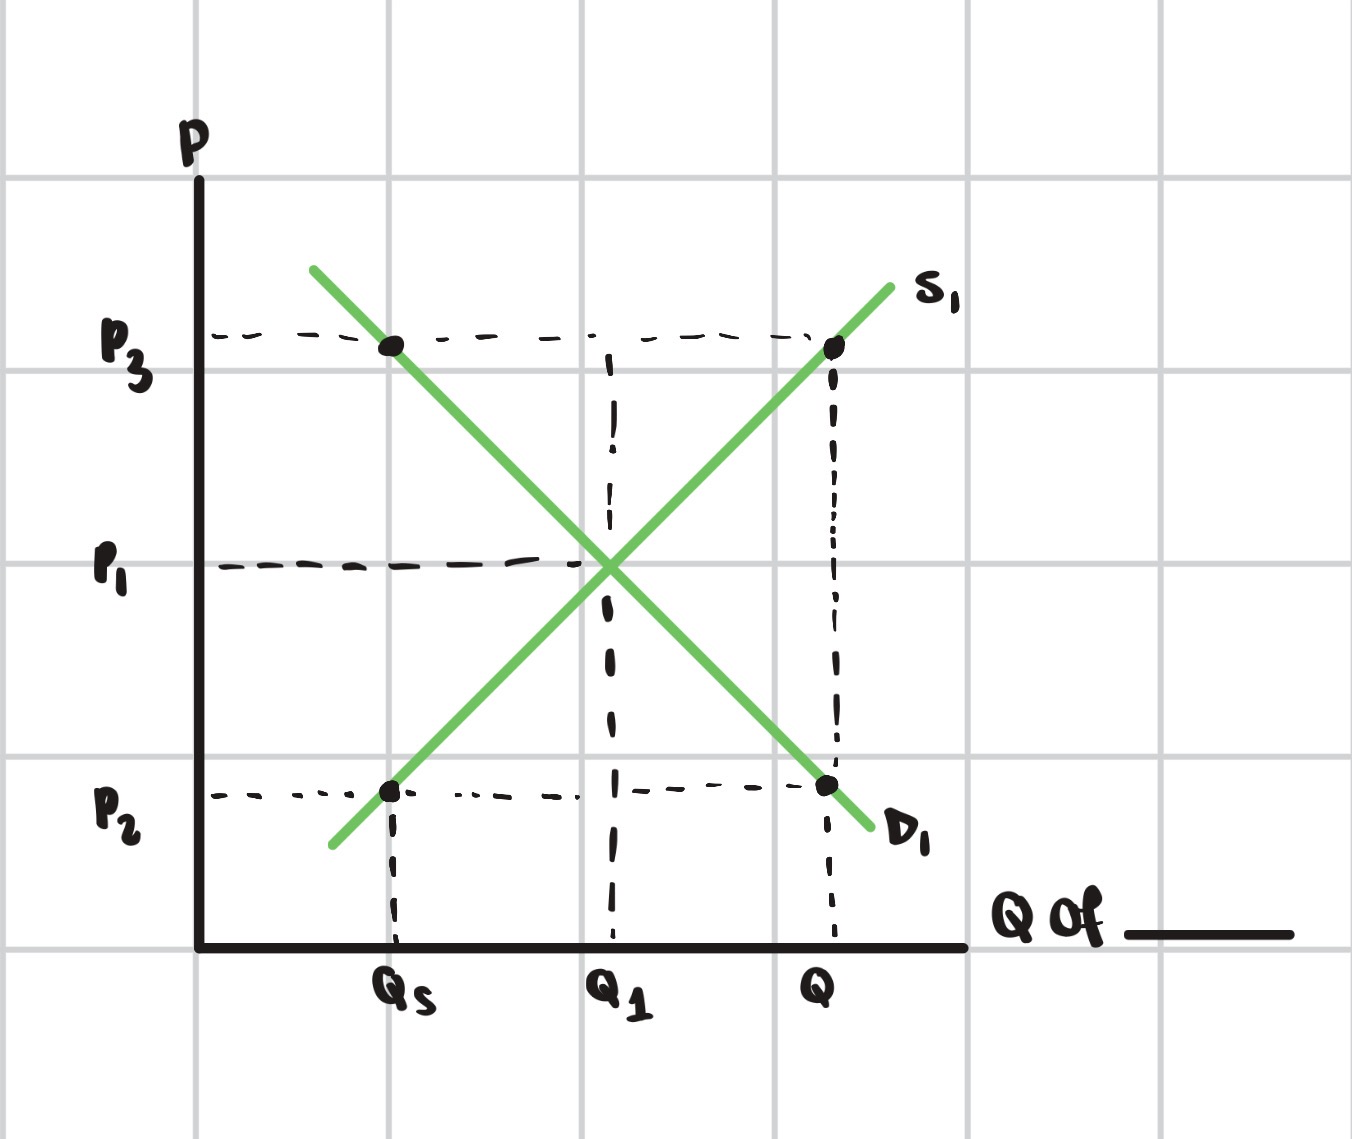
Shortage
Quantity Supply < Quantity Demanded
Surplus
Quantity Supply > Quantity Demanded
Circular Outflow
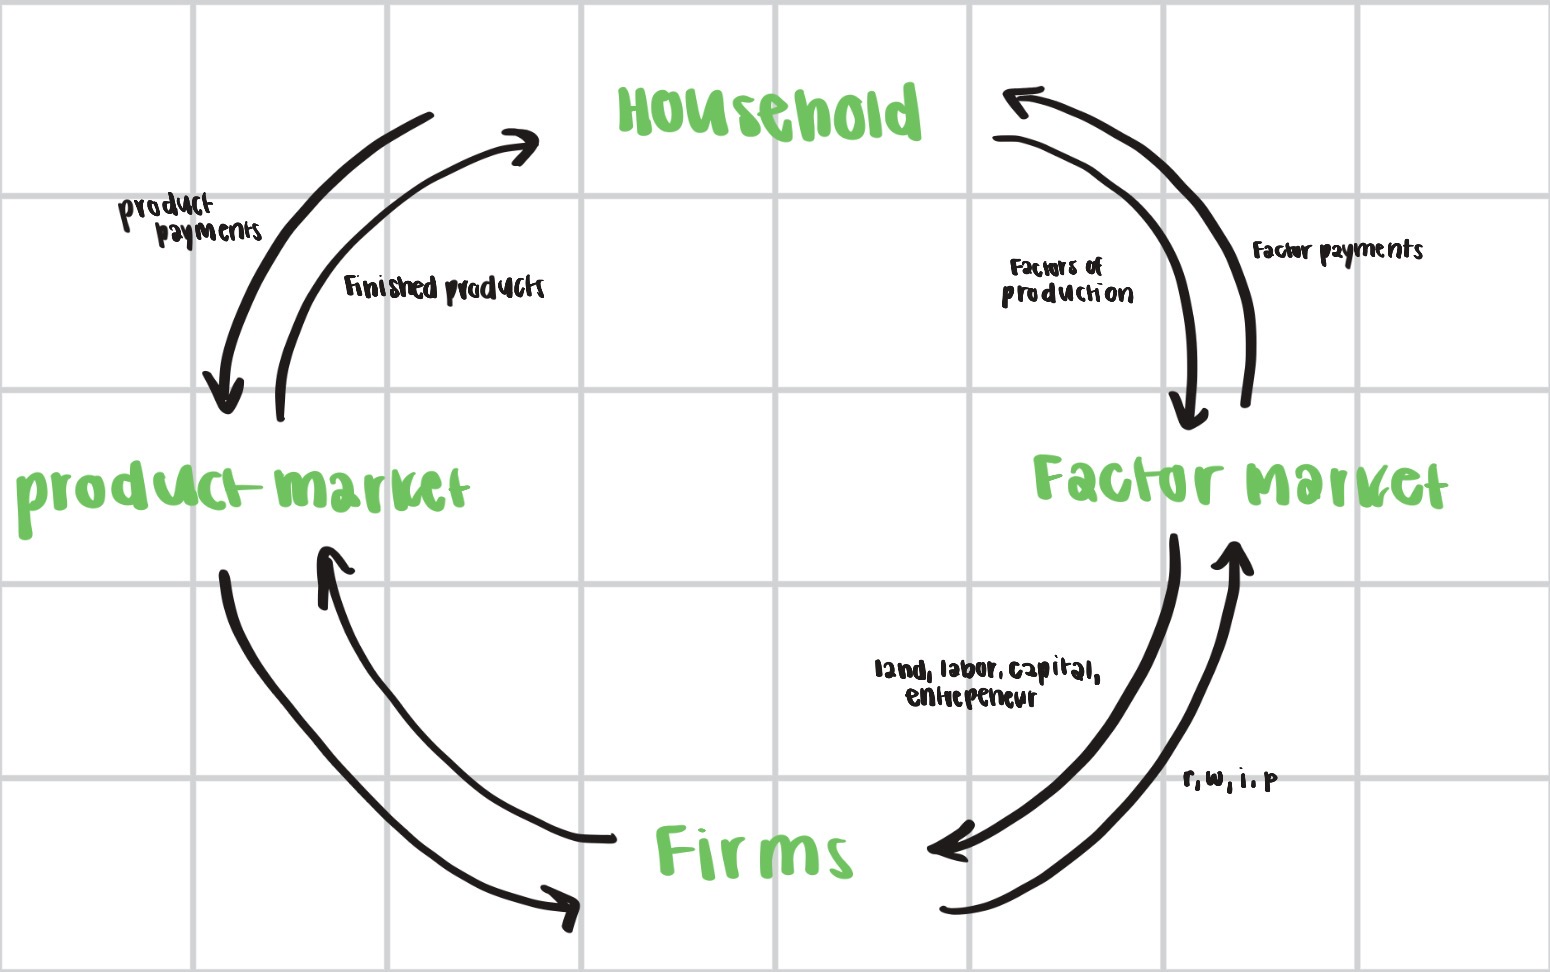
What does circular flow diagram teach us?
Shows how firms/households rely on one another
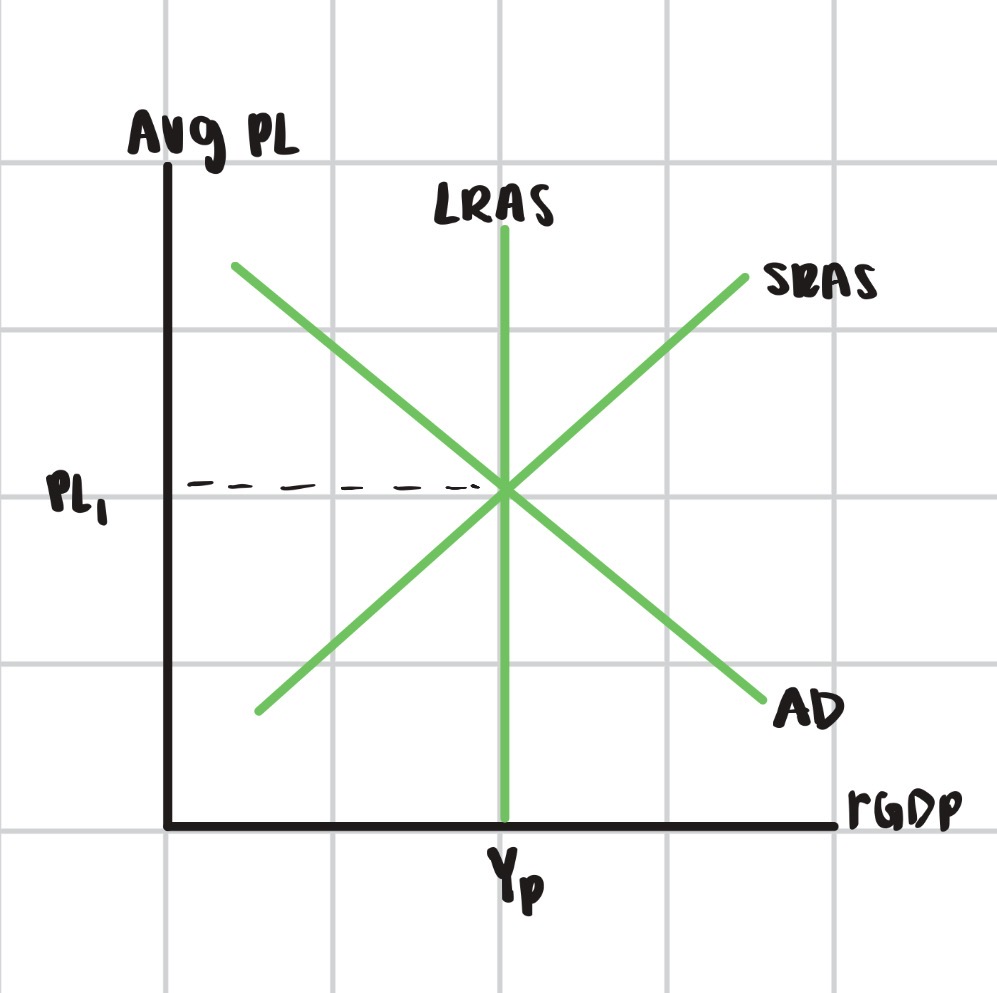
As-Ad
Loanable Funds Graph
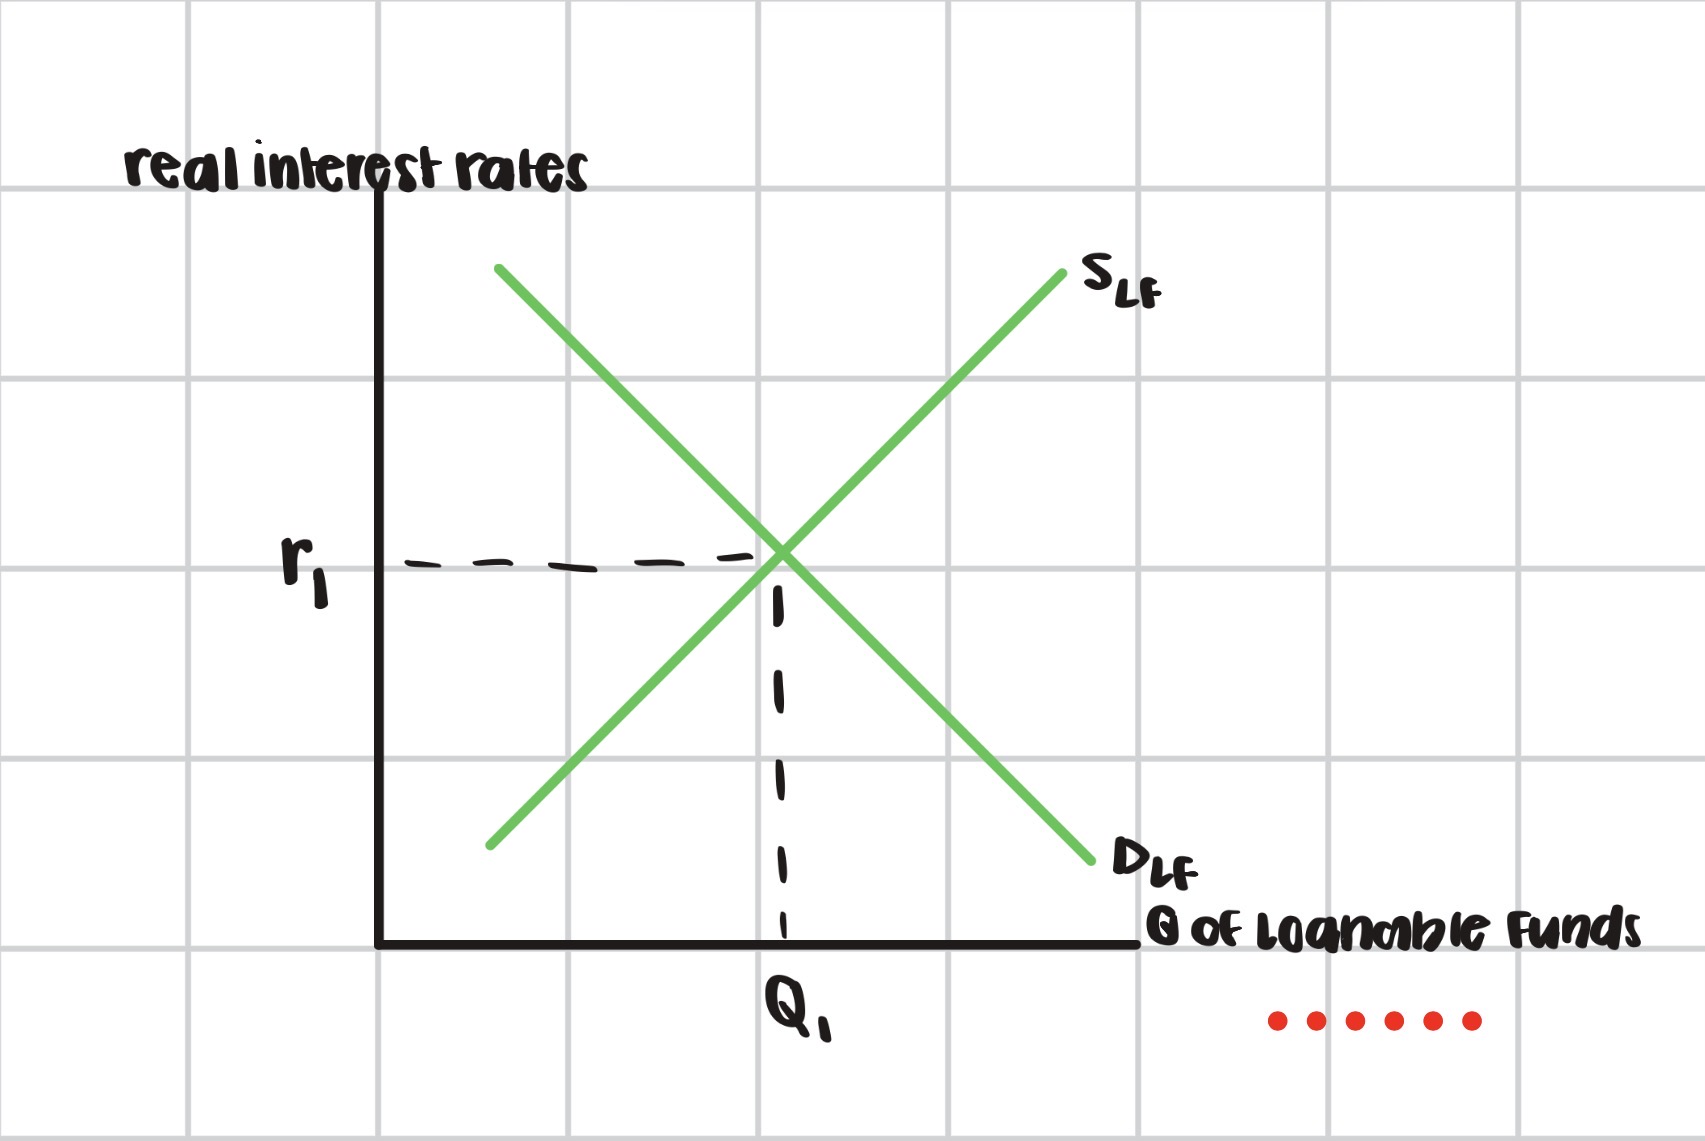
Crowding Out
Increased government deficit spending reduces private sector investment. This is because when government borrows more fund spending, it raises interest rates in the loanable funds market making it more expensive for business to invest in capital
Money Market Graph
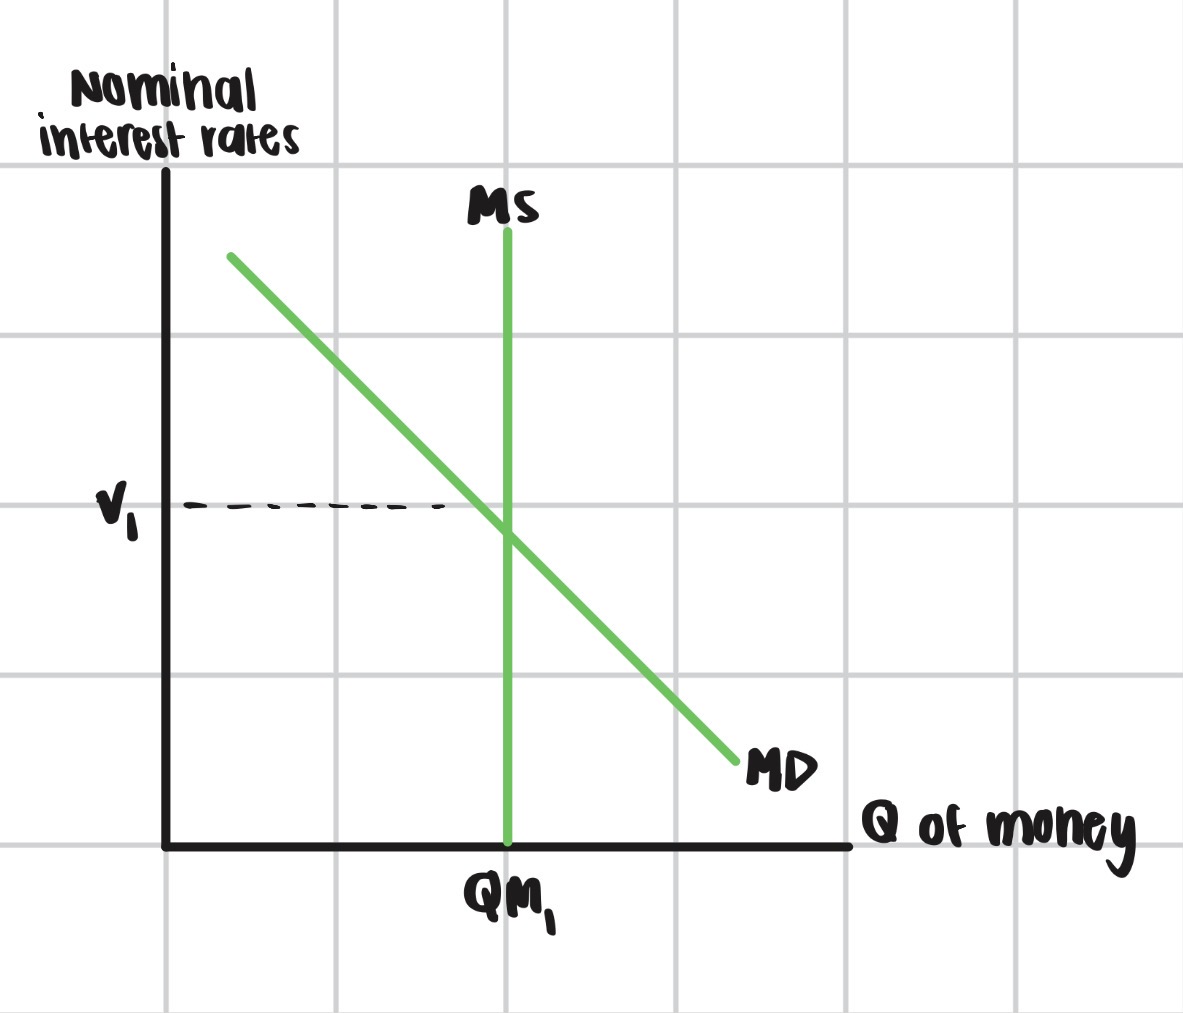
What causes money market shifts?
Factors that shift money demand:
Income
Price levels
(Banking) technology
Factors that shift money supply:
Monetary policy
Reserve Market
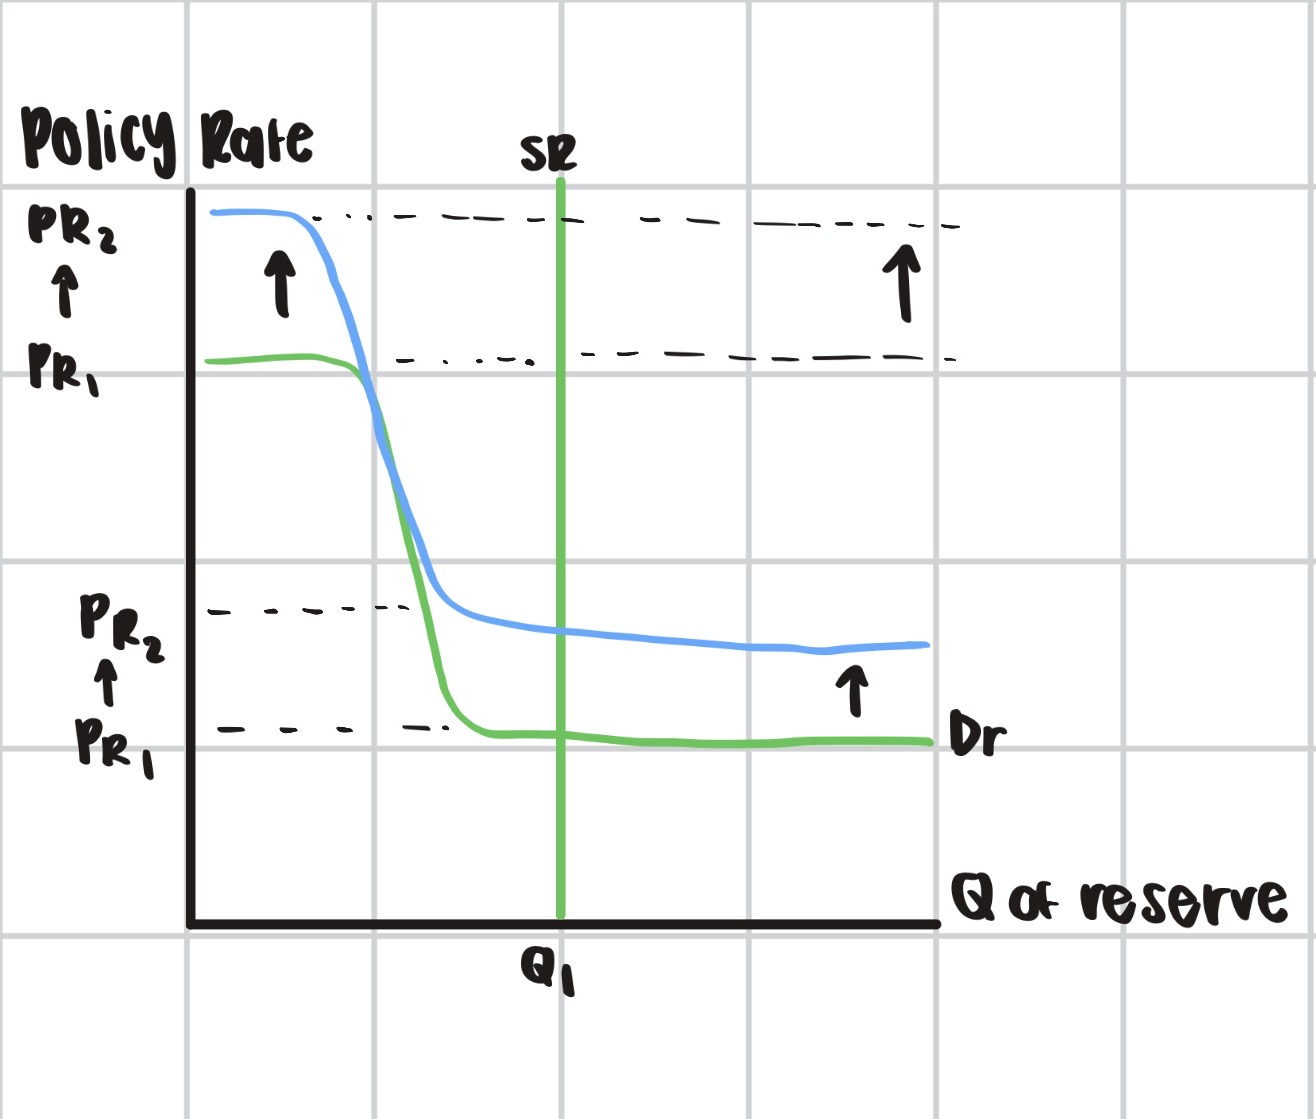
The Federal Funds Rate (policy rate)
Raise interest on reserve balances → banks lend less —> rates rise
Lower interest on reserve balances → banks lend more → rates fall
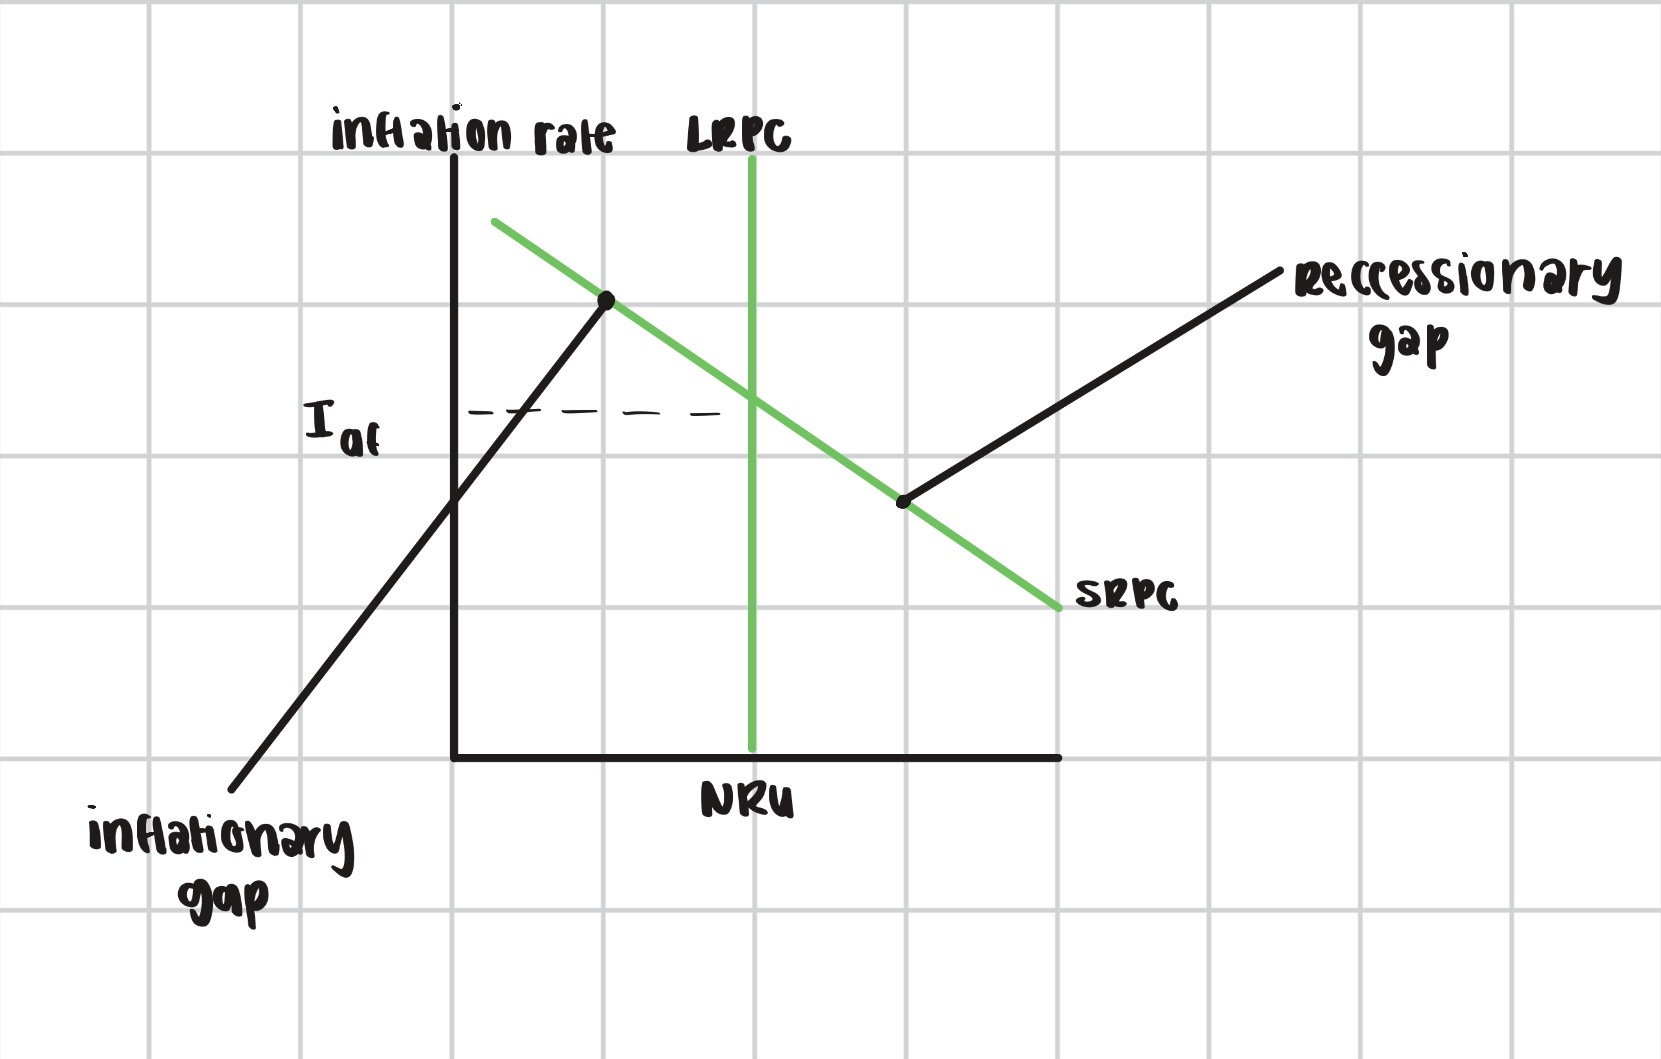
Philips Curve
(Mirrors As-Ad)
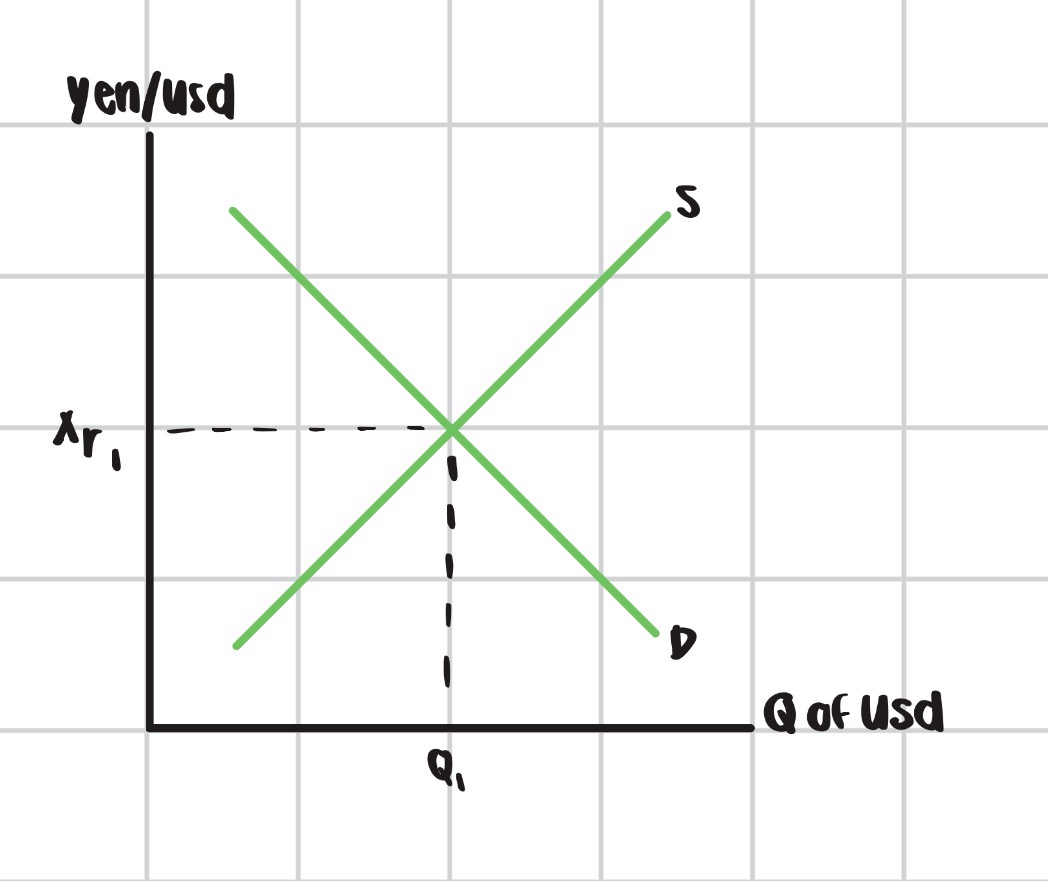
FOREX Graph