Business Theories (AQA A-Level)
1/61
There's no tags or description
Looks like no tags are added yet.
Name | Mastery | Learn | Test | Matching | Spaced | Call with Kai |
|---|
No analytics yet
Send a link to your students to track their progress
62 Terms
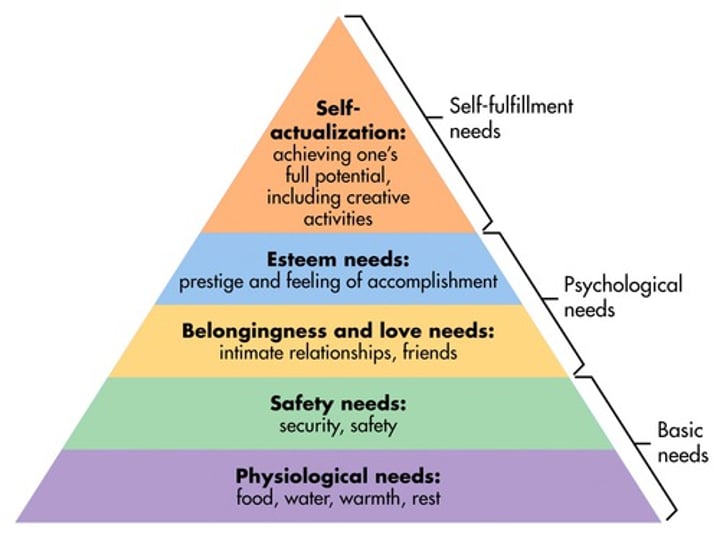
Maslow's Hierarchy of Needs
(bottom) 1. Basic physical needs
2. Safety
3. Social Needs
4. Self-Esteem
(top) 5. Self Actualisation
Herzberg's Hygiene and Motivating Factors
Hygiene factors: company policy, supervision, working conditions, pay, relations with other employees
Motivating factors: Personal achievement, recognition, interesting work, personal development
Hackham and Oldham
Believed that jobs needed to be designed to focus around people to make them motivated.
Five Key Elements: Skill Variety, Task Identity, Task Significance, Autonomy, Feedback
Taylor's Scientific Management
Created in 20th century. Believed workers were motivated by money.
Favoured division of labour and piece-rate pay (paid for level of productivity)
Bartlett and Ghosal's International Business Strategies
Measured against pressure to reduce costs and pressure for local responsiveness (adapting products for different locations/markets)
International Strategy (Bartlett and Ghosal)
- Demands in other markets similar to home market (low local responsiveness) and low pressure to reduce costs
- Centralised structure (decisions made at head office)
Multidomestic Strategy (Bartlett and Ghosal)
- Demands in different markets are very different but there is low pressure to reduce costs. Products will be adapted for different markets.
- Decentralised structure
- Different branches will look and work differently and knowledge won't be shared between separate branches.
Global Strategy (Bartlett and Ghosal)
- Demands of different markets are similar but high pressure to reduce costs
- Business structure will be centralised and the business will coordinate operations across countries to take advantage of economies of scale.
- Products remain standardised, innovation takes place centrally with knowledge passed on to different branches.
Transnational Strategy (Bartlett and Ghosal)
- Pressure to meet costs and meet local needs are both high
- Developing knowledge and ideas locally and sharing them globally.
- Balance between centralisation and decentralisation with responsibilities passed down to each branch based on experience and capabilities.
Power Culture (Handy's Organisational Culture Types)
- Centralised structure where decision making limited to few people.
- Employees likely to be more resistant to change.
- This type may struggle when business grows and cannot be run from the centre.
Role Culture (Handy's Organisational Culture Types)
- Common in bureaucratic firms where authority is defined by job title - decisions come from senior management.
- Usually have poor communication between departments so they respond slowly to change - bad in new or expanding markets.
- Avoid risks so change is quite rare
- High resistance to change from employees because they're not used to it.
Person Culture (Handy's Organisational Culture Types)
- Common in loose organisations of individual workers (eg. accountants, soliciors)
- Objectives defined by the personal ambitions - firms must ensure individuals actually have common goals
- Decisions made jointly so employees are likely to be comfortable with change - but making decisions may be difficult due to employee self-interest.
Task Culture (Handy's Organisational Culture Types)
- Emphasis on getting specific tasks done.
- Respond well to management by objectives e.g.. specific targets for departments/employees.
- Generally have low resistance to change because employees are used to it.
Boston Matrix
- Compares market growth with market share.
4 Components: Question Marks (high m. growth, low m. share), Dogs (low m. share, low m. growth), Rising Stars (high m share, high m. growth), Cash Cow (low m growth, high m. share)
Greiner's Model of Growth
The model shows that each phase of growth is followed by a crisis.
Phase 1: Creativity -> Leadership crisis
Phase 2: Direction -> Autonomy crisis
Phase 3: Delegation -> Control Crisis
Phase 4: Coordination -> Red Tape crisis
Phase 5: Collaboration -> Growth crisis
Self-Interest (Kotter + Schlesinger's reasons for resistance to change)
- People more concerned with their own situation, can't see the individual benefit
Misunderstanding (Kotter + Schlesinger's reasons for resistance to change)
Not fully understanding what change means for them
Low tolerance for change (Kotter + Schlesinger's reasons for resistance to change)
Used to doing things the same way so don't like change
Different assessments of the situation (Kotter + Schlesinger's reasons for resistance to change)
Key stakeholders may have strong disagreements over reasons change is needed so may find it hard to accept.
May not be able to see advantages of change.
Mayhave better idea for change
Re-Order Level formula
Lead time (days) x Average daily use + Buffer Stock Levels
Price Elasticity of Demand formula
% change in quantity demanded / % change in price
NPV formula
Total Present Value - Investment
Average Rate of Return
Average net return / Investment x100
Payback
Amount Invested / Annual Net Return
PESTLE
Political, Economic, Social, Technological, Legal, Environmental
Total float (Def and Formula)
Spare time available; Only non-critical activities have float time.
Latest Finish Time - Duration - Earliest Start Time
Tannenbaum Schmidt (T,S,S,C,J,D,A)
Tells, Sells, Suggests, Consults, Joins, Delegates, Abdicates
Blake Mouton Grid
- Concern for production and concern for people
- Impoverished, Produce or Perish, Team style, Country-Club
Just-In-Time Production
-Low stock with efficient stock control to decrease storage costs and increase flexibility to change.
Kaizen
Constant Improvements instead of one offs
Gross Profit
Sales Revenue - Cost of Sales
Operating Profit
Sales Revenue - Cost of Sales - Operating expenses
Profit of the Year
Operating Profit + Other Profit - Net Financial Costs - Tax
Gearing (Def. and Formula)
Shows what % of finance comes from long-term liabilities
NCL / Total Equity + NCL (x 100)
Recievables Days
Recievables / SR (x 365)
Payables Days
Payables / Cost of Sales (x 365)
ROCE (Def. and formula)
- Shows how much money is made by a business compared to how much is put in
- The higher the ROCE, the better
Operating Profit / Total Equity + NCL (x 100)
Inventory Turnover (def. and formula)
Compares the cost of all sales to the cost of the average stock held. Tells you how many times during the year a business sells all its stock.
Cost of Sales / Cost of Average Stock Held
Retained Profit
Profit after dividends
Profit after tax - dividends
Break-Even Output
Fixed Costs / Contribution per Unit
Contribution per Unit
Selling price per unit - variable cost per unit
Total Contribution
Total revenue - total variable costs OR Contribution per unit x number of units sold
Barriers to entry (Porter's Five Forces)
How easy it is to enter the market
-Patents and trademarks
- Control of distribution (forward vertical integration)
- Price war
Buyer Power (Porter's Five Forces)
When there are many sellers and few buyers.
- Buy supplier out (backward vertical integration)
- Form a buying group with other businesses
Supplier Power (Porter's Five Forces)
When there are few suppliers and many buyers.
- Tie buyers into long-term contracts
- Forward vertical integration
- Develop new products and protect them with patents
Threat of substitutes (Porter's Five Forces)
How likely consumers are to buy an alternative
- Make it expensive or difficult to switch
- Differentiate to create brand loyalty
- target market whose needs aren't being met
Rivalry (Porter's Five Forces)
High competition
- Make it easy to switch
- Bigger promotional budget
Market penetration
Bringing an existing product to an existing market.
Market development
Bringing an existing product to a new market.
Diversification
Bringing a new product to a new market
most risky
Product development
Bringing a new product to an existing market
Segmentation
Dividing market into groups with similar characteristics or needs
Targeting
Deciding which market to focus on and adapt product and marketing mix to suit them
Positioning
Positioning the product in the target consumers' minds so they see it as better than the competition.
Product
Boston Matrix, USP, Product Life Cycle
Pricing
Price skimming, penetration pricing, influences on pricing
Promotion
Advertising, branding, promotional mix
Place
Distribution channels
Promotional mix
Reflects product, budget and competitor activity
Convenience products
Inexpensive, everyday items bought by lots of people
Shopping products
Things like clothes and appliances bought less regularly than convenience products.
More expensive and sold in fewer places.
Speciality products
Things consumers believe to be unique in some way.
Perceived image and quality are more important than price