SCIE Data- Graphs and Plots
1/12
There's no tags or description
Looks like no tags are added yet.
Name | Mastery | Learn | Test | Matching | Spaced | Call with Kai |
|---|
No analytics yet
Send a link to your students to track their progress
13 Terms
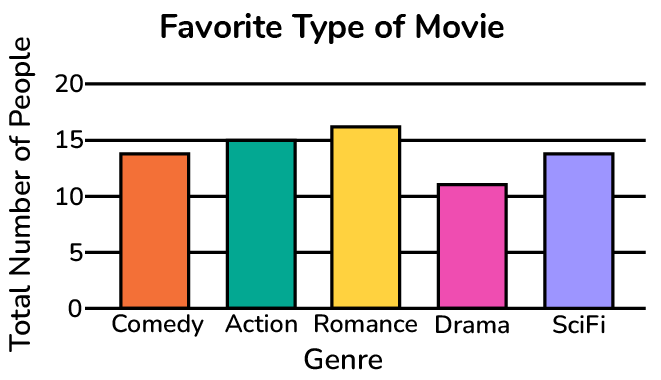
Bar Graphs
Show comparisons between categories of data
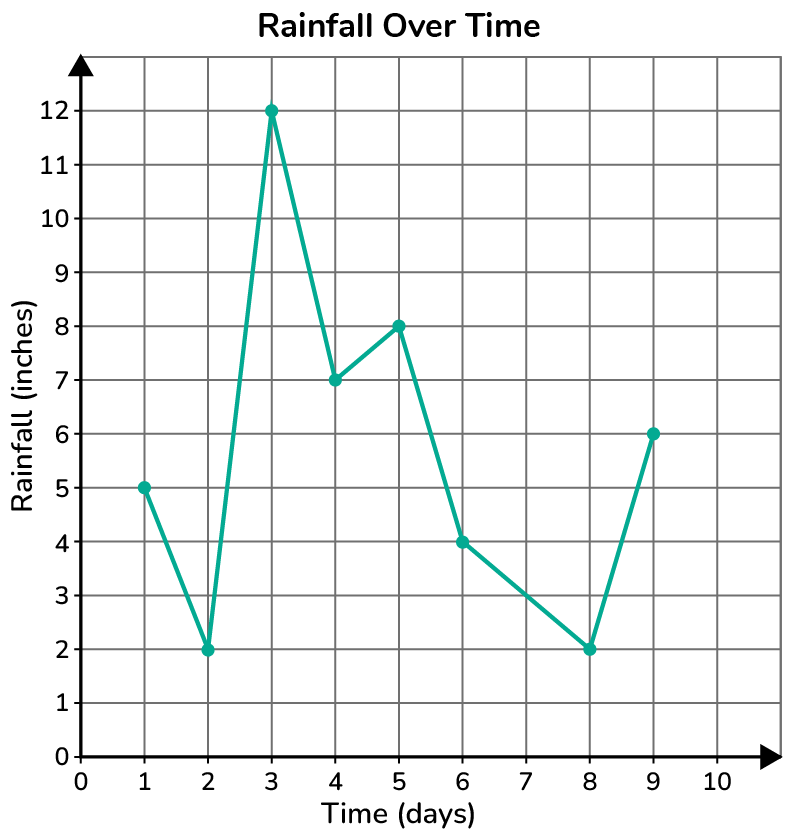
Line Graph
uses line segments to connect data points. ** MOSTLY USED: HOW DATA CHANGE OVER TIME
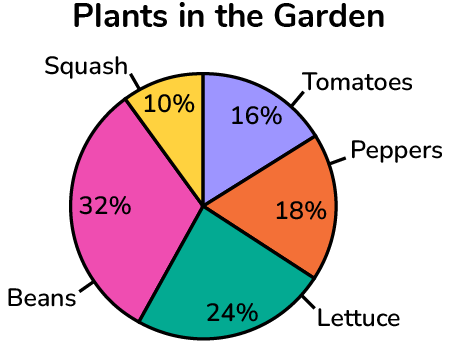
Pie Chart
circle is divided into sections
helpful when displaying the relative distribution of data in each category.
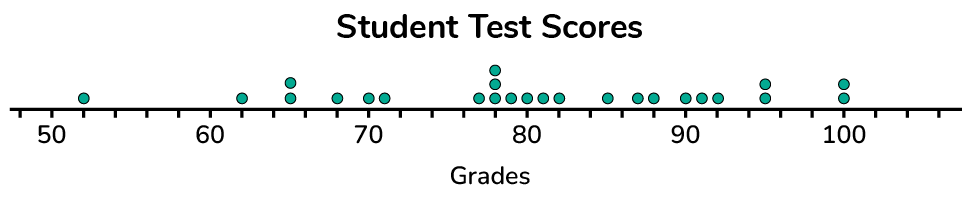
Dot Plots
uses dots to show the number of data points in a group of data
used for quantitative data
helpful for identifying the mode, the shape or skew of the graph, and potential outliers on a dot plot
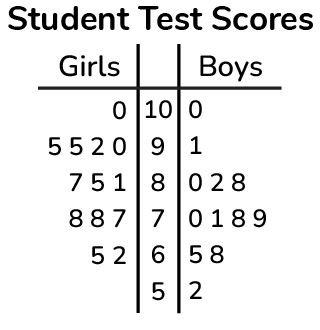
Stem plot
each data value is split into a "leaf" (usually the last digit) and a "stem" (the other digits)
best show clusters and gaps in the data
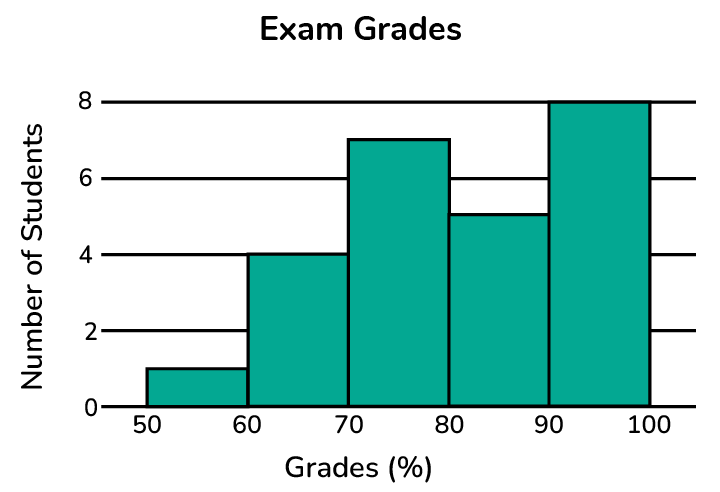
Histogram
groups data into equal ranges and then plots the frequency of data in the ranges as bars
used to summarize information from large sets of data
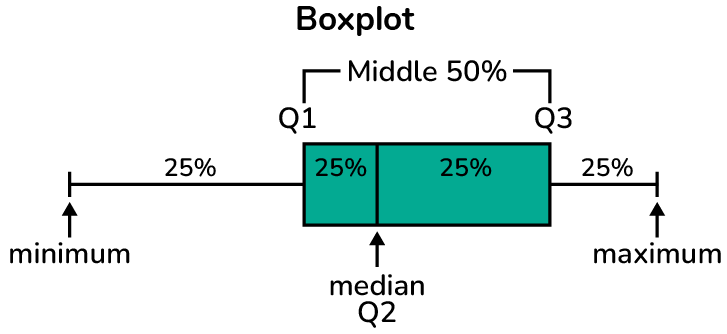
Box Plot
uses a box and whiskers to display data
based on five numbers: the minimum, the maximum, the first quartile, the third quartile, and the median of the data
Choosing a Graph or Plot
Graph Name | Data Type | Best Used For: |
Bar Graph | Categorical | Comparisons |
Pie Chart | Categorical | Percentages |
Line Graph | Quantitative | Changes over time |
Dot Plot | Quantitative | Small amounts of data |
Stem-and-Leaf Plot | Quantitative | Small amounts of data |
Box Plot | Quantitative | Large amounts of data |
Histogram | Quantitative | Large amounts of data |
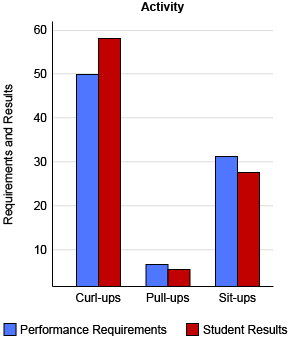
EX1 A Physical Education teacher made a data table of the performance requirements to pass the Presidential Fitness Test along with a student's performance on the test. Which type of chart is best for the data set below?
Activity | Performance Requirements | Student Results |
Curl Ups | 50 | 58 |
Pull-ups | 6 | 4 |
Sit-ups | 31 | 28 |
Categorical data, therefore a double bar graph is best for this data set, as shown below. Using the double bar graph
Example 2: The following data shows the temperature forecast for each hour of a particular day in August. Which type of chart is best for this data set?
Time | Temperature °F |
9:00 a.m. | 70 |
10:00 | 75 |
11:00 | 80 |
12:00 | 86 |
1:00 p.m. | 88 |
2:00 | 90 |
3:00 | 90 |
4:00 | 90 |
5:00 | 90 |
6:00 | 89 |
Quantitative because it shows numerical values. The data shows how the temperature changes with time. Therefore, a line graph is best for this data set, as shown below.

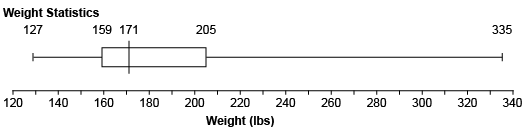
Example 3: During an obesity research project, a health worker categorized the weights of all incoming male freshmen at a certain university. The statistics associated with the data are presented in the table below. Which type of chart is best for this data set?
Weight Statistics on Male Freshmen (lbs) | |
First Quartile | 159 |
Second Quartile | 171 |
Third Quartile | 205 |
Minimum | 127 |
Maximum | 335 |
Quantitative because weights is in numbers.
This data includes statistical values, such as the quartiles, associated with large amounts of data, therefore a box plot is the best for this data, as shown below.
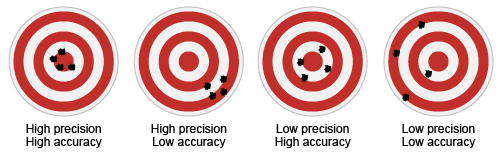
Precision
how close different measurements are to one another

Accuracy
how close measurements are to a true value