geography — PHYSICAL FIELDWORK
1/14
There's no tags or description
Looks like no tags are added yet.
Name | Mastery | Learn | Test | Matching | Spaced |
|---|
No study sessions yet.
15 Terms
what was the enquiry or title of the river physical fieldwork?
does Cotton Dell match the Bradshaw model?
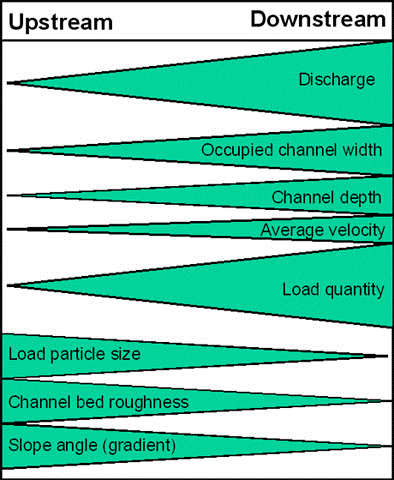
what does the bradshaw model show?
the changes in a river from source to mouth
what 5 factors were measured?
river depth
velocity
width
rock shape/ size
wetted perimeter
For a physical geography fieldwork investigation which you have completed
explain one way you could have improved the data presentation [2]
for the velocity and depth of a river, I had made separate graphs for each site
to improve this, I could have put both sites on one graph for better comparison
To what extent did your physical geography fieldwork conclusions support ideas studied in class? [8]
we studied the speed of the river at 3 different areas upstream
we recorded the speed of the river 5 times at each area and took a mean to make our results more reliable
overall, our results supported the Bradshaw model as the speed increased further downstream
however, it was only the mean result that followed this pattern. The individual data which we collected, does not always show that the river speed increased
Justify one technique which you used when presenting your data in your physical geography fieldwork investigation. [2]
I used a scatter graph to present the relationship between river depth and velocity because it clearly showed the correlation between the two
This made it easier to identify patterns, such as how velocity increased with depth.
how was the data for rock shape/ size collected?
visit each end of the river
use a sampling technique, select 10 pebbles from each end
measure the longest axis of the pebbles
calculate the mean
how was the data for velocity collected?
have a set distance (10 metres)
use a ping-pong ball and place it in the river and time how long it takes for it to cover the 10 metres
find velocity by dividing distance by time
For a physical geography fieldwork investigation which you have completed
evaluate one technique you used to collect data. [2]
measuring the velocity was inaccurate as the ball would get stuck in rocks sometimes
however, it was a quick and easy process to carry out
one way one can improve the accuracy and reliability of data collection
repeat the process 3 times and calculate a mean
choose different areas up the course of the river and repeat investigation in each area
For a physical geography fieldwork investigation which you have completed,
explain why your key question for investigation was appropriate [2]
we went to Cotton Dell, it was appropriate because..
it was near to school
and we could study the Bradshaw model
Suggest how the students could improve the velocity investigation in order to improve the reliability of their results [8]
one problem we had was that the ping-pong ball got stuck in-between rocks which affected the time
we could have improved the investigation by using scientific equipment, such as the flow meter.
this would have been used at different areas up the course of the river and made the results more precise and more accurate so that the results are more reliable
how was the data for wetted perimeter collected?
a chain or tape is laid along the riverbed from one bank to the other
the length is recorded in meters
this is repeated at different points along the river's cross-section for accuracy
You will have carried out some physical geography fieldwork as part of your GCSE Geography course.
To what extent was your primary data collection successful? [8]
to a large extent our data collection methods were successful,
we measured the velocity of the river at different locations along the rivers course; we did this five times and took a mean at each location which increased the accuracy of the results
this was important to produce more secure analysis and conclusions
however, a limitation is that at times the ping-pong ball we used to measure the velocity got stuck in between the rock in the river bed, this meant that someone had to move the ball and would have affected the final mean
how was the data for river depth collected?
a cross-section is set up using a tape measure that is laid across the width of the river
measure the depth using a ruler in increments of 10cm for systematic sampling
depth is read at the waterline
this is repeated at different points along the river's cross-section for accuracy