ACYMANS10: Financial Statement Analysis
1/19
There's no tags or description
Looks like no tags are added yet.
Name | Mastery | Learn | Test | Matching | Spaced |
|---|
No study sessions yet.
20 Terms
Which one of the following is not a tool in financial statement analysis?
a. Horizontal analysis
b. Vertical analysis
c. Ratio analysis
d. Circular analysis
D
Which one of the following is not a characteristic generally evaluated in analyzing financial statements?
a. Liquidity
b. Profitability
c. Solvency
d. Marketability
D
Common size financial statements help an analyst to:
a. Evaluate financial statements of companies within a given industry of the approximate same size
b. Determine which companies in a similar industry are at approximately the same stage of development
c. Compare the mix of assets, liabilities, capital, revenue, and expenses within a company over a period of time or between companies within a given industry without respect to size
d. Ascertain the relative potential of companies of similar size in different industries
C
Ratios are used as tools in financial analysis
a. Instead of horizontal and vertical analyses
b. Because they may provide information that is not apparent from inspection of the individual components of the ratio
c. Because even single ratios by themselves are quite meaningful
d. Because they are prescribed by GAAP
B
When a balance sheet amount is related to an income statement amount in computing a ratio,
a. The income statement amount should be converted to an average for the year
b. Comparisons with industry ratios are not meaningful
c. The balance sheet amount should be converted to an average for the year
d. The ratio loses its historical perspective because a beginning-of-the-year amount is combined with an end-of-the-year amount
C

The working capital at the end of Year 2 is:
a. P 840,000 c. P 290,000
b. P 560,000 d. P 900,000
C

The current ratio at the end of Year 2 is closest to:
a. 0.36 c. 0.89
b. 0.40 d. 2.07
D
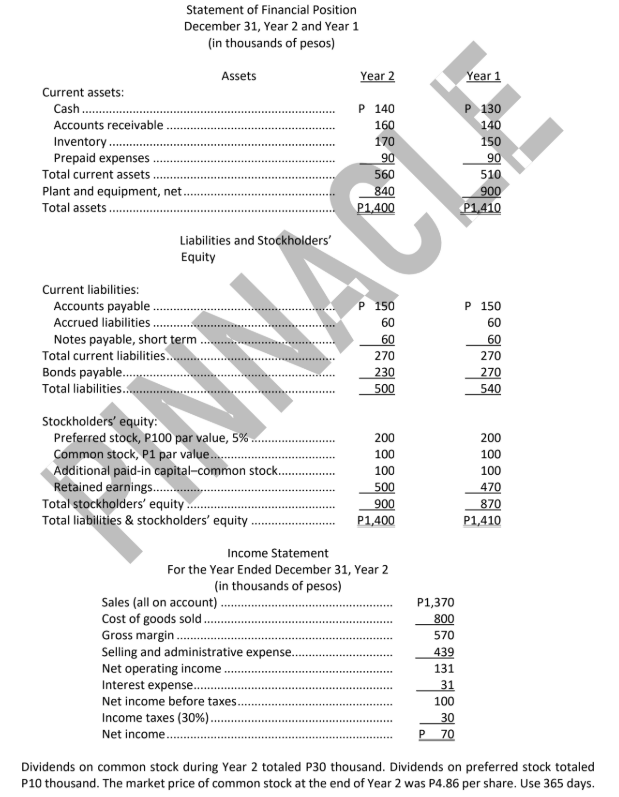
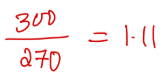
The acid-test ratio at the end of Year 2 is closest to:
a. 1.11 c. 2.07
b. 1.12 d. 1.44
A

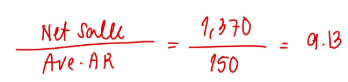
The accounts receivable turnover for Year 2 is closest to:
a. 1.14 c. 0.88
b. 8.56 d. 9.13
D

The average collection period for Year 2 is closest to:
a. 1.1 days c. 0.9 days
b. 42.6 days d. 40.0 days
D


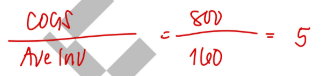
The average inventory turnover for Year 2 is closest to:
a. 4.71 c. 5.00
b. 0.88 d. 1.13
C

The days in inventory for Year 2 is closest to:
a. 45.3 days c. 213.1 days
b. 77.5 days d. 73.0 days
D


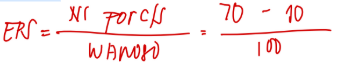
The times interest earned for Year 2 is closest to:
a. 4.23 c. 2.26
b. 6.04 d. 3.23
A


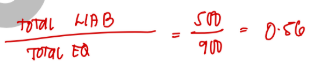
The debt-to-equity ratio at the end of Year 2 is closest to:
a. 0.71 c. 0.56
b. 0.26 d. 0.32
C

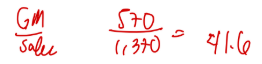
The gross margin percentage for Year 2 is closest to:
a. 814.3% c. 41.6%
b. 71.3% d. 12.3%
C

The earnings per share of common stock for Year 2 is closest to:
a. P0.60 c. P1.00
b. P0.70 d.1.31
A

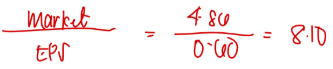
The price-earnings ratio for Year 2 is closest to:
a. 8.10 c. 6.94
b. 3.71 d. 4.86
A

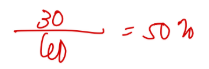
The dividend payout ratio for Year 2 is closest to:
a. 66.7% c. 833.3%
b. 50.0% d. 42.9%
B

The return on total assets for Year 2 is closest to:
a. 5.00% c. 6.53%
b. 6.55% d. 4.98%
D

The return on common stockholders' equity for Year 2 is closest to:
a. 6.78% c. 8.76%
b. 7.91% d. 10.22%
C