Clinical Movement Analysis
1/79
There's no tags or description
Looks like no tags are added yet.
Name | Mastery | Learn | Test | Matching | Spaced | Call with Kai |
|---|
No analytics yet
Send a link to your students to track their progress
80 Terms
Why study movement analysis?
general style of locomotion is determined by simply watching someone move. However the eye is unreliable and inadequate and too subjective.
quantitative analysis is essential to pinpoint causes of problems (such as limping).
Inertia Equation
I = m x k²
What is k?
Radius of gyration. k = C3 x l (segment length)
Moment of Inertia
Reluctance to change angular state of motion.
M = I x a (angular motion)
What is the inertia in static situations?
0
Inverse Dynamics Assumptions
Joints are simple, single axis pin joints. (human joints are more complex).
Joints are frictionless (but tension from ligaments (high at joint limits), diseased/or arthritic joints, cause increased friction.
Segment length is constant during movement. (flexing of segment changes moment arm and segments such as trunk and foot are very flexible. Flexibility reduces forces causing inaccuracies in calculated moment).
Segments have constant mass located at fix mass centre.
Segments have constant moment of inertia during movement.
Approach provides generic muscle activity, i.e joint flexors. (individual muscle activity cannot be determined).
What to check for inverse dynamics:
m x g at CoM is the mass of the SEGMENT.
We take moments ABOUT THE COM.
If it is on the ground → GRF must be drawn.
If the segment is on tip toes → GRF is ½ of BW.
If the segment is standing on one leg → GRF = BW.
If non-stationary, draw accelerations in x and y and the angular acceleration at the CoM.
Any force vector needs to be represented in Newtons.
For arm segments: check if the drawing has a closed fist because this means the length of the hand segment is halved (note: segment mass does NOT change).
Knee Joint Moment Muscle Group
+ve moment = knee extensors
-ve moment = knee flexors
Ankle Moment Muscle Group
+ve moment = dorsiflexors
-ve moment = plantarflexors
Ground Reaction Force
The force exerted by the ground on the body, equal and opposite to the force the body exerts on the ground.
Force Platform Design Criteria
placed flush with floor
should not give as load is applied - not deform under pressure.
must be at least the size of human foot
Strain gauge technology - Transducer
Made of conductive wire that is folded several times to increase sensitivity. When load is applied, the strain gauge deforms. This causes the wire’s resistance to change which is used to quantify force.
What is the role of an amplifier in measuring force using force platforms?
Amplifies the signals and filters out background noise. Amplification depends on the strength of the signal, 200 Hz → large amplification. 2000 Hz → small amplification.
What is an ADC and how can resolution be calculated?
Converts analouge to digital signals. For a 12 bit ADC, resolution is calculated by dividing the maximum force by 212 = 4096 parts. i.e amplifier range for a 5000 N force, the resolution will be 5000/4096 = 1.22 N. So the smallest change in force that can be measured is 1.22 N.
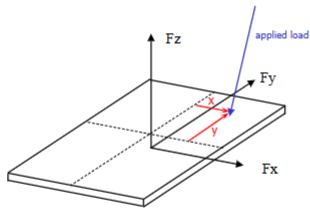
What is the output of force platforms?
Reaction forces in each orthogonal direction.
Reaction moments about each orthogonal direction.
What is the CoP?
point of application of the GRF. It is not measured directly from the force platform rather calculated from the force and moments measured by the force platform.
How are CoP coordinates determined?
To determine the:
Y-coordinate: look from the x axis direction. Take moments of the Fz and Fy forces about the CoP. Distance between the CoP and Fz is y (what we are going for) and distance between Fy and CoP is z. Note: Fy is drawn towards CoP.
X-coordinate: look from the y axis direction. Take moments of the Fz and Fx forces about the CoP. Distance between the CoP and Fz is x (what we are going for) and distance between Fx and CoP is z. Note: Fx is drawn towards CoP.
Why do we determine the CoP?
Provides an assessment for postural control through computing fluctuations in the CoP.
CoP is required for inverse dynamics calculations.
Needed to produce force vector diagrams. (Since force vectors are located at the CoP, the CoP is needed to produce these diagrams which help us highlight problems qualitatively).
CoP trajectory indicates pattern of progression (i.e gait).
On a force-time graph, when the force is:
equal to BW = no acceleration.
greater than BW = upwards acceleration.
less than BW = downwards acceleration.
Loading rate steepness is affected by:
toe or heel striker
type of floor (i.e concrete or wooden)
type of shoes
Properties of a GRF graph
forces above or below BW line reflect acceleration either upwards or downwards.
area under the curve is impulse and is the impulse needed to support BW.
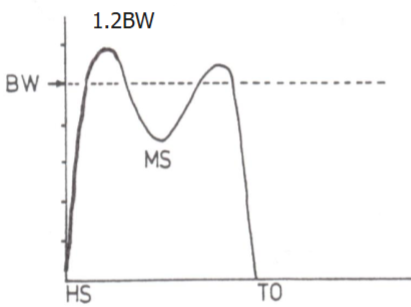
Vertical Walking Force-Time Graph
Largest force (as it is the force needed to support BW).
Maximum force is about 1.2BW.
loading and unloading need to have similar slope, otherwise is could be a deficit due to injury
Double peak curve.
1st curve: arrests downward motion of the CoM.
2nd peak: propulsive action of limb
trough: CoM has upward trajectory but acceleration is downwards.
Changes in Vertical GRF due to:
Running and Speed: magnitude is doubled as larger force is applied and CoM needs higher force to arrest. Contact time is reduced. Increased speed: impact peak magnitude increases the most, and trough further decreases.
Pathology: smaller force as other limb compensates. Reduced contact time. Increased force on good limb.
Crutch walking: force is below BW as upper body takes some of the load.
Anteroposterior Walking Force-Time
Has 2 phases: braking and propulsion
Maximum force is 15% of BW.
Changes in Anteroposterior GRF due to:
Speed: magnitude of braking and propulsion peaks increase.
If braking and propulsive impulse are equal = constant speed.
If braking impulse > propulsive impulse = slowing down.
If braking impulse < propulsive impulse = speeding up
Mediolateral Walking Force-Time Graph
Maximum force is 5% of BW. Much smaller than A/P and Vertical.
Direction is medial for most stance (when we walk, our foot is pushing laterally to move forward and since the GRF is equal and opposite, it mean it will be medial).
Medial direction towards the CoM controls the foot from moving left and right.
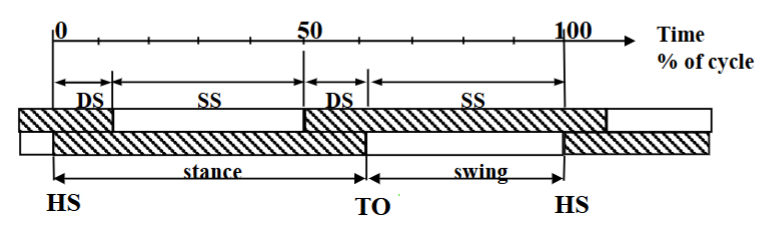
What is the gait cycle made of?
Stance phase: weight acceptance, mid-stance, propulsive.
Swing phase: acceleration, mid-swing, deceleration.
Asymmetry in phases means underlying problem.
Movement of CoM during foot flat of Stance
CoM rolls over the foot with ankle acting as pivot
Mid-stance Joints
Knee is slightly flexed to ensure CoM rise is minimal
Hip joint above the ankle
Once the CoM is infront of the foot, the limb acts to propel the CoM forward
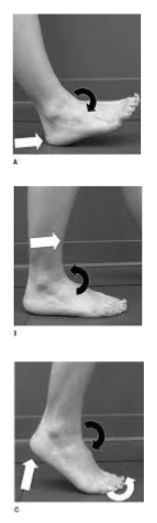
The 3 rockers of gait
heel rocker: heel strike to foot flat. It involves ankle plantarflexion.
ankle rocker: rotation of tibial over foot. It involves ankle dorsiflexion
forefoot rocker: heel rise + forefoot dorsiflexion. It involves ankle plantarflexion.
Limb Movement: Swing Phase
Initial swing: hip, knee, and ankle are flexed as limb is accelerated. This ensures foot clears obstacles.
Terminal swing: hip, knee and ankle are extended as limb is decelerated prior to foot contact.
Gait Cycle Supports
With increased speed, DS phase decreases.
Absence of DS means running = flight phase
Things that cause variation in gait:
intraday and interday
Compounded through experimental procedure:
walk normally but make sure you step on the platform.
controlling speed
noisy environment
enough space to allow for development of normal velocity
dominant limbs can cause variability across limbs
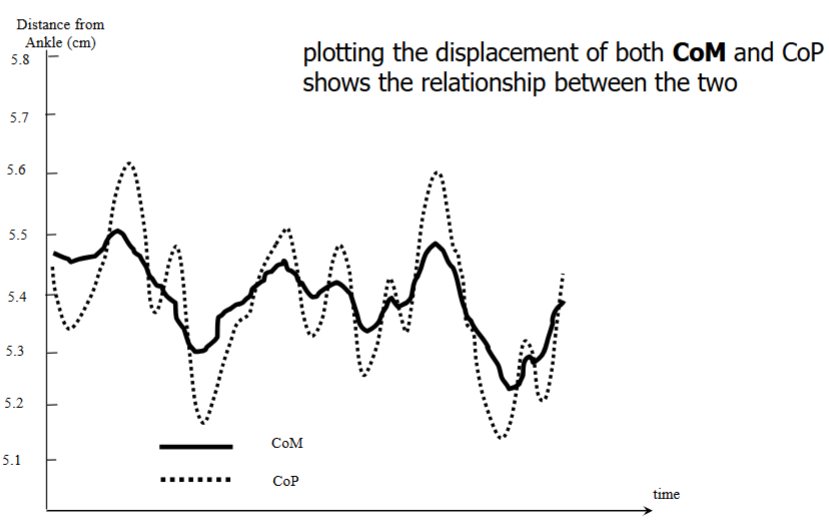
How can CoP data be used to understand postural control
Position of CoM determines stability → CoM is continually changing (shifts must be controlled to maintain balance)→ the only force that acts on the body is the GRF → GRF is responsible for moving the CoM → to assess balance, measure instantaneous location of GRF i.e CoP. We are able to know that the CoP moves infront of the CoM (with greater magnitude) to arrest further motion of CoM so as to not go outside Base of Support thus balance and postural control.
y-axis: how far the CoM and CoP have moved relative to pivot point or the ankle. Neutral is 5.5cm in front of the ankle (where the CoP resides when standing).
CoP continuously moves forwards and backwards to keep the CoM within its confines.
To quantify this, look at the range of movement of the CoM and CoP.
How can the CoM and CoP data be collected?
CoM: camera system with data processing of 2+ hours (which is why research papers have used CoP signals to quantify postural stability and control as data comes out straight away)
CoP: instantaneously from the force platform.
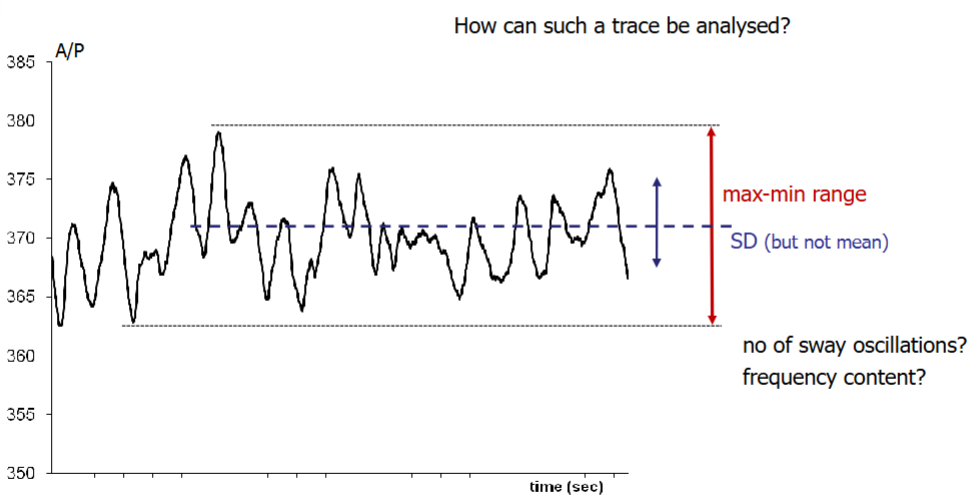
How can CoP data be used to assess postural stability when standing?
Standing still on a force platform, looking above. We can produce a CoP graph on the A/P and M/L axes. Splitting it and displaying them against time. We can analyse:
Standard deviation
Frequency - sway frequency is about 1 Hz i.e we sway backwards and forwards once every second
Max-min range
Number of sway oscillaitons - using Fourier transforms used to come up with fundamental frequency for a signal.
Settling period - more often in M/L direction where a person could relax = stop swaying so often, as time progresses.
How can Fourier Transforms be used to assess postural control?
CoP data picks up all movements (including not from stability). This creates a graph with many frequencies superimposed on one another. Fourier Transforms can separate data based on frequencies. Since swaying frequency is 1Hz, we can have data for 1Hz frequency only. This can be useful in quantifying rehabilitation for stroke or parkinson’s disease patients.
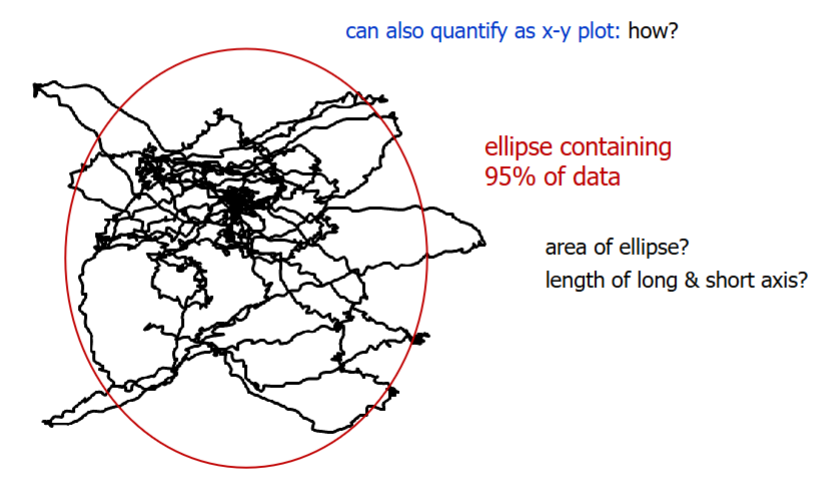
Another method for assessing postural stability when standing
x-y plot using an ellipse: contains 95% of data to give room for unusual occurrences and contains 2 standard deviations.
look at length of long and short axis: longer y-axis means moving more
angle of ellipse
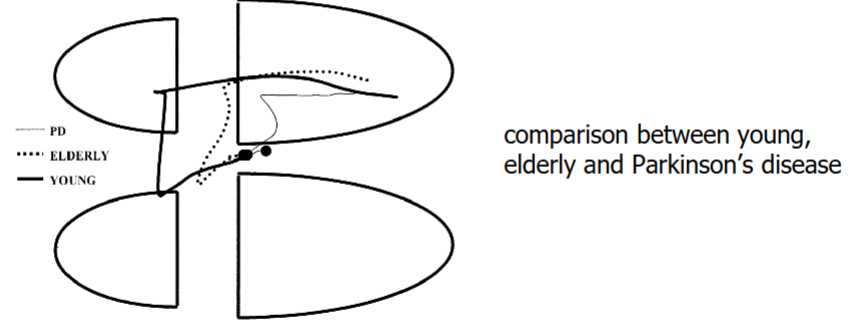
Assessment of seated postural stability through ellipse
normal is clustered around the mean, oriented symmetrically, and doesn’t move much.
stroke: ellipse is elongated and will be off at an angle as stroke patients have slight paralysis on one side.
How can CoP data be used to assess postural control during gait initiation?
to initiate gait, we have to lift one leg off to be able to step forward.
Before taking one leg off, the person has to transfer the weight onto the other limb, otherwise you would fall over.
Pushing down on one limb means the CoP shifts to that limb to be able to take a step forward.
How can we prevent falls?
update spectacles
remove hard skin from feet
make environment safer. i.e lower steps
cushioned properties or wearables for fragile bones
Assumptions made when calculating force of fall
body falls freely
CoM falls for 0.7m (if CoM is 0.8m and hip is a bit lower than CoM)
it takes x seconds to stop fall (0.065 s for example)
How is the force at impact from falling calculated?
determine time of fall (s = ut + ½ at²) we assume u = 0
find average velocity (s/t)
find impact velocity (avgvel = (v + u)/2) then momentum (m x v)
find force of impact from impulse = change in momentum (Ft = mv-mu) use time it takes to stop the fall as the t.
Can better express newtons as BW (divide force by weight).
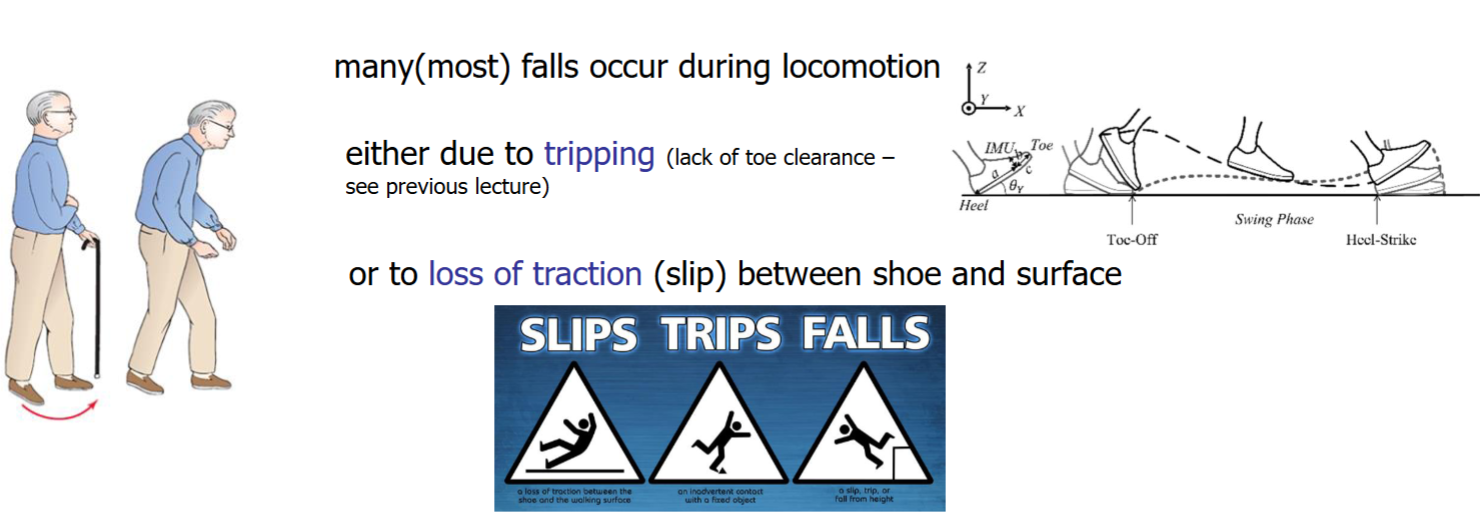
What controls foot clearance during the swing phase?
coordinated control of the joints of both the swinging and stance limbs. These limbs and joints have potential to change how much the swinging foot is above the ground.
What is Minimum Toe Clearance?
critical event in gait cycle that is responsible for clearing obstacles
MTC is normally 15-20 mm
MTC happens during mid-swing when the foot’s speed is approximately 3 times higher than walking speed. This is where the CoM is ahead of the body and if the foot catches onto something, the CoM will go outside the body and cause a fall.
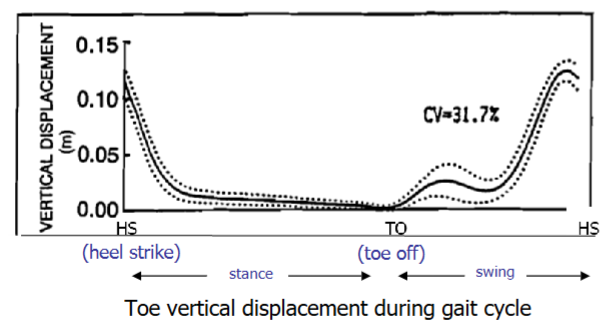
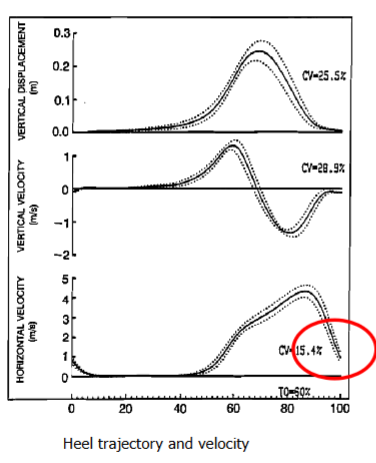
How can we ensure chance of slipping is low?
control heel trajectory and velocity at contact.
Velocity decreases to 0 in the vertical direction, 0.4 ms-1 in the horizontal direction.
Muscles active: hamstrings to slow down foot upon Heel Strike (hamstring muscle activation rate is lower in elderly).
For a stroke patient, how would you treat drop foot following paralysis?
ankle-foot orthotic to lift foot
physiotherapy
What methods are used to determine whole body CoM location?
Reaction Board Method
Segmental Method
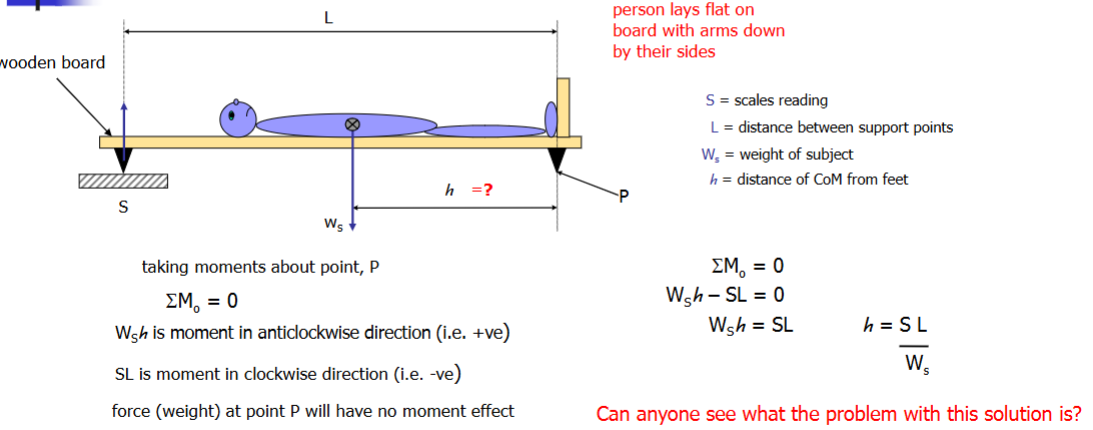
Basic Reaction Board Method
finds the height of the CoM
takes moments about point P.
Problem: wight of the board is included.
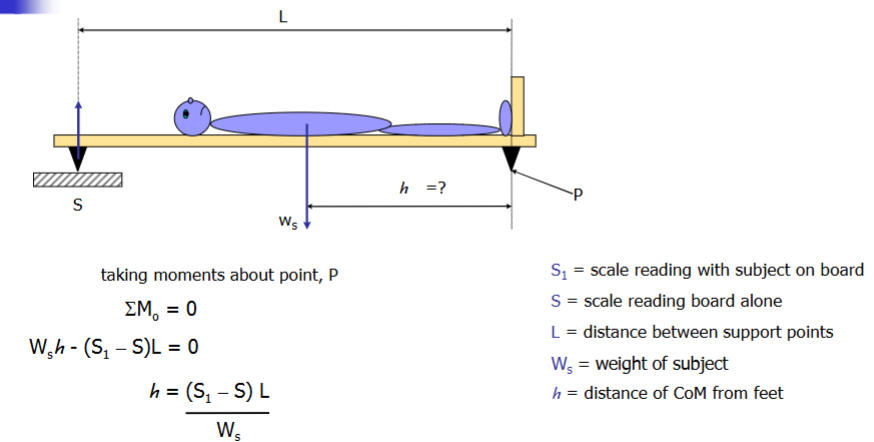
Enhanced Basic Reaction Board Method and Limitations
Note: all forces (weight) measurements are in kg but since the formula to find h divides kg/kg, forces can be kept in kg.
Answer should be +- 10 cm of around 1.0 m.
Limitation: does not tell the direction of the CoM in the M/L or the horisontal direction. Amputees will have a different CoM as there has been a shift in the weight distribution. Usually have lower limb amputations so the CoM rises and moves toward the other limb as more mass is concentrated there.
Collecting CoM and heights data and creating an equation
General formula will not work for both genders as males are taller than females which means CoM location will be inaccurate.
Solution: make a formula for each gender or take hundreds of samples and create a general equation.
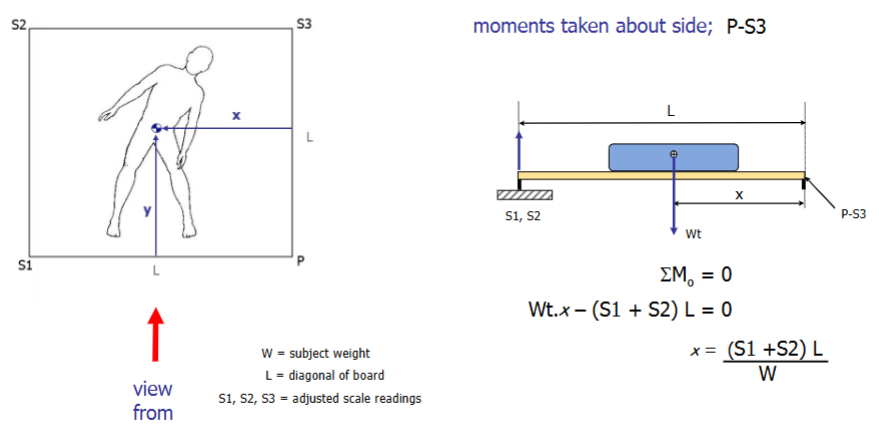
4 Point Reaction Board Method
take moments about side P-S1 (for y) and P-S3 (for x) to determine coordinates.
method for y coordinate is similar but view from left side (S1-S2).
Limitations:
Only indicates frontal plane 2D location
Can only be used for body positions that can be held statically.
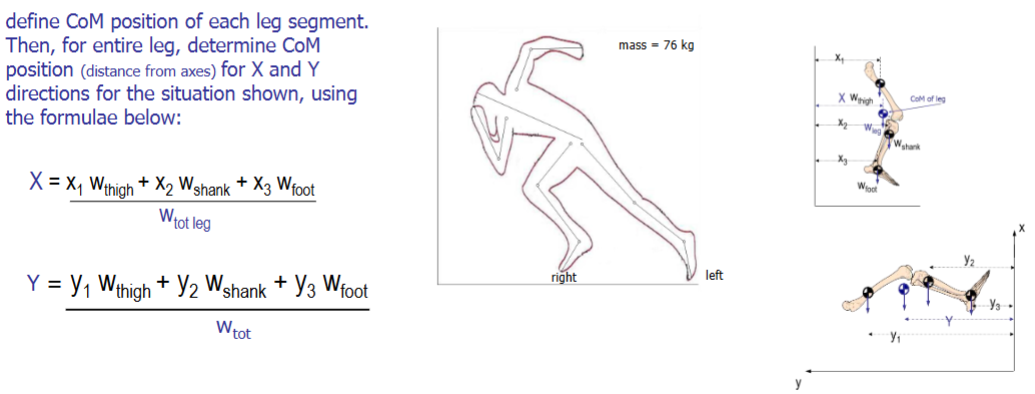
Segmental Method
Used to determine whole body CoM location for any dynamic situation.
Find segment length using a ruler. Use this as a measure to find the location of the CoM for this segment.
Draw the CoM and find the weight of the segment. Draw the weight force onto the CoM.
Draw a line to the y-axis from the CoM of this segment and find the length of the line.
Take the moment of this force vector about the y-axis.
Do this for all segments and add them up = Xtotal x Wtotal for the leg, for example. The total weight is the sum of the segment weights.
This can be used to find all body segments for entire body CoM.
CoM and Location
point about which mass is evenly distributed. It is located approximately anterior to the 2nd sacral vertebra. the line of gravity that extends through the CoM:
through earlobe
through shoulder joint
slightly behind hip joint
slightly anterior to the knee joint
slightly anterior to the ankle joint
Why is the gravity line located anterior to the knee centre?
easier and more energy efficient to stand with the body aligned, otherwise you would have to use muscles (due to the moment effect away from that line) to keep your body upright. Therefore, having the knee fully extended (by the line of gravity) is less energy demanding. The centre of gravity line keeps the knee extended and tension in ligaments keeps the knee locked so standing does not need muscle effort.
CoM position
it’s a virtual point so it can vary within any given person or when arrangement of limbs shift.
It does not have to be within the confines of the body.
It has a constant proportion of 55.7% of height but it is moving as body segment proportions are different from birth to maturity.
This change of CoM due to changing segment proportions forces the person to learn how to place CoM during walking for balance control.
When does CoM position shift?
when weight is added or subtracted (such as carrying a suitcase makes upper body segment increase in mass so the CoM will be elevated).
amputees: there is less mass so the CoM is elevated as manufactured limb is lighter (passive inert devices that have to be logged around).
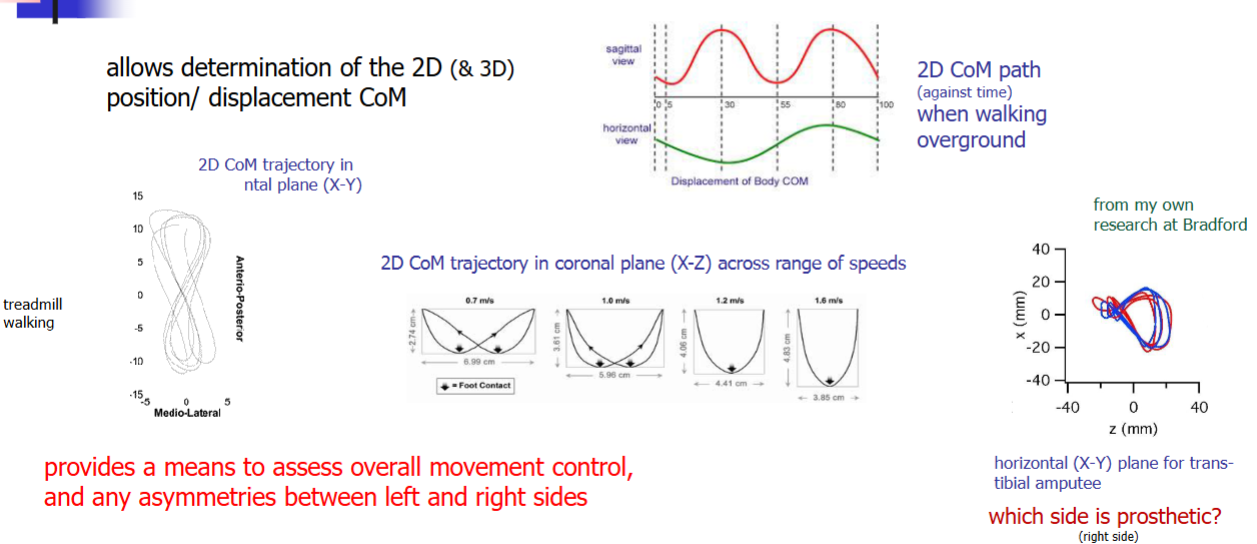
What information can be gained by monitoring whole body CoM movement (point mass model)?
Used to assess standing balance: knowing the CoM position relative to CoP position allows us to understand how postural control during standing works.
Used to assess overall movement control and asymmetries between left and right side: by determining 2D and 2D displacement of CoM.
Used to discuss energetics of the CoM: the CoM trajectory is sinusoidal. The highest CoM means highest PE and the lowest CoM position means the highest KE. Looking at segment energy exchange is the internal mechanical work of moving and CoM energy exchange is the external work being done to move the CoM which is done through the internal mechanical work (limbs).
CoM point model limitations
once the body leaves the ground (during high jump for instance), the CoM trajectory can NOT change. However, body positions can change to go higher than the CoM.
Angular momentum (what forces are required to rotate the body 180o can not be determined).
Solution: extend model to single rigid linked model → same trajectory but allows us to determine how much rotation is imparted to that segment which allows it to rotate.
Kinetics vs Kinematics
kinetics: the study of forces causing or resulting from motion
kinematics: the study of motion
Sagittal Plane
Y-Z plane
Movements: Flexion-Extension
Frontal
X-Z plane
Movements: Abd-Adduction
Horizontal
X-Y plane
Movements: Int/External Rotation
Motion Analysis Approaches - Direct Method: Goniometer
hand-held type used clinically to measure joint range of motion.
Limitations:
poor inter-rater reliability (depends on the user) because landmark location and standardised joint position could differ with every user.
Motion Analysis Approaches - Direct Method: Electro-Goniometer
Advantages: allows dynamic assessment of joint range of motion.
Disadvantages:
Sometimes difficult to fit
limited applications
encumbrance - burden on patient
key events during gait are not defined
Motion Analysis Approaches - Direct Method: Accelerometer
Advantages:
determines type of activity (i.e walk, run, sleep)
estimates energy expenditure during daily living
research systems: free living data collection which eliminates pressure of carrying out best gait → thus more accurate representation of gait.
field-based study: lab-based studies are not as sensitive at detecting gait differences.
Other Direct Methods
Accelerometer + gyroscope: measures things relative to gravity so it works out linear and angular change. Advantages: data doesn’t take long to process and widely available on mobile phones so allows remote diagnosis.
Xsens suit: has accelerometers and it’s own software to recreate motion.
Motion Analysis Approaches - Derived Method
since we measure force, we can calculate the impulse and thus workout the change in velocity
Motion Analysis Approaches - Indirect Method
freeze-frame image of performer and locate joint centres → join centres to form stick figure and use to take measurements of joint angle and determine how it changes with time.
Advantages: used in sports clinics to evaluate amount of foot pronation
Video-analysis frame by frame
Advantages: analysis of changes in parameters over time.
Alternative: use high contrast markers and use auto tracking algorithm
Limitations:
Limited to 2D as 3D video analysis is time consuming
Limited to 50 Hz
To avoid blur, camera lens only open for fraction of time (every 50th of a second) thus images are collected at discrete points.
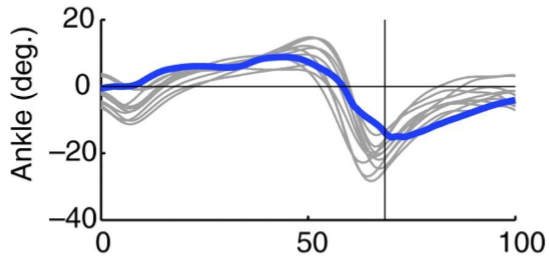
What does the sagittal plane angular displacement at the ankle look like?
at heel contact, the ankle is in it’s neutral position (with neutral angle).
to go from HC → FF, the ankle plantarflexes.
as the tibia rotates over the foot, the ankle goes from plantarflexion to dorsiflexion.
prior to HO (50%), the ankle reaches its maximum dorsiflexion (15-20o).
at HO, the ankle plantarflexes up to TO to propel the body forwards.
during the swing phase, the ankle is in slow dorsiflexion to ensure toes clear the ground.
Range of motion: 15-20o dorsiflexion and 25o plantarflexion.
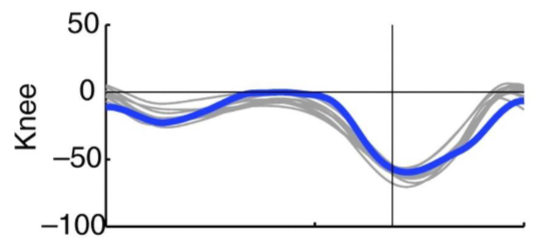
What does the sagittal plane angular displacement at the knee look like?
at HC, the knee has a near neutral angle.
the knee slightly flexes to accept body weight onto the limb and stop the CoM from going too high.
knee extends and goes back to neutral angle
at HO, the knee flexes until TO
during the swing phase, it carries on flexing for a bit after TO as the foot comes up behind you until it extends upon ipsilateral HC.
Range of motion: stance phase - 15-20o during wt acceptance. TO - 50o and maximum flexion happens just after TO - 60o.
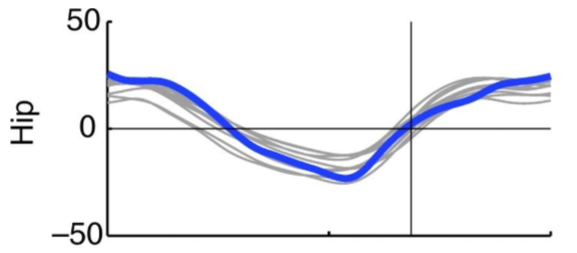
What does the sagittal plane angular displacement at the hip look like?
hip is flexed for about 20-30o.
mid-stance to HO, the hip reduces flexion to neutral position then extends as the CoM goes over the foot.
HO to TO, the hip flexes to neutral angle
At TO and during the swing phase, the hip further flexes up until ipsilateral HC.
Range of motion: 20o flexion at HC and 20o extension at HO so 40-50o for the stance phase. 0-20o for the swing phase.
Why do we construct the linked segment model?
to be able to to track movements of body segments and determine CoM at any instant in time
How is the linked segment model produced?
small spherical markers covered in retroreflective material are placed on key anatomical locations. (segments need to have 3 markers to track them in space).
using the recommended anatomical landmarks allows us to determine where the underlying joint segments would be.
performer moves through capture volume (a force platform surrounded by an array of cameras to capture marker positions).
markers are reconstructed in 3D space using image integration from all cameras.
we then label corresponding joint marker (markers have 4 letter abbreviations).
markers located over joints can be joined to create simple 2D model (but this model depicts outer surface of body only not the BIOMECHANICAL MODEL)
How is the Biomechanical (Skeletal) Linked Segment Model Produced?
Biomechanical model: the skeletal model.
joint centres are determined relative to external markers: measure the joint width and the centre can be assumed to be in the middle of the segment.
Once joint centres are defined, modelled joint centres become virtual markers embedded during a static calibration trial.
3D Motion Analysis: Auto-tracking
Passive markers: covered in retro-reflective tape and they reflect infrared light from cameras.
Active markers: emit infrared light when the cameras flash light and it bounces back onto the cameras. (wires can be an incumbrance).
Why is a static calibration trial conducted before motion analysis?
all the joints will be in their neutral position and based on where the markers are placed, we can embed joint centres. This will be used for dynamic trials.
We don’t define joint centres during dynamic trials as:
bones can bend a little
skin can move
clothing over skin can move
What are the limitations of using skin markers to define skeletal motion?
poor repeatability in marker placement (harder for person with more adipose tissue)
skin markers can move by 20mm with respect to underlying bony landmarks (skeleton) so it can over predict skeletal motion.
different approaches (marker sets, models, software, etc.) make comparisons between studies difficult.
skin movement around joints is greater than other sites (flexing - skin stretches).
skin movement is task dependent
impact transients (force of impact on the body during running) can cause marker movements
cluster can move as independent free body
What is the ideal shoe to minimise slipping risk?
beveled shoe as it provides greater contact at heel strike (as heel strike is the point where slipping is greatest). This offers better slip-resistance over dry and wet floor surfaces.
How have shoes been used to correct over pronation of the foot?
shoes have the ability to alter moments at a joint to correct anatomical and/or functional abnormalities.
foot pronation elongates the time at impact which reduces the loads on the limb.
over pronation leads to excessive internal tibial rotation which increases the load on soft tissue at the knee.
shoes with a wedged cup or wedged insoles prevents the foot from over pronating.
foot taping - putting tension in the straps to stop the foot from collapsing.