water - hydrological cycle and drough (copy)
1/107
There's no tags or description
Looks like no tags are added yet.
Name | Mastery | Learn | Test | Matching | Spaced |
|---|
No study sessions yet.
108 Terms
hydrological cycle
Globally it is a closed system but smaller seas can never be a fully closed system
Hydrological cycle consists of 4 things
Stores- water is held
Flows- water is transferred
Fluxes- rate of flow between stores
Processes- physical mechanisms which move the water e.g. evaporation, precipitation
Hydrological cycle diagram
weren’t shown on diagram =
-Surface runoff flux data - infiltration and underground flows
-No infiltration
-Groundwater in not numbered as a store
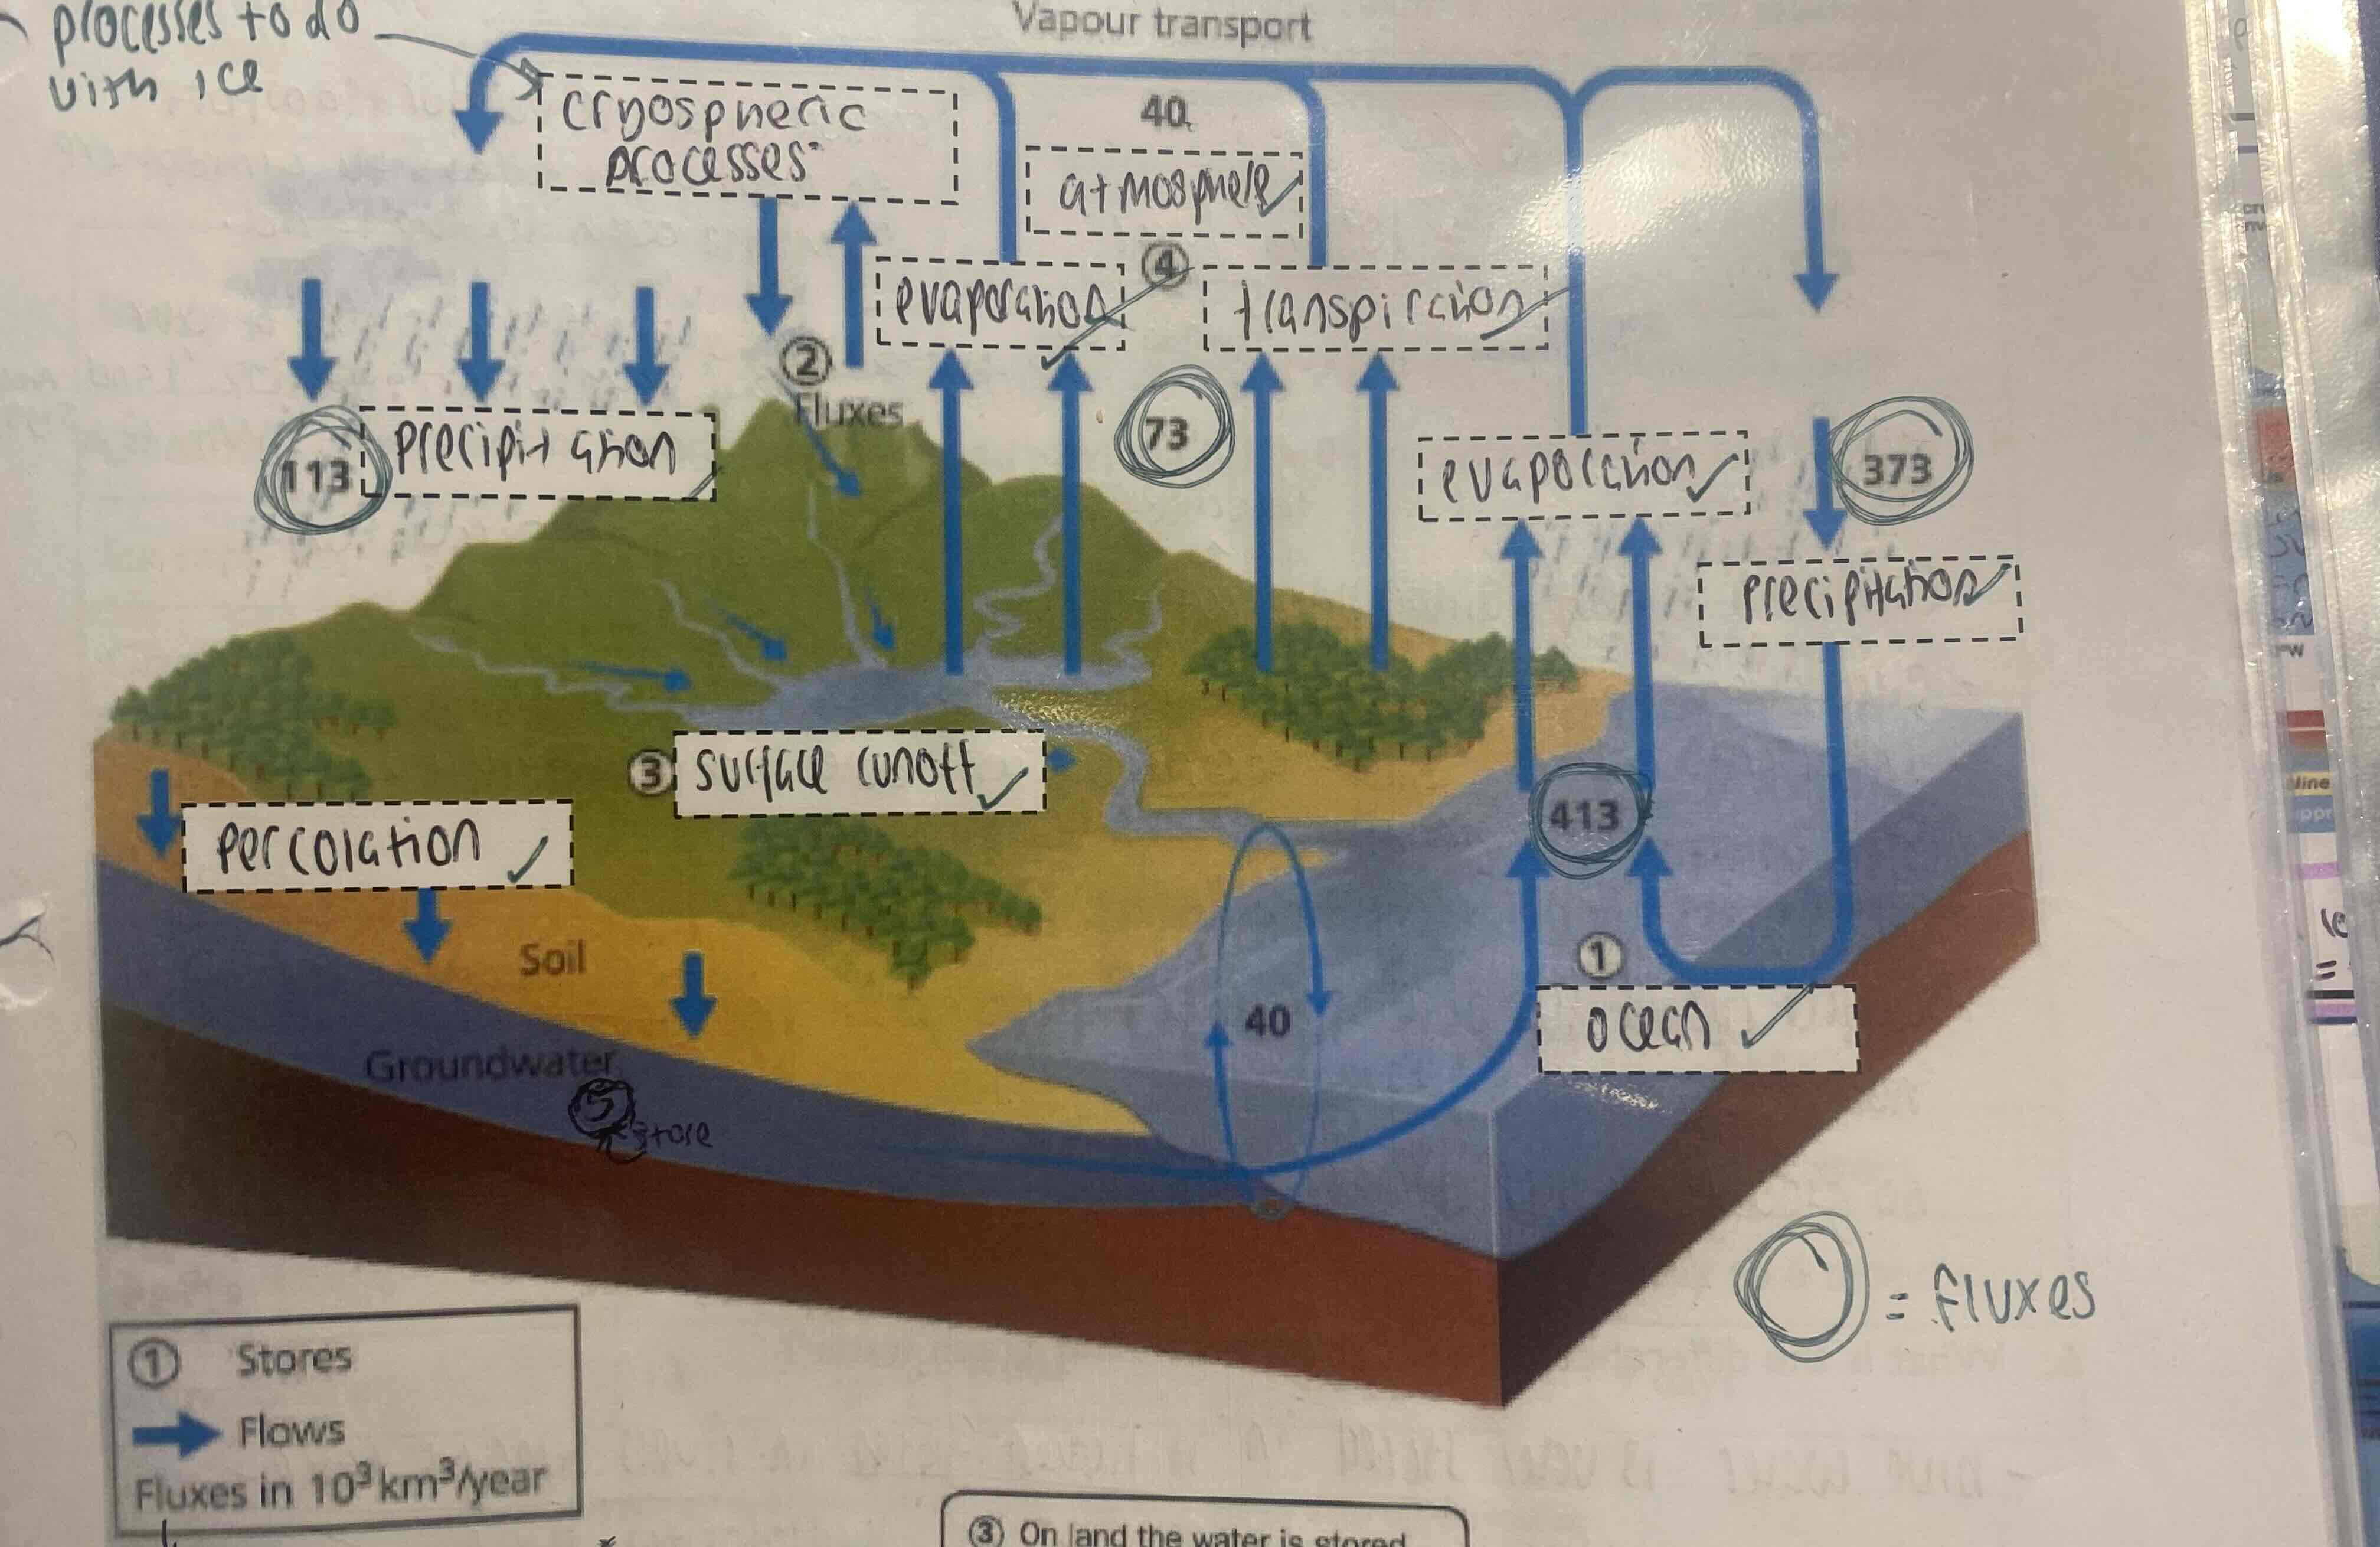
Difference between blue and green water
Blue = visible water in the cycle e.g. rivers and lakes
Green= invisible water in the cycle e.g. water stored in vegetation or beneath the surface in the soil
what is the circular flow shown in the oceans e.g. 40,000km³ per year/ 40×10km³ per year
-thermohaline circulation ( convection currents driven by temp change and salinity)
-important because they drive heat around the earths oceans and effect climates
World water stores
Oceans = 97% - inaccessible due to salt- desalination= expensive
In the other 3%=
Freshwater=2.5% but 69% of freshwater is stored as glaciers and icecaps so inaccesbile due to being a solid form and isolated location+ resident time= 20-100yrs for glaciers and longer for ice caps but meltwater= only water source for some mountain communities
Surface and other freshwater= Mainly ground ice and permafrost- shallow groundwater stores = accessible from wells but deeper= less accessible and some stores are fossil so finite - Mediterranean limestone islands
Accessible surface freshwater= less than 1% and Mainly in Lakes- Natural and artificial but lakes and rivers are only 0.01% of worlds water
Some of freshwater is take up by plants( green water) and atmosphere and soil
Residence time
How long water remains in a store- important because it impacts the turnover within hydrological cycles
Longest residence time = oceans and shortest = atmosphere then icesheets/caps and then rivers
Only an estimate because there is variation within stores
Aquifers
Areas of significant groundwater storage normally in rock pores
And are recharged through precipitation and subsequent infiltration and percolation.
Fossil aquifers are ones that are no longer recharged possibly due to being trapped under a impermeable layer of rock or climate change
Drainage basin definitions
Drainage basin- The area of land drained by the river
Source- point where river starts
Tributary- A smaller river meets lager river
Confluence- where two tributaries meet
River channel- The eroded path of the river, consists of bed and banks.
Watershed- Boundary of a drainage basin
Important drainage basin hydrological definitions
Percolation- After infiltration and is the downwards movement of water through soil to groundwater zone.
Evapotranspiration
Precipitation
Aquifer- a layer of permeable rock that acts as a underground store of water
Infiltration
Evaporation
Groundwater- percolated water that is stored deep below the surface
Water table-Uppermost level of saturated groundwater zone
Local Hydrological cycle diagram
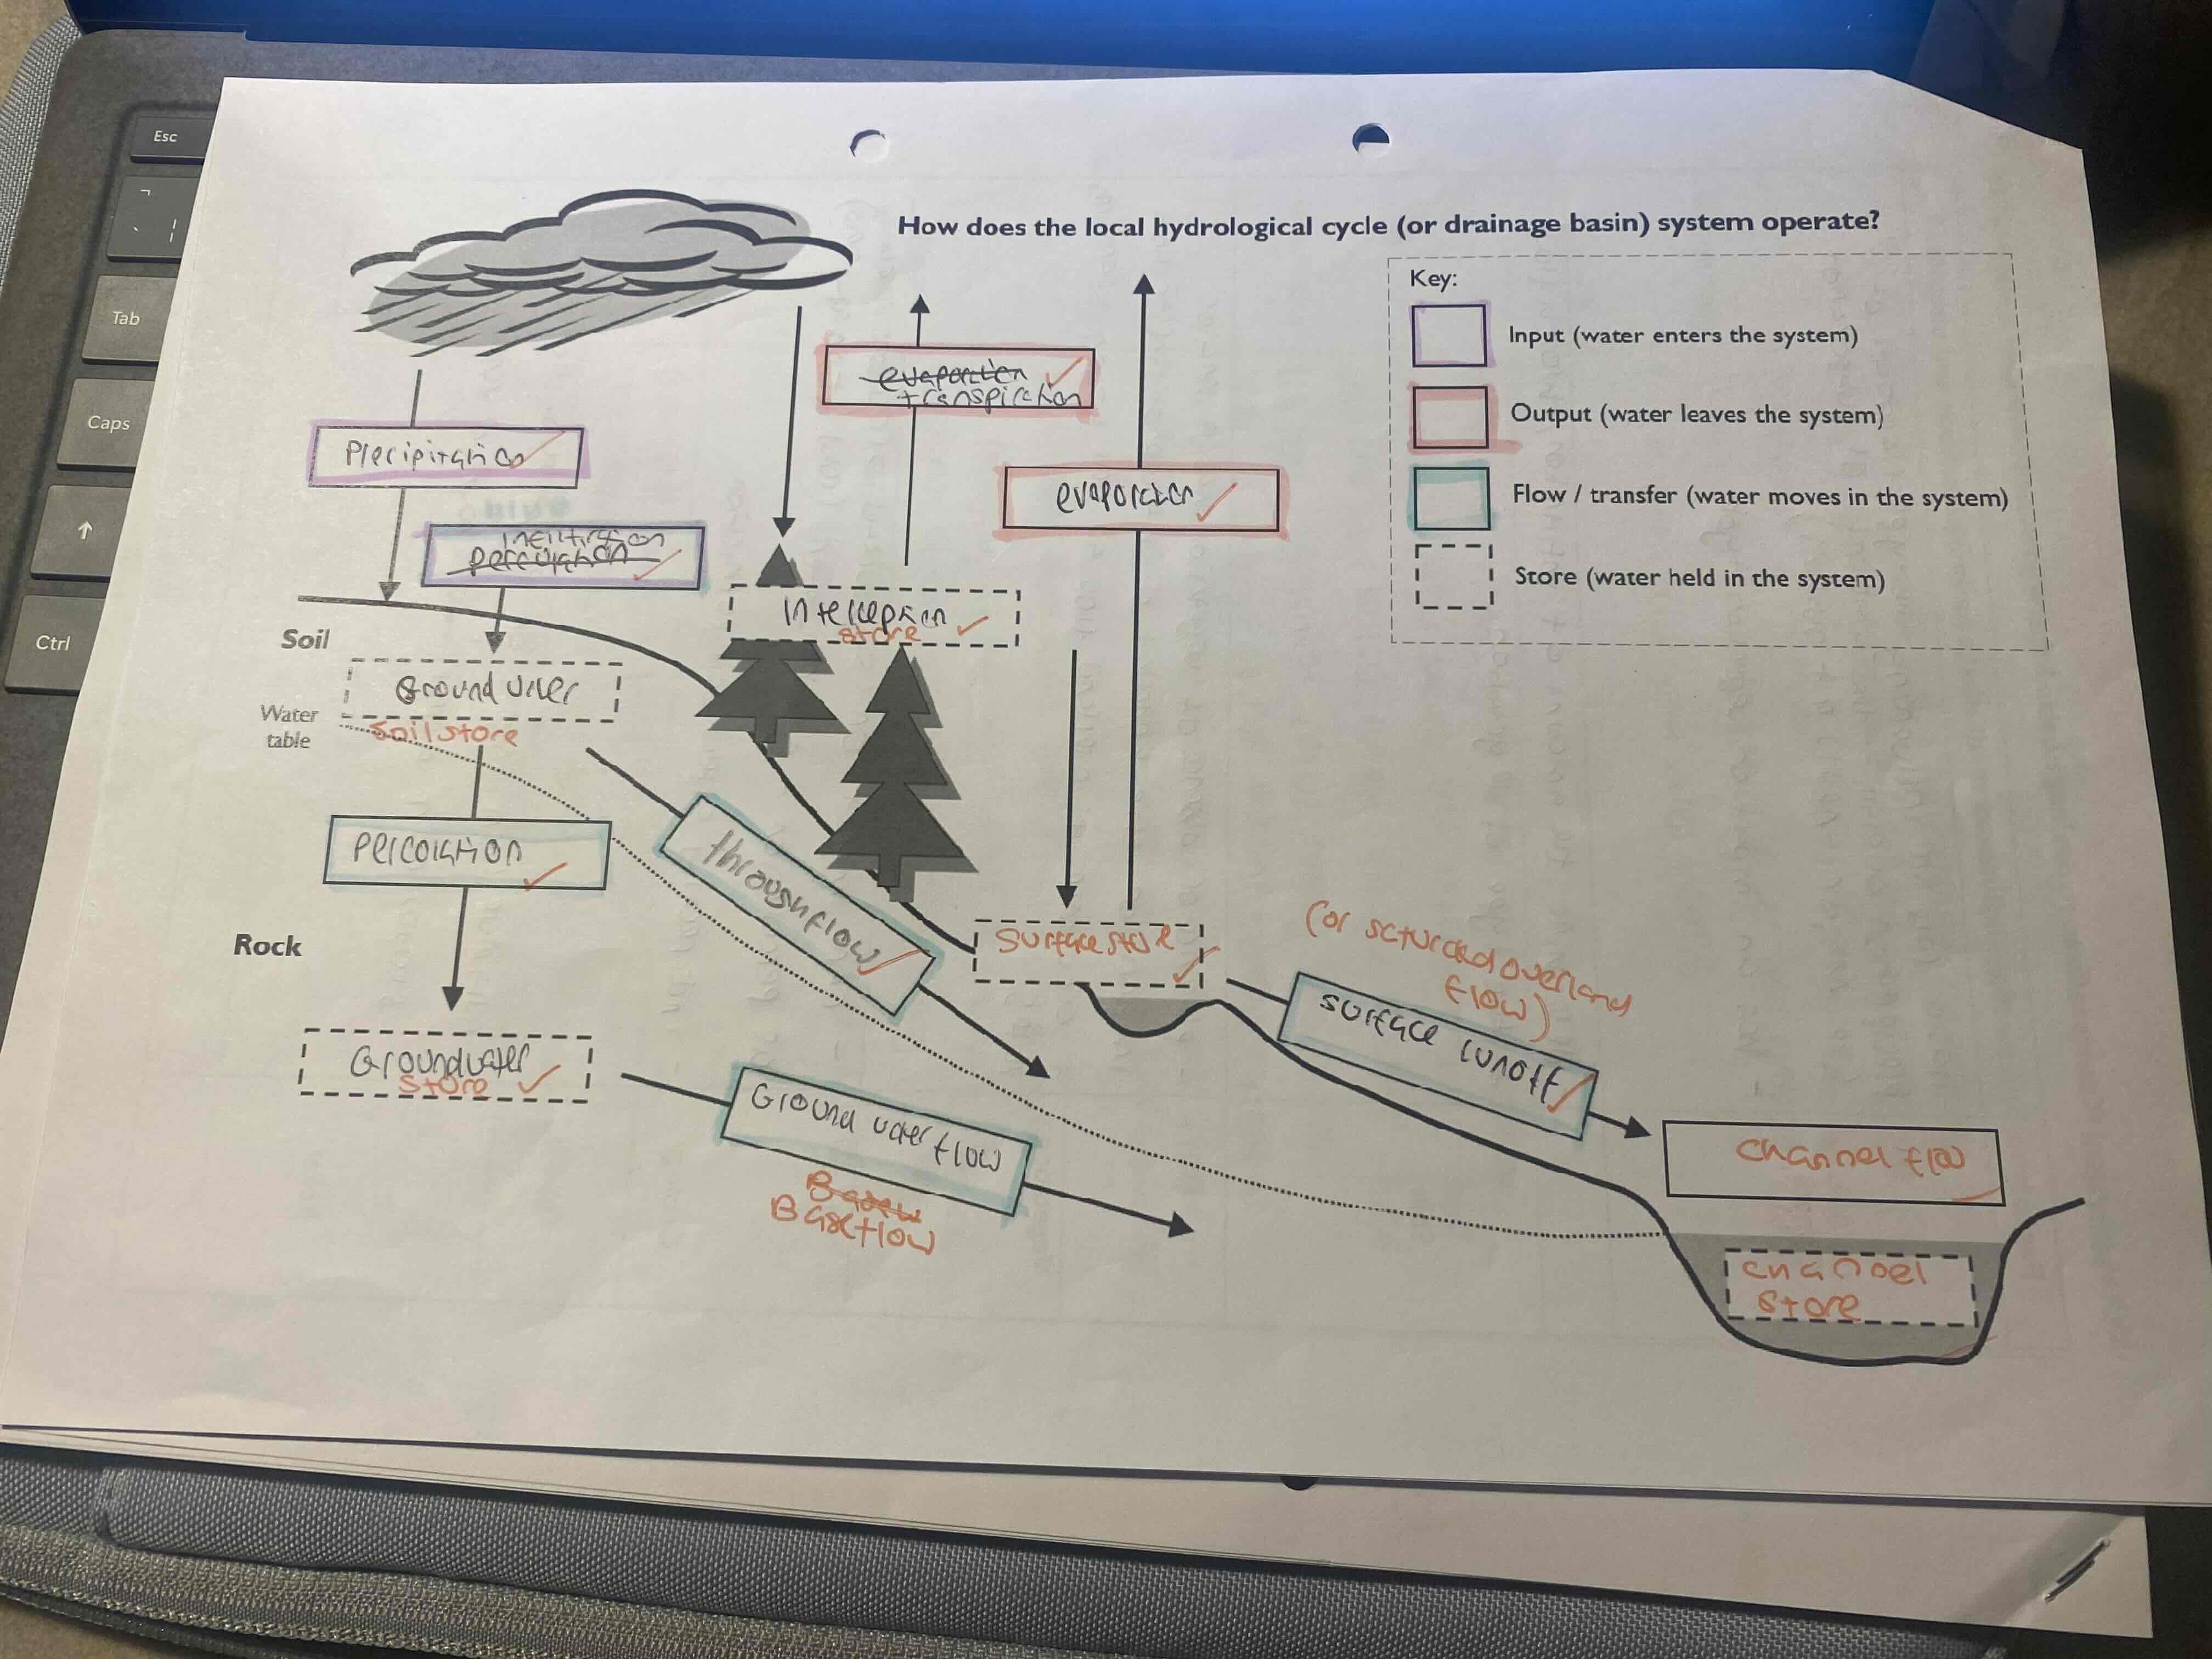
Physical factors effecting drainage basins inputs flows and outputs
climate
soils
vegetation
geology
relief
Have a go at a brief explanation of influence of each factor
Human factors effecting drainage basins inputs flows and outputs
Deforestation
Urbanisation
Water abstraction
Dams
Have a go at a brief explanation of influence of each factor
How does solar radiation change across globe
Global energy budget- shorter wavelength near equator = higher temps
Temp variation with latitude- nearer equator = less atmosphere for radiation to pass through and radiation is more concentrated.
Temp effecting Air movement which effecting precipitation
hot air rises and cools and cant hold as much water vapour= low pressure + high rainfall (vise versa)
Global circulation model= Hadley, feral, polar
Also wind direction effects precipitation patterns as surface winds blow from high to low pressure and create trade and westerly winds and onshore winds create higher precipitation.
types of rainfall- convectional
- Land becomes hot= air becomes hotter + rises= starts to cool as rising and ability to hold water vapour decreases= precipitation
common in equatorial areas and UK in very hot summers
Types of rainfall- orographic
- air forced to rise over barrier (mountain)= air cools and condenses= rain + leeward /downwind slope receives little rain (rain shadow)
Type of rainfall- frontal / cyclonic rainfall
-warm air= lighter and less dense is forced to rise over cooler more dense air= as it rises it cools and ability to hold water vapour decreases=condensation + cloud formation = rain
Global water balance
highest rainfall= equatorial = convection rainfall + more precipitation than evaporation= large surface runoff = positive water balance
Tropics= lower rainfall + higher evaporation= negative water balance
Mid lats= positive water balance
poles = higher pressure + low rainfall but little evaporation = slight positive water balance
LINK TO GLOBAL CIRCULATION (LOW PRESSURE = HIGH PRECIP)
Potential evpotransipration
Amount of evaporation that would occur is their was a sufficient water source available
example : Sahara= high potential evapotranspiration because of climate but low in reality due to lack of water stores
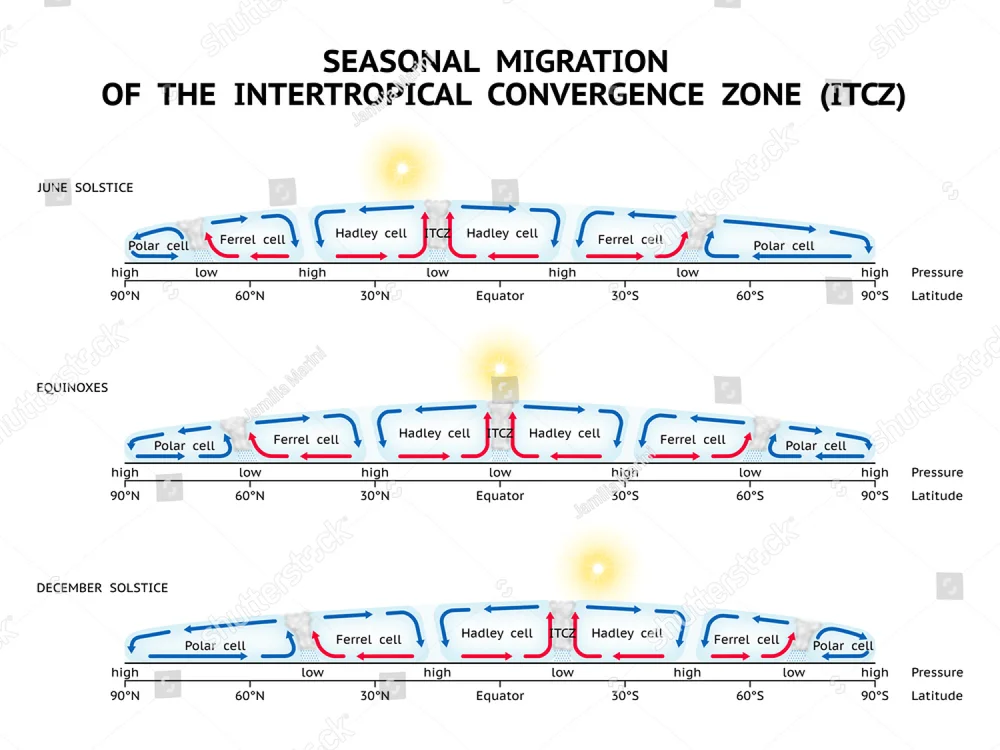
ITCZ ( inter tropical convergence zone) - diagram
ITCZ= migrating zone which moves with the movement of the overhead sun.
June solstice = ITCZ migrates Into Northern hemisphere
Equinoxes= sun overhead = in middle
December Solstice= Migrates to sourthern hemisphere
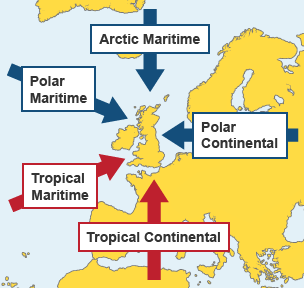
Eurpoe’s air masses diagram
2 most common= polar maritime= cool and moist (precipitation)
Tropical maritime= warm and moist (precipitation)
Together form mid latitude depressions
River regimes defintion and determitation
Annual variation in discharge- seasonality- climate
Primarily determined by climate of thee area ( rainfall (amount and distribution) and rates of evapotranspiration and snowmelt)
Few UK rivers left with natural regimes due to land drain control of flow, finshing and recreation.
Not the same as storm hydrography’s so not get mixed up
Things effecting river regimes
winter water stored as permafrost or snow
snowmelt in spring = increase in discharge
UK= more deciduous trees= higher evaporation in summer and higher temps too.
intense storms and convectional rainfall
near equator= low pressure systems all year round.
Factors effecting Storm hydrographs
Valley side steepness
Soil type
Size of drainage basin
Vegetation
Human activity
HAVE A THINK HOW?
River Ock and River Lamborn STORM HYDROGRAPH EXAMPLE
Lamborn= steadier river- lager drainage basin + chalk so porous and water can flow through
Ock= Flashier river- Smaller drainage basin + clay= impermeable and small pores= less infiltration + percolation.
Both have same precipitation as are neighbouring
Drought definition
A period of abnormally dry weather that causes serious hydrological imbalance in a specific region.
-distribution of drought varies globally e.g. high in tropics and less drought along equator
Drought definition
A period of abnormally dry weather that causes serious hydrological imbalance in a specific region.
-distribution of drought varies globally e.g. high in tropics and less drought along equator
Types of drought
meteorological= long term precipitation is lower than usual (precipitation deficit)
Hydrological= deficiencies in surface and subsurface water supplies as measured in rivers, reservoirs, lakes and groundwater. Originates from lack of precipitation but can follow or come with Meteorological or agricultural drought ( stream flow/river channel flow deficit)
Agricultural= In sufficient soil moisture to meet demands of particular crop at particular time. A deficit of rainwater over cropped areas in critical periods of growth can cause crop failure. (soil moisture deficit)
Famine= Widespread failure of agricultural systems, food shortages develop in to famine and have severe social, economic and environmental impacts. (food deficit)
Global atmospheric circulation system process
Intense solar at equator= warm air= rising= air cools= condenses= rainfall
Subtropical high pressure from sinking equatorial air = belt of high pressure dry+ hot
Air returns to equator at ground level creating trade winds
Trade winds meet ITCZ. ITCZ moves with seasons. This movement causes alternating wet and try seasons in tropics ( seasonal rain)
Warm air = mid latitudes to subtropics meets cool polar air at polar front= less dense warm air rises causing condensation and rainfall
Warmer air rises into polar front jet stream and is transferred at high altitude towards poles= cools + sinks= ground level movement o air towards mid lats.
How does global circulation cause drought in Sahel
Tropics= high pressure = low rainfall (associated with Hadley cell)
Migration of ITCZ results in wet season in summer months as ITCZ shifts northwards with overhead sun.
Sometimes tropical high pressures associated with descending air from Hadley cell block the high humidity= blocks arrival of wet season + serve drought can occur.
Mid latitude Anti-cyclone blocking
High atmospheric pressure where air is sinking - high pressure= stable= blocks low pressure systems such as cyclones which bring precipitation= results are dry stable weather.
Oceanic components need for El Nino
El Nino occurs when sea surface temps are +0.5 higher than average.
This increase represents a huge store of energy in the deep ocean and can sustain a ENSO event.
What are El Nino Southern Oscillations
When the climate system around the equatorial Pacific undergoes irregular change every 3-7 years. The surface waters of ocean interact with atmosphere and change occurs (coupled ocean-atmospheric systems). A positive feedback is created which amplifies small changes in ocean temp.
Oceanic components need for El Nino
El Nino occurs when sea surface temps are +0.5 higher than average.
This increase represents a huge store of energy in the deep ocean and can sustain a ENSO event.
Atmospheric components needed for El Nino
Air pressure changes in response to sea surface temp change
If pressure gradient (the difference between High and low pressure) decreases then winds = less strength and can even reverse direction.
The wind pulls a huge cell of warm water across Pacific from W to E during an El Nino.
Impacts of ENSO
Causes drought conditions in Australia and Indonesia
And flood conditions in South America.
Also has knock on impacts on other parts of world due to global temps being higher in El Nino years and lower in La Nina years.
El Nino year circulation + impacts
Trade winds weakened significantly+ sometimes reversed
Less surface water moved E-W so AUS NE coast = cooler= high pressure + less rainfall+ potential for drought
Surface of E pacific= warmer than usual and cold water is unable to well up from deep = warmer= rising air= lower pressure= higher rainfall than usual in South America+ potential for floods
IF SURFACE WATER IS ALOT WARMER THAN USUAL = GLOBAL TEMP RISE
2015-16 El Nino impacts
Australia- Low rainfall = drought and bushfires
South America- Hit by worst floods in 50yrs and over 150,000 people forced to evacuate.
Pacific Islands- Drought conditions in west pacific= 4.7m people effected
Ethiopia- Severe drought= 80% of harvest failed and affected 22m people.
Neutral year circulation + impacts with diagram
Trade winds E to W across pacific
warm surface water moves E to W and pools of coast of Aus. = rising warm air= instability= low pressure= rain
-Norm in AUS= High rainfall on NE coast
cold waters from deep wells up of coast of South America= air cools= stable air conditions= high pressure+ little rain
-Norm in South America= Arid climate on west coast
El Nino year circulation + impacts
Trade winds weakened significantly+ sometimes reversed
Less surface water moved E-W so AUS NE coast = cooler= high pressure + less rainfall+ potential for drought
Surface of E pacific= warmer than usual and cold water is unable to well up from deep = warmer= rising air= lower pressure= higher rainfall than usual in South America+ potential for floods
IF SURFACE WATER IS ALOT WARMER THAN USUAL = GLOBAL TEMP RISE
Human Actions that Exacerbate flood risk
Urbanization- Impermeable surfaces,
straightening river channels, change in land use associated with change in agriculture, urban areas tend to be low lying= flood risk
Deforestation- less interception, less storage, less transpiration, less soil structure= decrease in lag time= increased flood risk
Changing farming practice- Deforestation, ploughing, over grazing, drowning of wet land for agricultural use + normal upstream from urbanized areas= knock on effect downstream urban areas = increased flood risk= downstream knock of effect (snowball)
La Nina year circulation + impacts
Trade winds blow stronger E-W
Warmer surface water E-w and pools off coast of AUS in even greater quantities than usual= more rising air= more unstable= very high rainfall= flood conditions
More cold water wells up in E pacific- off coast of South America = more stable= less rain than usual = drought conditions
Meteorological Physical factors that cause flooding
Meteorological = short term weather events
Prolonged and heavy rainfall = cumulative effect on drainage basins= extreme flooding (eg UK associated with Depressions+ degree of flooding depends with pattern of depression)
Extreme monsoonal rainfall- Dry most year + then intense short period rainfall ( around 70% of rainfall in 100days) so low lying land= floods + landslides (eg Bangladesh- low lying = flood / Pakistan 2010 =flashfloods + landslides
Snowmelt- Late spring= melting= can cause intense flooding (eg Extensive snowmelt flooding continental interiors of Asia + America)
Ice melt- Snow melt sometimes held up by temporary ice dams but when these melt= catastrophic draining of glacial lakes (eg. Himalayas= glacial outburst floods due to ice melts = catastrophic glacial lake drainage
Human Actions that Exacerbate flood risk
Urbanization- Impermeable surfaces,
straightening river channels, change in land use associated with change in agriculture, urban areas tend to be low lying= flood risk
Deforestation- less interception, less storage, less transpiration, less soil structure= decrease in lag time= increased flood risk
Changing farming practice- Deforestation, ploughing, over grazing, drowning of wet land for agricultural use + normal upstream from urbanized areas= knock on effect downstream urban areas = increased flood risk= downstream knock of effect (snowball)
Flooding in UK-River Greta
two main watercourses running close to Keswick are The River Derwent and River Greta. And since 1822 approx. 20 significant flood events have been recorded.
2005- 75yr flood. United Utilities pumping station failed and sewage leaked in 35 houses.
2009- 70yr flood flooding 250 houses
2011-12- Keswick flood risk management plan created and 77yr flood
2015- river Greta overtopped flood defences
South Asia v UK floods- reasons for differing impacts
Capacity to cope- Less capacity in SA lower GDP and corruption and trans boundary river systems
UK is associated with mid latitude depressions and river flooding and SA associated with heavy rainfall on monsoon season
Infrastructure + dev. - UK is developed and SA= less so more likely damage in SA
population density- Bangladesh pop density= 1,265 people per km² compared to cumbia= 74 people per km²
Causes of flooding in South Asia ( Nepal, India, Bangladesh)
monsoon rainfall-June-sept ( 80% of S Asia rain)
Snowmelt-March-June in Himalaya + Tibetan Plateau, particularly effects Brahmaputra
tropical Cyclones- April-Dec (ocean temps over 26)- Particularly effects Bangladesh
Relief- Himalaya-steep slopes but Bangladesh= low lying( less 3m above sea)
Deforestation- Eg 1990-2005 Nepal lost 24.5% of forest cover
Population Growth and urbanization- High (eg. Bangladesh 1960= 50m/ 2016-163m)
Example of flood history in Bangladesh
flood are a regular occurrence examples:
1987- 60,000km²of land and a 30-70yr event
1988- 80,000 km² of land land 50-100yr event
1998- 75% of total area of the country including half capital city +30m homeless
Key impacts of 2017 South Asian floods
In India- Bihar- Death tole over 500 and flood effect over 17m people in India
Mumbai (India)- streets flooded and public transport paralysed. Mumbai is trying to make itself global financial hub but city is struggling to cope in annual monsoon season
Nepal- 90000 home destroyed and 1.4m people affected
Bangladesh- 7.1m effected in Bangladesh and 600000 farm land damaged which the economy relies on.
Flooding in UK-River Greta
two main watercourses running close to Keswick are The River Derwent and River Greta. And since 1822 approx. 20 significant flood events have been recorded.
2005- 75yr flood. United Utilities pumping station failed and sewage leaked in 35 houses.
2009- 70yr flood flooding 250 houses
2011-12- Keswick flood risk management plan created and 77yr flood
2015- river Greta overtopped flood defences
South Asia v UK floods- reasons for differing impacts
Capacity to cope- Less capacity in SA lower GDP and corruption and trans boundary river systems
UK is associated with mid latitude depressions and river flooding and SA associated with heavy rainfall on monsoon season
Infrastructure + dev. - UK is developed and SA= less so more likely damage in SA
population density- Bangladesh pop density= 1,265 people per km² compared to cumbia= 74 people per km²
Why is there uncertainty over the impact of climate change on the global hydrological cycle?
uncertainty of impact of climate change due to uncertainty over future temp change
Highest projection for year 2100 is increase of 5.4 and lowest= increase 0.25
Also climate change is only one process modifying global hydrological cycle there is also human impacts eg deforestation. And it is hard to split the human impacts from climate change impacts
Human Factors effecting likelihood of drought CASE STUDY- SAHEL
In Sahel there were many human factors that exacerbated the drought conditions. (Human factors don’t cause meteorological drought but enhance its impacts)
In Sahel GPD is low, national debt, population growth is exponential so agriculture is under increasing pressures to feed and help pay off debt.
PHYSICAL FACTOR- Less rainfall= increased drought + Global Warming = less reliability of rainfall= vegetation dies…
Human- Increase in animals (above carrying capacity of fragile grasslands= overgrazing (soil depleted of nutrients) = vegetation cannot reestablish itself….
Pop growth- Farmers forced to use more land for food + cash crop = overcultivation= reduced soil fertility+ veg. removed ….
Immigrants- increase in demand for wood for cooking, heating + buildings- Deforestation- veg removed….
…. Decrease in protective veg. cover= soil exposed to wind and rain so erosion= Increase in evaporation from soil - possible salination= increase risk of soil erosion= DESERTIFICATION
What human factors increase the likelihood of drought - CASE STUDY- MURRAY-DARLING - SOUTHEAST AUSTRALLIA.
AUS. most important food-production region (40% of all farm produce- £20b). Agriculture accounts for 60% of AUS. water consumption
Irrigation schemes began 1887, series of reservoirs + canals to redistribute water from MD to more arid areas.
Av. only 54% of water flowing in river reaches mouth + lower in drought years.
Contamination- Much of bedrock under MD is rich in salt. Excessive land clearing + saline groundwater (gets used) = water contaminated with salt
How may precipitation change, resulting in increase flooding and drought?
Increased temp of land + sea surface= more evaporation + atmospheric moisture= more intense short periods of rainfall = floods
Increased temps= more intense high pressure systems= reducing rainfall= causing drought
Increased evaporation= reduce in surface store (if not replenished)= Hydrological drought
Increased sea surface temps= Intensification of El Nino cycles= intensified extremes.
CLIMATE CHNAGE= INCREASE IN BOTH EXTREMES
Other hydrological cycle components change as result of climate change
INCREASE
Evaporation, Transpiration
DECREASE
Permafrost, snow, ice, oceans
INCREASE+DECREASE
Run-off/ stream flows= increase in drought + floods
Examples for a RIVER REGIME QU
Nile - Blue Nile= summer discharge due to movement of ITCZ meaning low pressure + high rainfall in summer- there is low rainfall for the rest of the year
High latitudes- eg N. Russia- Winter= all precipitation= snow and rivers = ice but spring= meltwater= huge spike of discharge in spring/summer
Monsoon- pronounced peak in river discharge in Summer- Ghanges
Bramaputra= summer peak but earlier due to snowmelt
Uk- mid lats = winter precipitation + high evaporation in summer means winter= peak of discharge
Why is there an uncertainty over the impact of climate change on the global hydrological cycle
uncertainty of future temp change
Highest projection for year 2100= increase of 5.4 and lowest= increase of 0.25
The higher the prediction the more extreme the changes are likely to be, including the extent to which drought and flooding intensifies
definition of water security
the capacity of pop to safeguard sustainable (future too) access to adequate quantities of acceptable quality of water to sustain livelihoods, human well being and socio-economic development, for ensuring protection against water- borne pollution and water related disasters and for preserving ecosystems in a climate of peace + political stability
Add pic
Water stress+ scarcity definitions
Stress- when annual supply of water per person falls below 1700m³ (point of shortage)
Scarcity- when annual water supply per person falls below 1,000m³ (shortage). BY 2050 1.5b of world pop will be experiencing water scarcity
Physical causes of water scarcity
Higher rainfall at equator than poles + tropics= determined by global circulation= limited rainfall=basis for insecurity
Sahel- less rainfall with time (due to climate c?) = limited rainfall supply= insecurity basis
Senegal + Pakistan- seasonal rainfall dur to ITCZ + monsoon + so seasonal drought
River Colorado- Annual discharge= fluctuates +- 15 but slight pattern of decrease (climate change?)
Storage in major global aquifers= decrease= insecurity
saltwater encroachment due to rise in sea level/ increase storms= limits freshwater supply= insecurity
Human causes for water insecurity
Western Europe, eastern China, India= large pop= large demand/ Sahel= marginal area + demand= insecurity
increase world pop= demand increase= over abstraction
higher standard of living in Europe, USA, Aus., Canada= demand increase (excessive use creates insecurity)/ less developed areas= less access= insecurity
Income higher globally= use more water= domestic demand increase
India (developing)= main use= agriculture due to overpopulation + primary sector demand= pot. insecurity
Agriculture, industrial, domestic all waste water= polluted= less supply= insecurity + increase demand in each sector
What is water insecurity
when demand outweighs supply
Why do water prices vary
length of transporting water effect price e.g. Arizona= piped over 400km from River Colorado
Availability effects price e.g .water price significantly increased in recent California drought
Developing meg cities=(insufficient infrastructure= due to lack in gov investment + rapid pop growth= increase demand. e.g. Informal water vendors in Philippines 4x more expensive than tap
Players involved in supply water (urban areas tend to be supplied by private water companies= expensive) e.g. Colombia= companies charge highest prices in world vs Cuba gov subsides water to make affordable
Privatisation of water e.g. Bolivia transferred to Us affiliated private water= dramatic increase in price
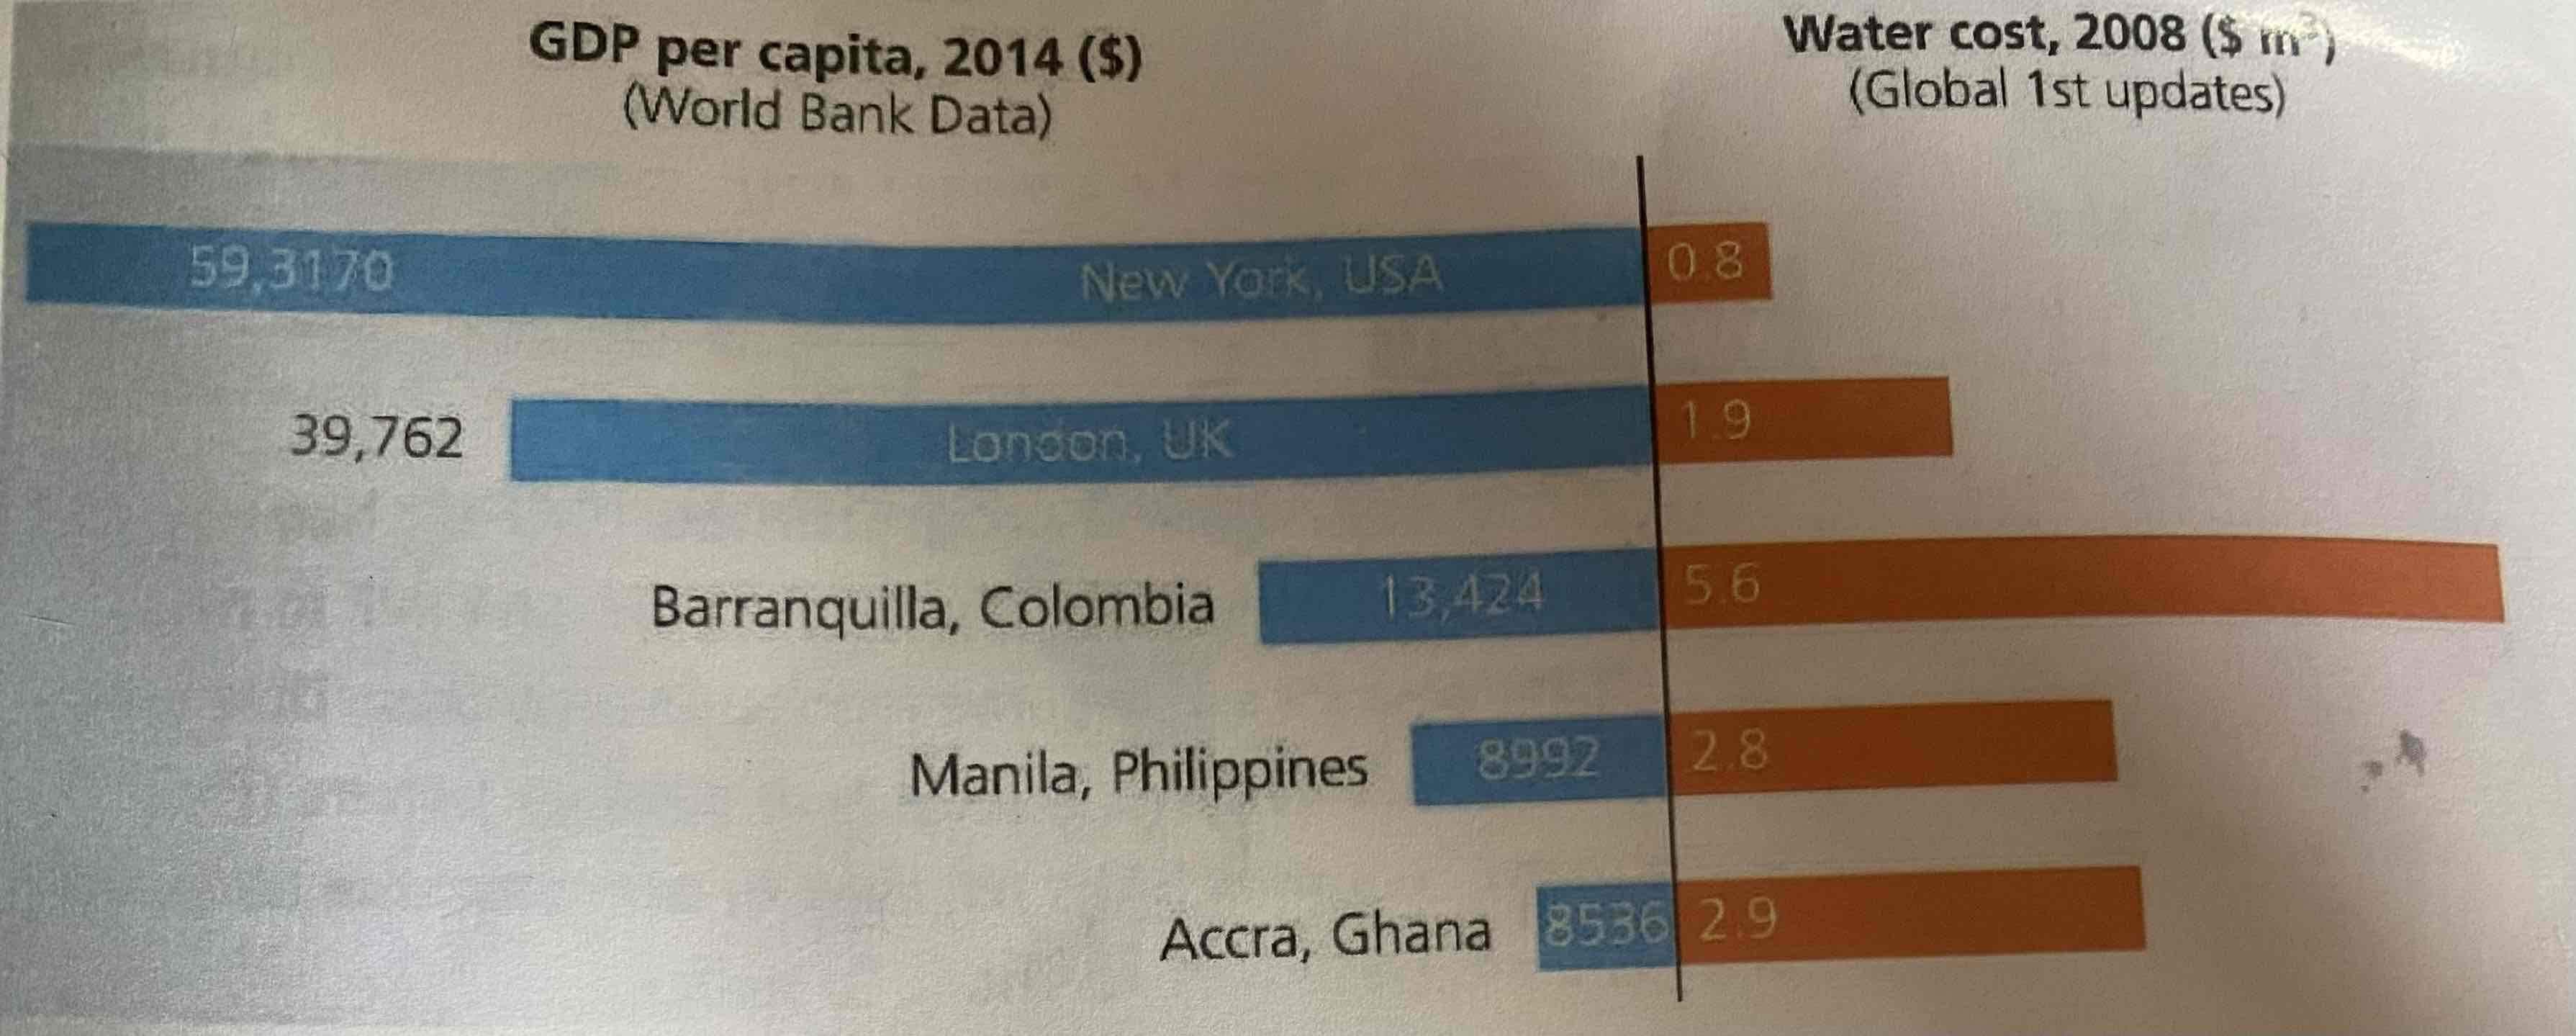
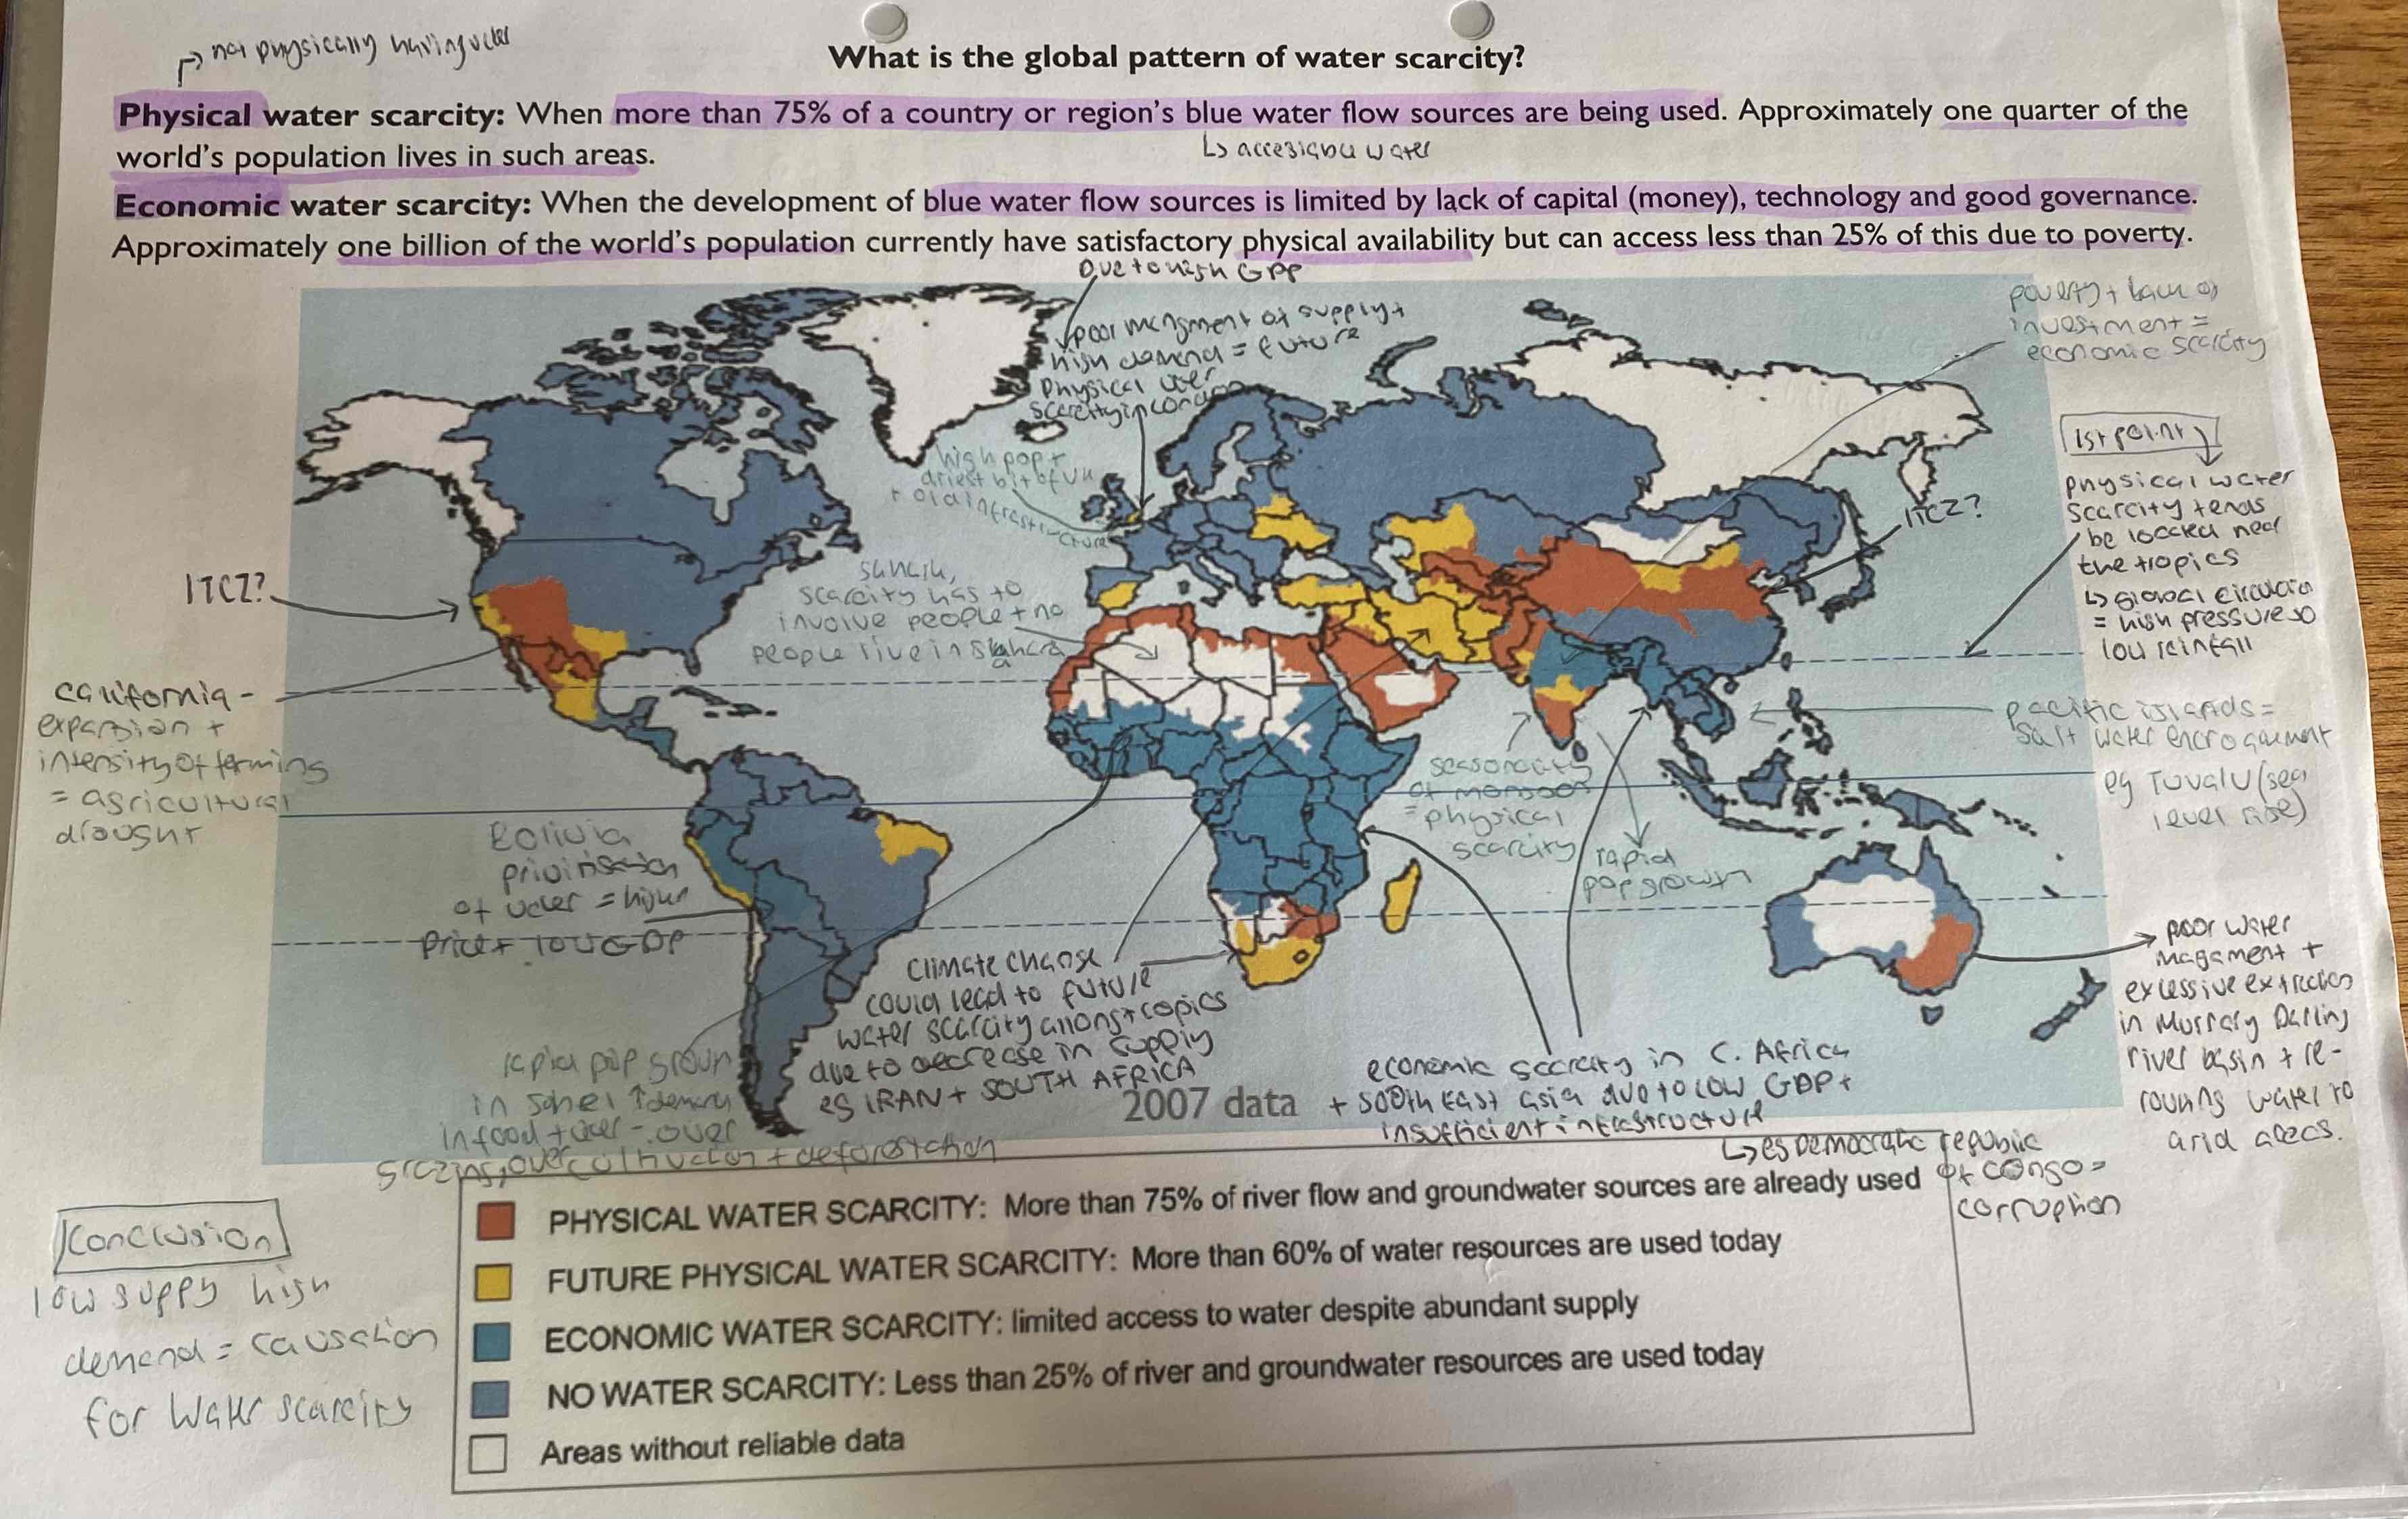
Definition of physical water scarcity
more than 75% of country/ regions blue water flow are bring used
SW USA, SE AUS, North African Coast
climate: low precip/ seasonality, climate change, rapid pop growth, usage- main factor= low precip= effects supply
Definition of economic water scarcity
Blue water flow is limited by lack of capital (money), tech + good governance
Large areas of Africa (Sahel), S America
wealth, water cost, factors are human but pressure accentuated by some physical factors so both importantWater u
What is global pattern of water scarcity
Picture
Water usage by agriculture sector
greatest use of water globally
Egypt- Desert environment= rely of irrigation= 86% of Egypt’s water use + complex infrastructure
P= essential for food product= economic growth
N=water conflict (especially Transboundary)
N=Environmental issues- salinisation of soils due to excessive irrigation + evaporation
Water usage by industry sector
20% of all water withdrawals
Drink manufacturing= 140l to produce 1l of soda + 300l to produce 1l of beer
P= essential for production of range of goods, drinks, food= economic growth
N= conflict between economic + social water needs
N= water polluting form chemicals= ecosystem damage + human health threats
Water usage by energy sector
Over 50% of energy usage of water= HEP + nuclear
HEP= large stores of water in reservoirs
Nuclear= cooling fuel in reactors
Fracking= high pressure water to flush out gas- USA,CAN
P= vital for economic growth
P=these fuels contribute less to Climate change
N= water conflict (HEP of transboundary water)
N= warm water from Nuclear= ecosystem damage
N= fracking= chemical pollution of rivers in accidents
What can inadequate water supply do?
= easily impede any water dependant aspects of economy e.g. 2021 drought cost California agriculture $1b and nearly 9,000 job
Inadequate= cost public (see before notes)
Water usage v GDP per capita
usually positive correlation e.g. USA- water usage of 1,000m³/yr because of high GDP (40,750)= high standard of living= demand
Norway= high GDP but low water usage as they rely on imports of agricultural + industry products from other countries
Water issues in El Salvador caused by economic dev
= most densely pop country in Central America + regions lowest water reserve due to unchecked commercial exploitation
Nejapa aquifer= countries main water source is being exploited by local Coca Cola bottling company + other companies + sugar cane plantations- store has dropped 20% in 5yrs, resulting in rationing for domestic water (but big business = unaffected)
Large areas of surface water= contaminated by industrial + Agri waste
Desperate situation for locals (1/3 households having no/little access to water)
Access to water + sanitation facts
Percentage of people not using improved source of drinking water- lowest= democratic of public (40%)- Central Africa= lowest levels of people using improved
Percentage of pop using safely managed sanitation facilities= more dev countries= more sanitation facilities/ lower in S America, C Africa + SE Asia
Percentage of people practising open defecation levels- Central Africa= highest
1 in 4 people still lack safely managed drinking water at home
Contaminated water= water borne disease e.g. cholera
1.7b use drinking water contaminated with faeces
1.4m lives lost each year to inadequate water, sanitation, hygiene
Factors about Chinas water
China= 7% of worlds freshwater but needs to meet needs of 19% of world pop
2/3 Chinese cities don’t have enough water all year round
China uses irrigation for 70% of food mostly in N + NE where Yellow river is running dry
National levels of water in China likely to reach stress levels by 2030
Factors causing water insecurity in Beijing-Tianjin area
Supply | Demand |
-NE China- prone to floods + in recent years drought -Most precip falls July-Sept + several wet years can be followed by several dry years -Beijing= 60% of water from aquifers - OVEREXPLOITED (due to high demand) by water qual is still ok -Tianjin relies on groundwater for 30% of water supply but salt water encroachment on coast makes water brackish -Surface water supply depends on 5 major rivers which are heavily contaminated | -Beijing= 16m + Tianjin= 11m pop -Tianjin= major port, heavy industry(demands lots of water) -Both= pop growth stabilising around 2.5% but rural-urban migration is still high -Beijing 1970/80= series of drought- increased demand + low supply= lowered water table in some areas by 40m -Water demand in Beijing-Tianjin region= 4.9bm³ per year -Fastest rate of increase= domestic- now averages 240l per p per day |
Summary of 3 Gorges Dam project
world largest hydroelectric scheme
China currently relies on coal fired power for over 70% of power so hydroelectric= clean energy + supports rapid industrial growth (but not enough HPE to meet scale of mass industrialisation)
However social + environmental coasts are already apparent well before economic advantages are seen
Pros + Cons of Chinas 3 gorges project
| Benefits | Costs |
Social | Flood protection could save many lives (Yangtze has history of floods, Dam= better management of floods) | Dammed water= drowning 100,000 hectares of farm land, 13 cities + 1,500 factories + heritage sites lost 1.9m displaced |
Economic | 18,000 MW of electricity (could save 50m tonnes of coal per year) Supply region responsible for 22% of China’s GDP |
|
Environmental |
| High Ecological impact on fisheries, biodiversity + habitats Pollution increase in water as factories + mines are flooded River= large sediment load= could damage turbines + sediment stave downstream |
Assessment of Cost ben of 3 gorges dam- China
cost ben shows overall economic ben- cost= 70m + ben= 140b= 1.55 positive ratio (but around 25yrs before money made on dam due to cost + reservoir will take years to fill so years for it to be economically viable
but this doesn’t include environmental + social cost ben which show overall negative which shouldn’t be ignored
social + economic costs will be seen well before economic bens
Summary of Chinas South North Transfer project
attempt of redistribute resource in S to N to even out availability of water
began in 2003 (estimated to take 50yrs) + will cost $62b
It involves 3 canals which run 1,300km across China + link countries 4 main rivers
Attempting to transfer 44.8nm³ per day
Cost ben analysis of China’s N-S transfer project
| Benefits | Costs |
Social | Improving water scarcity in economy viable places in N + people that live there (more drinking water) | Most people believe it is an unsustainable project Costs 48b dollars for short term relief |
Economic | Designed to divert 44.8b cubic meters of water annual to N- save China from water crisis that could set back it’s dev by years | About 345,00 villages have been displaced so far + rural areas left out + water table in south dropping |
Environmental |
| More than ½ Chinas 50,000 rivers vanished in past 2 decades Diversion Is creating scarcity in S poverty peripheral areas River pollution not fixed |
Aral sea location + why it is a good case study
Once worlds 4th largest Inland Sea, transboundary between Kazakhstan + Uzbekistan
USE FOR:
Example of water scarcity,
water qual issues,
social/health impacts of inadequate water + economic impacts,
water costs increase
water conflict/ transboundary water source
Large scale hard management water scheme
How did water transfer project led to shrinking of Aral sea + water scarcity
soviet union undertook major water diversion project on Aral sea region. The regions 2 major rivers (fed by snowmelt + precip) were used to irrigate farm for cotton + crops in desert area= major impact on world 4th largest sea
As Aral dried up, fisheries + communities that depended on it collapsed + increasingly salty water became polluted with fertilisers + pesticides. And now exposed bedrock was blown onto fields and degraded the soil (humans actions leading to water scarcity)
River diversion= less water to sea= shrinking sea= impact on evaporation= less rain= already arid= more arid
Benefits of the water transfer project (Aral sea)
Former soviet union
diversion of water to irrigate land + allow for development of fruit + cotton farming has created millions of jobs in a once unproductive regions
Uzbekistan Gov
Irrigation scheme allowed poor Uzbekistan country with few resources to remain one of worlds largest exporters of cotton + there is hope to discover oil deposits beneath the dry seabed
Cost of Aral sea water (social, environmental + economic)
Social | Environmental | Economic |
-Local residents= health problems from dust + salt + drinking water= heavily polluted= forced water tankers= expensive -Kazakhstan farmers+ irrigation= crops= salty+ polluted May people lost jobs in farming+ forced to become environmental refugees
| -Biodiversity dropped massively- about halved bird + mammal species + nearly no fish left -Water engineers- irrigation canals= built poorly= water can leak out + evaporate- main canal allows 30-75% of water to go to waste | -Fishing industry once employed over 60,000 people around sea has now collapsed + unemployment + economic hardship everywhere + shipping economy= collapsed |
Little Aral restoration project
2017 Kazakhstan gov secured $126m loan from world bank to help save N part of sea
Gov had used an earlier 70m loan to build a dam to split sea into 2
Officials claim N sea is already refilling
Has been effective in restarting fisheries + rain has returned
However S Uzbekistan side= still shrinking + may be too late to save it
Uzbekistan still need the water rom rivers for cotton to develop so river water isn’t reaching Aral
Both Syr Darya (Kazak)+ Amu Darya (Uzbek) headwaters are controlled by other countries= conflict
What conflict has been created as result of Little Aral sea restoration project
Conflict between Kazak + Uzbek, saving Little Aral has not helped save big Aral
By building dam it has stopped the Uzbekistan side having chance to fill up
Cross border water= always conflict
Political decision- choice to grow cotton (water needy) plant in desert= need irrigation but 50% of water evaporated before irrigated + all cotton farms owned by gov so excessive water used at no cost= pollution of water with pesticide
Aralsk= once key port town now= 50km from sea + water is transported from 150km away (scarcity) + 50,000 have migrated from town
Transboundary waters
aquifers, lakes, rivers shared by 2 or mor countries- supports the lives and livelihoods of vast nu of people across the world
reduced transboundary water supplies= potential to cause conflict between + within countries
UN-water have stated that dealing with this problem will require supranational, integrated approach to transboundary water resources management based on legal frameworks and shared benefits and costs.
River Nile info (transboundary water system)
6700km (worlds longest river)
2 main sources- Blue Nile (Ethiopian Highlands) + White Nile (further south in Lake Victoria)
White Nile= 30% of total discharge + Blue= shorter but provides majority of river’s flow
Control of blue Nile= massive impact downstream = most power in Ethiopia (source)
River regime is highly seasonal, peak July-Sept (also influenced by El Nino + La Nina cycles (inter annual variations)
So periods where water stress, scarcity= more likely (conflict= more likely)
River system flows through hot, arid areas including Sudd Swamp of South Sudan
Significant amount of flow can be lost to evaporation before reaching the delta
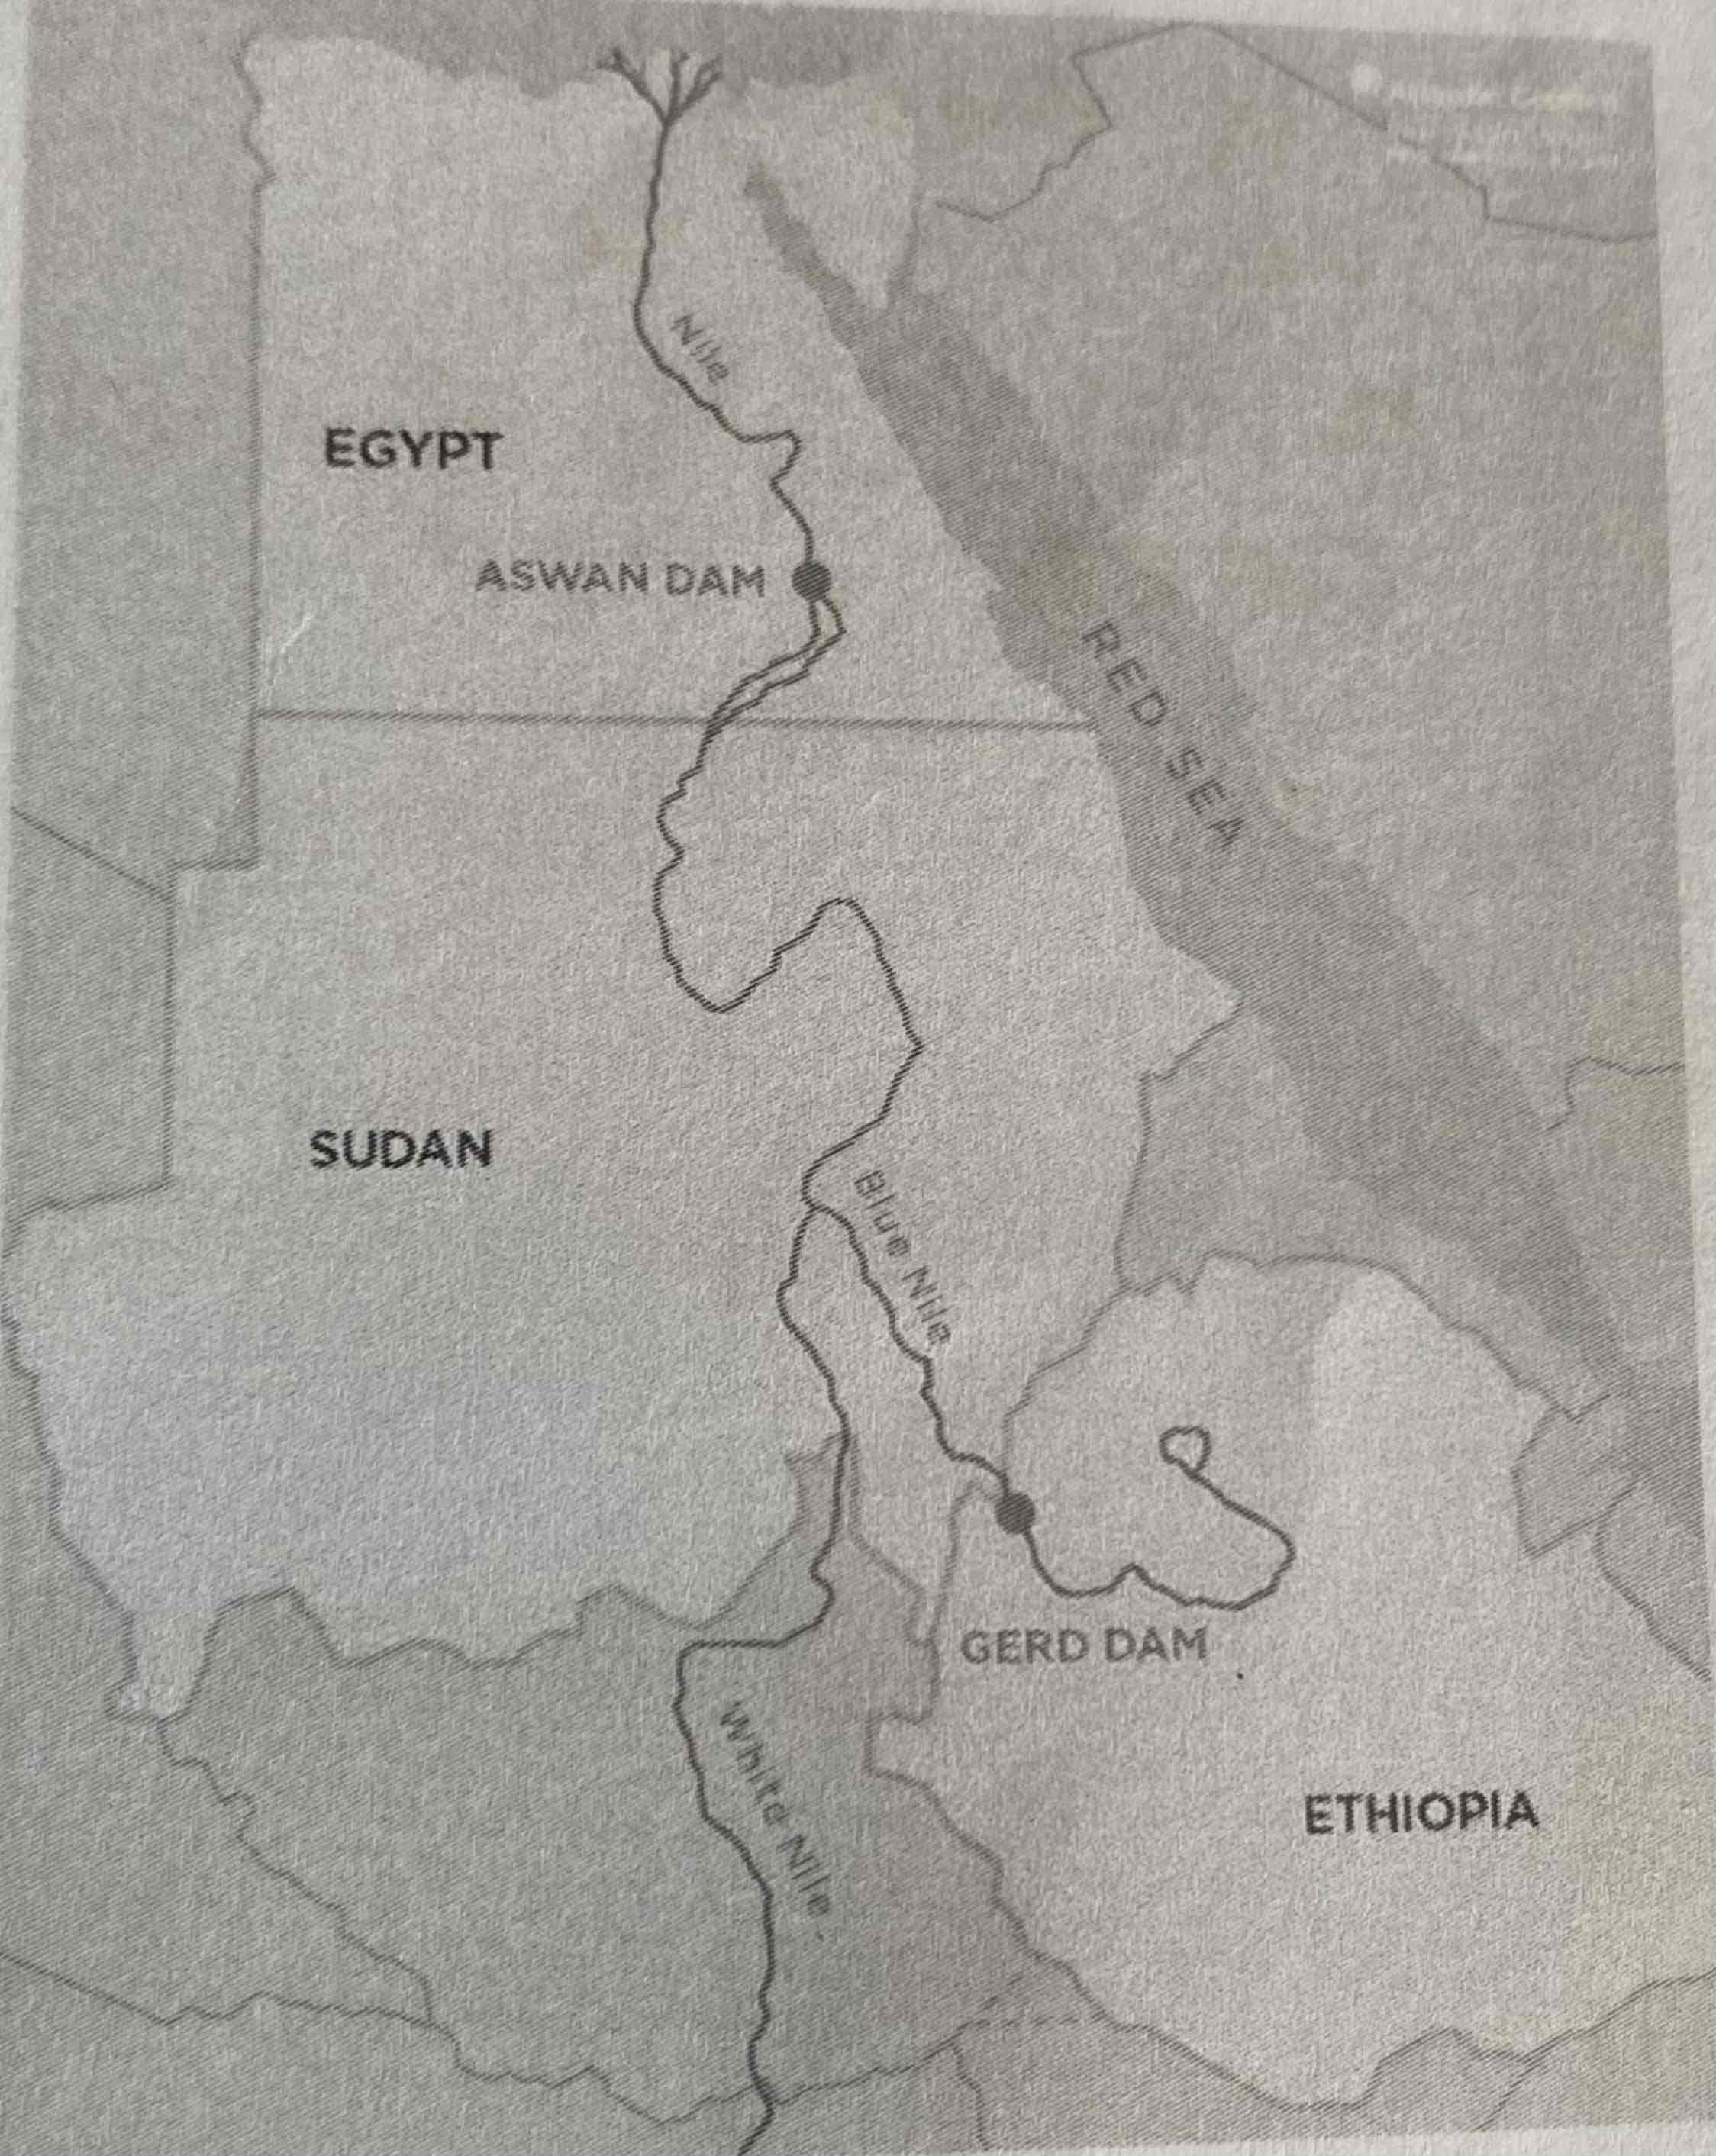
Grand Ethiopian Renaissance Dam (GERD)
been under construction since 2011 will be largest hydroelectric dam in Africa when finished
The reservoir will take up to 15yrs to fill before reaching full electricity capacity
It is trying to fuel industrialisation of Ethiopia
Dispute it will decrease flow in Sudan + Egypt (Egypt= especially stressed as it could decrease flow into their Aswan Dam
Potential cost ben of GERD in Ethiopia, Sudan, Egypt
Water is used as political advantage= TENSION
| Likely Benefit | Likely costs |
Ethiopia | -Will power Ethiopia + other countries industrialisation+ economic dev -70% of Ethiopia don’t have electricity dam will provide this (social dev) -Greater economic, political, strategic regional power Pop will double in next 30yrs= need GDP to double to keep up | -Didn’t ask other countries before starting build= threat of war -Thousands have been displaced already
|
Sudan | -Cheap electricity= faster dev -Regulate water levels, less floods (due to flatter regime) -Closer political alliance with Ethiopia -Access to electricity= potential to dev + use share of the Nile water= issue for Egypt | -water= highly politicized (not consulted before)= tension growing -reduced flow downstream if reservoir is filled to fast -dam might be used to exert power (need to maintain positive relationship with Ethiopia) |
Egypt | -In theory shouldn’t be threatened at GERD= HEP dam only | -Livelihood of Egypt depends on river -Severe impact on flow to Egypt- 2% reduction inflow= loss of 200,000 hectares of land (famine?) -Power balance= changing |
Restoration of River Kallang, Singapore (sustainable water management technique)
2012 restoration of 2.7km Kallang river- previously forced into concrete channel now opened up into a more naturally flowing channel which protects the city from floods and provides better recreational opportunities
river’s banks are designed to be able to safely overflow in times of heavy rainfall
River can now handle 40% more water than old canal.
why are sustainable management techniques less controversial than other techniques
they aim to balance economic, social + environmental need by working with local people and develop soft engineering projects that work with natural processes to restore water supplies and often involve water conservation.
water management issues can be broken down into 3 sections:
water supply regulation
water qual regulation
moderation of extreme events (flooding + drought)
Sustainable water management- soft engineering+ land management strategies
Reforestation +forest conservation
increase interception= decrease in surface runoff= increase lag time= decrease flooding
Reconnecting rivers to floodplains
sediment deposition increase= building up natural defences e.g. levees (reduce flooding)
Wetland conservation/restoration/construction
increase soil stability from root systems
increase bio diversity + ecology
natural water store
Permeable pavements
increase percolation= increased groundwater stores= replenish aquifers = increase lag time= decrease flooding
Riparian buffers (river banks)
provide natural defences
e.g. grass embankments of river Mersey
Urban green space
reduce surface runoff + increase groundwater stores
increase well being
Singapore’s water issue
pop=6m
receives abundant rainfall but their is limited land for collection + storage of rainfall + high evaporation rates (tropical climate) + lack of groundwater resources + no rivers + salt water encroachment (island) = water scarcity issues
SOLUTION: Singapore national water agency has invested in research + tech to diversify water supply- local water catchments (includes 17 reservoirs) , imported water, recycled water (NEWater) + desalinated water
How is water being sustainably managed in Singapore
| How does scheme work | Pros | Cons |
Catchment areas/ reservoirs | -2/3 surface area partially protected so rainwater can be collected (protected drinking water catchment) | -Abundant ‘free’ water (not reliant on Malaysia)= increase water security -Educate offenders on pollution | -Limited amount of space -Pollution clean-up + enforcement= $ This strategy= too small to solve problem by itself |
Desalination | -5 desalination plants creating 160m gallons per day | -Singapore is an island (seawater abundant) -Relatively wealthy country- can invest in the tech needed | -Energy intensive -Expensive |
NEWater | -Wastewater is treated using microfiltration, reverse osmosis + ultraviolet light disinfection -Most NEWater used in industry or retuned to reservoirs because it isn’t purified for drinking | -Efficient use of wastewater -Significant contribution to supply | -Needs public trust + engagement
|
Conservation | -Campaign/ education program have reduced water consumption from 1651 pppd (2003)- 141 pppd (2019) -Gov no longer subsides water for poorer residents -One of most efficient nations in terms of water use- just 5% lost | -Water use maxed -Relatively cheap | Water= more expensive for poorest -Requires attitude change- people would need to minimise use where they can |
What are Integrated Drainage Basin Managements
According to world bank IDMB aim to establish a framework for coordination whereby all administration and stakeholders involved in river basin planning and management come together to develop an agreed set of policies and strategies. The aim is achieve a balanced and mutually acceptable approach to land, water and natural resources management.
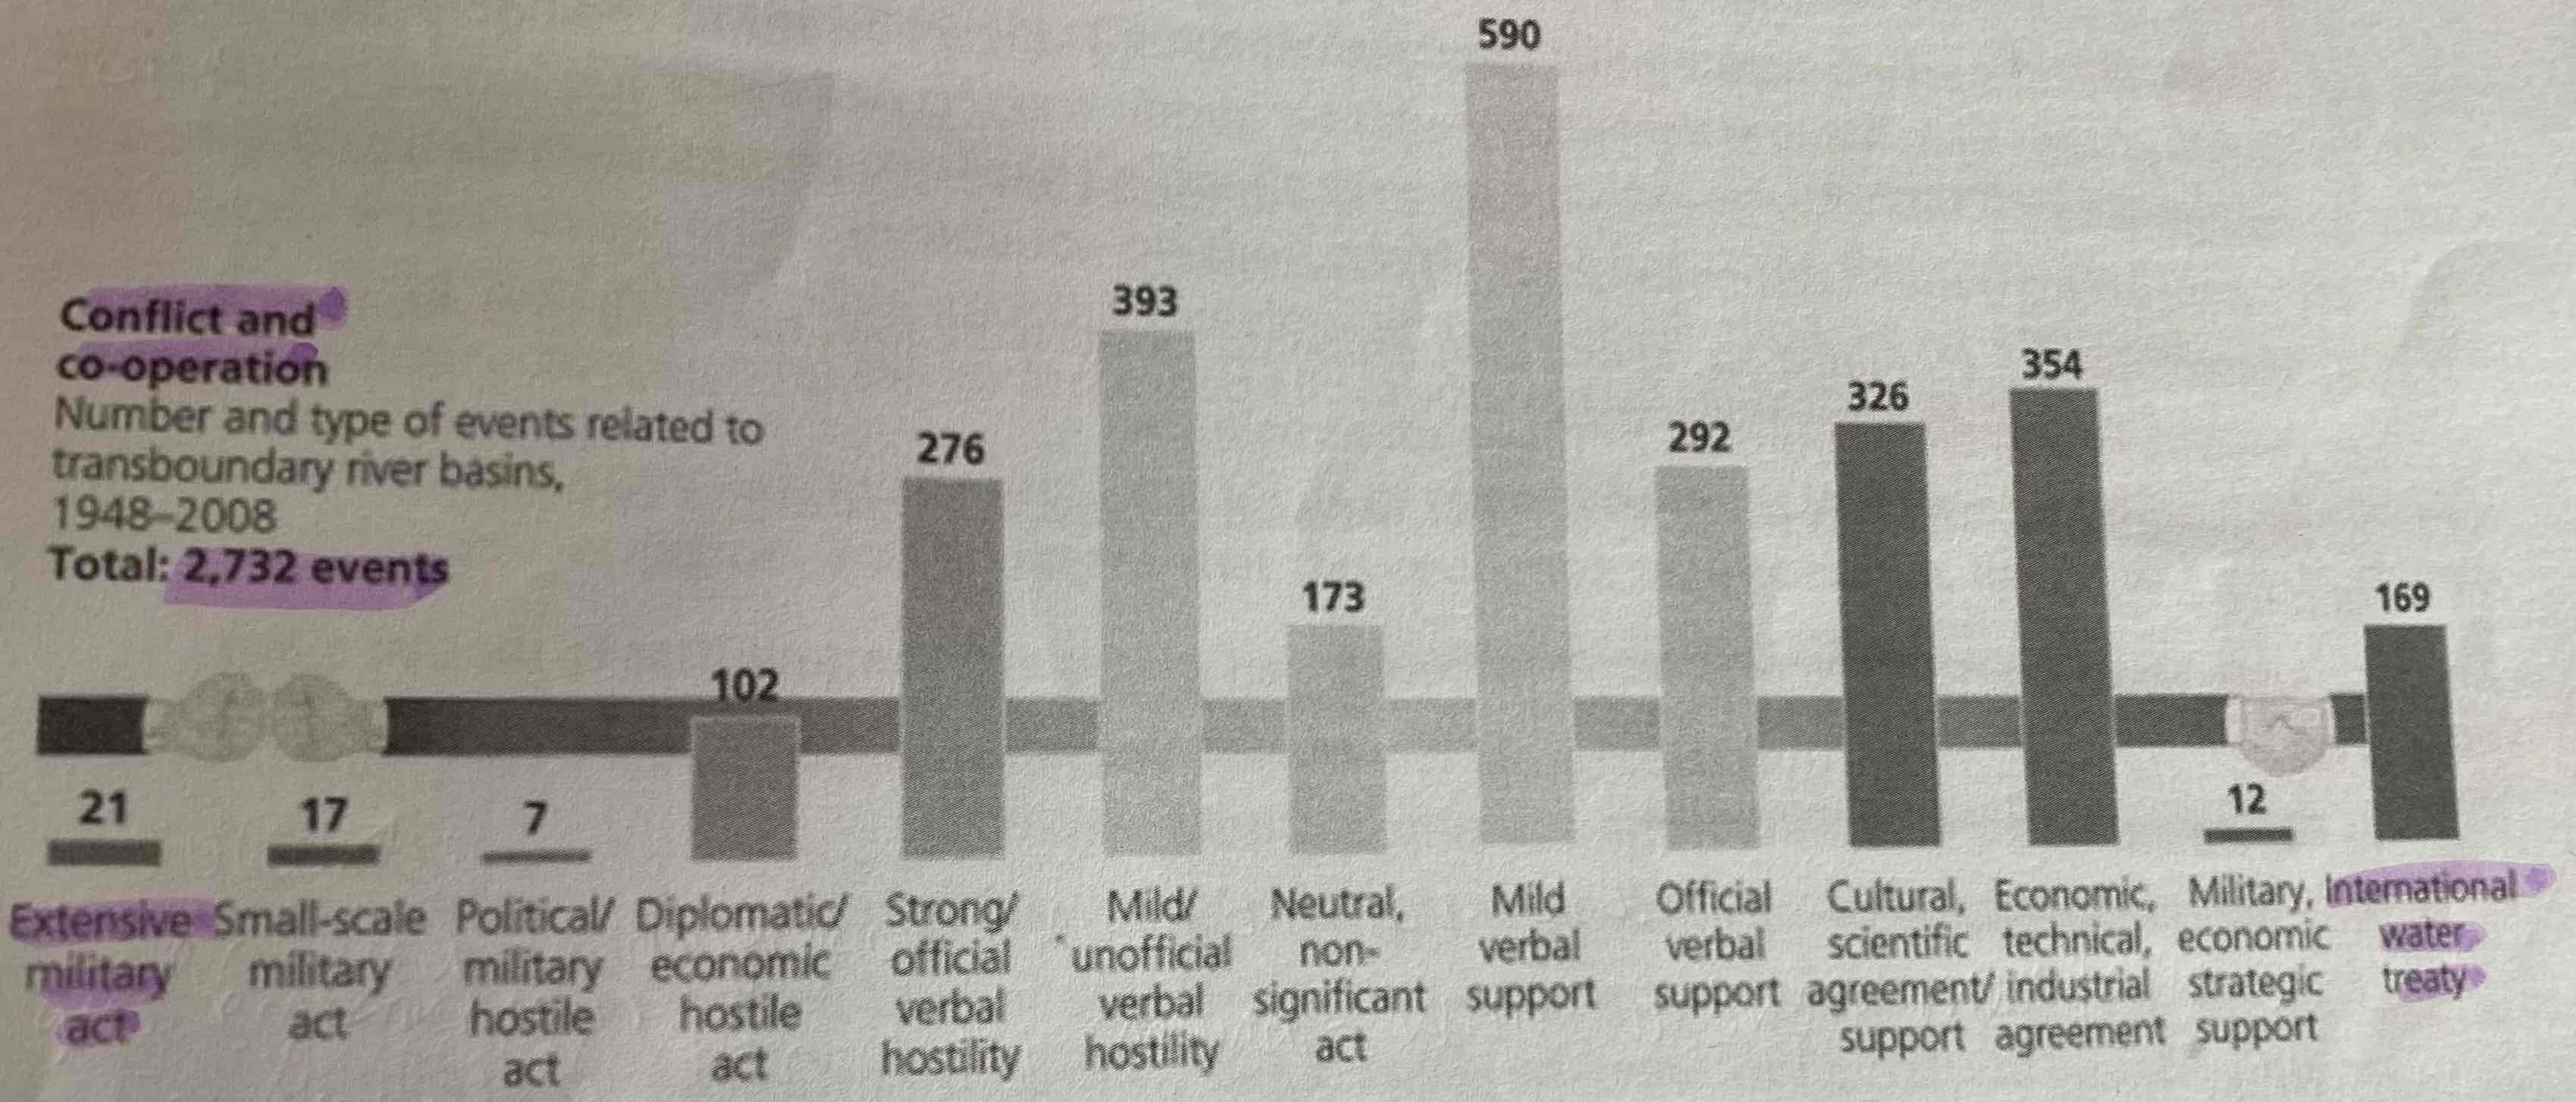
The spectrum of conflict + cooperation
analysis- most common event= mild verbal support/ agreement- this is protective as it doesn’t cause conflict by agreeing/disagreeing and it isn’t written so is less permeant
(more cooperation than conflict)
Water sharing treaties + framework (just be aware of vibe of them)
The Helsinki rules
international guideline regulating hoe rivers and their connecting groundwaters that cross national boundaries may be used
Treaties must include concepts such as equitable use + equitable shares
+ share should be based on factors such as: natural factors, social + economic needs, downstream impact, dependency, prior use, efficiency
The Berlin rule
replace Helsinki rules + have 9 water management principles
Participatory water management (involve public), coordinated use, integrated management, sustainability, minimisation of environ harm, cooperation over shared water resources, equitable utilisation of shred water sources, avoidance of transboundary harm, equitable participation
ANALYSIS:
participatory water management= more democratic but 🕑 consuming
Berlin rules=more dissolved decision making (involve public) + more focus on sustainability, focus on internal as well as international water management
overall strength= objective framework provided
Overall limitation- somewhat nebulous e.g. equitable use is debatable (too cloudy + basic