Ch2: Variables and Graphics
1/6
There's no tags or description
Looks like no tags are added yet.
Name | Mastery | Learn | Test | Matching | Spaced | Call with Kai |
|---|
No analytics yet
Send a link to your students to track their progress
7 Terms
What are the 2 types of data?
Categorical (aka class) variables
Numerical ( aka quantitative) variables
What are 2 (sub)types of categorical variables?
Ordinal (in order) variables = if the different categories have an inherent order to them.
Nominal variables = if no inherent order to categories
What are 2 (sub)types of numerical variables?
Discrete = can be counted (# of limbs, offspring, etc.)
Continuous = can be measured (arm length, height, etc.)
When do you use bar graphs?
When showcasing discrete (categorical) variables
When do you use histograms?
When showcasing continuous variables
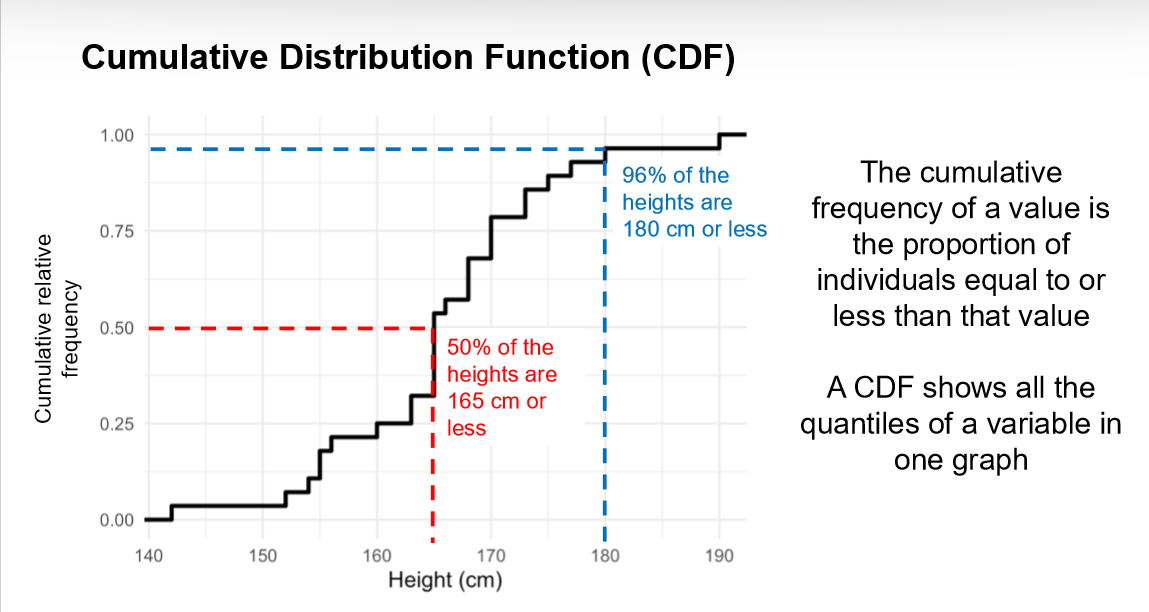
What is a quantile?
A value that divides a sorted dataset or probability distribution into equal-sized, continuous intervals, representing the proportion of the data.
→ quartiles = four different parts.
→ represented from 0-1
What is a percentile?
a measure used to show what percentage of values/scores in the dataset fall below a specific point, indicating points relative standing.
→ good to use for CDFs