Handout 9a: Box & whisker plot
1/8
There's no tags or description
Looks like no tags are added yet.
Name | Mastery | Learn | Test | Matching | Spaced |
|---|
No study sessions yet.
9 Terms
How do you de-skew data?
If very skewed to right/left & want to de-skew
→ can take the square root of all values
→ can take the log of all values

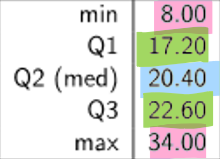
What is the 5 number summary to build a box & whisker plot?
min value
Q1
Q2 - Median
Q3
max value
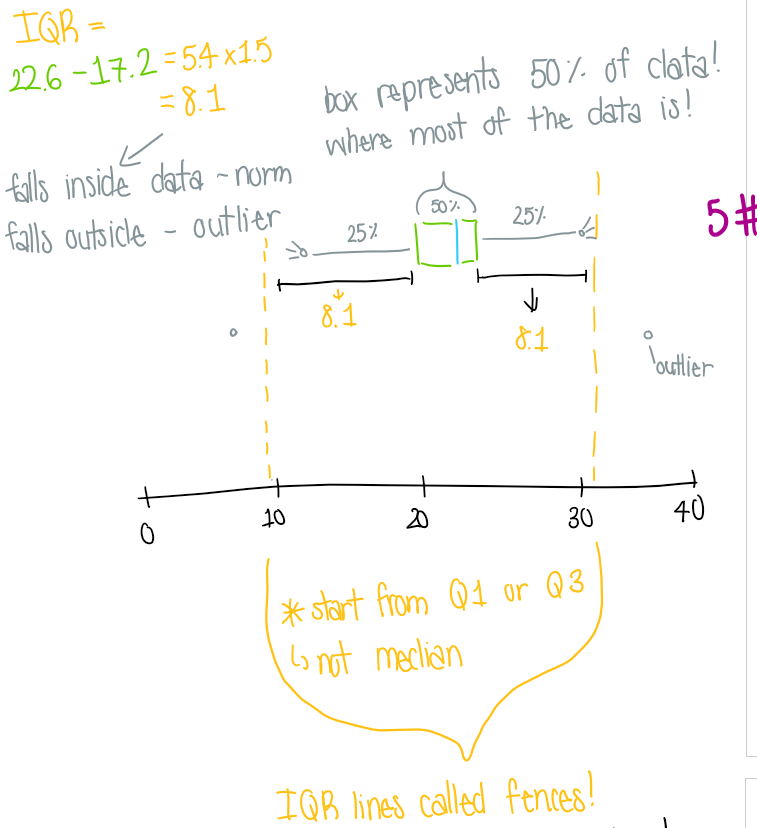
How do you build a box & whisker plot using the 5 number summary?
Median - Draw a vertical line as the median
Q1 & Q3 - Draw lines around the median to represent Q1 & Q3 and connect these lines to create a box (50% of data)
IQR - Find the IQR to be the fences (subtract IQR from median & add IQR to median to determine)
The whiskers are the biggest & smallest values that fit within the fences (25% of the data)
Any data outside of the fences are outliers! (max & min values)
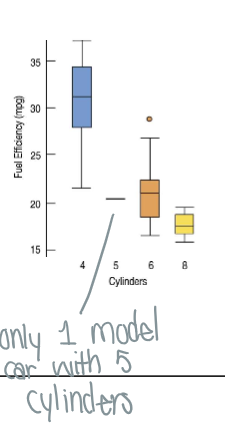
What does it mean when a box & whiskers plot displays only a line?
There is only one data point for the variables
What is the 0th & 100th percentile?
0th percentile = minimum
100th percentile = maximum
50th percentile = Q2 (median)
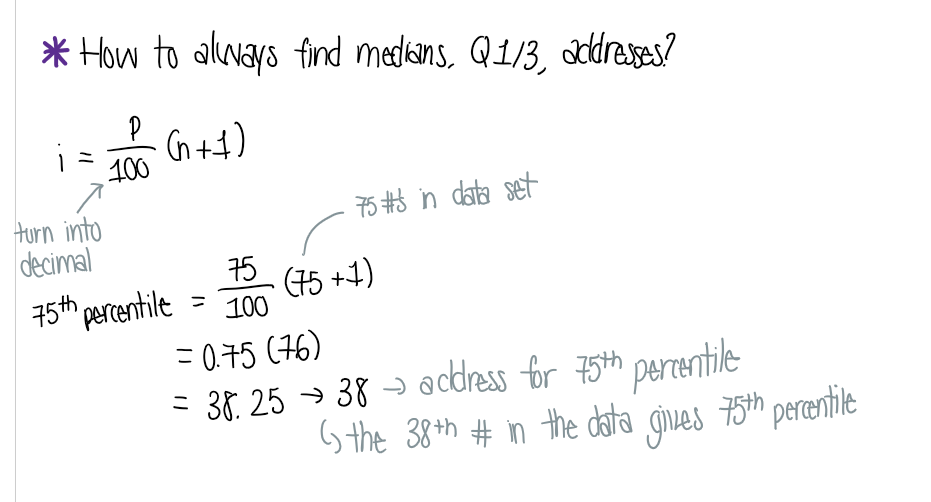
What is the formula for computing percentile?
Must sort data from lowest to highest first
Using the formula will give you the address for the percentile in question
The 38th number in the data set gives you the 75th percentile!
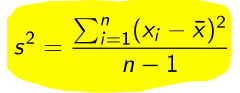
What is the formula for the variance?
Variance = s²
depends on units
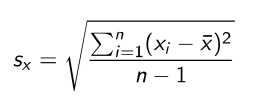
What is the formula for the standard deviation?
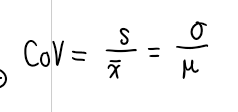
What is the coefficient of variation?
Variation relative to the mean
unitless