Financial Analysis Final
1/120
There's no tags or description
Looks like no tags are added yet.
Name | Mastery | Learn | Test | Matching | Spaced |
|---|
No study sessions yet.
121 Terms
Accounting
“The process of identifying, measuring, and communicating economic information for informed judgments and decisions by the users of the information” - American Accounting Association
“A process that helps a business measure its profitability and solvency” - Language of business
Process of identifying, measuring, and communicating economic information to permit informed judgements and decisions by the user’s information. A process that helps a business measure its profitability and solvency
Types of Accounting
Bookkeeping
Financial Accounting
Managerial Accounting
Tax Accounting
Bookkeeping
The systematic collection of financial information.
Financial Accounting
Involves cash flow, balance sheet, and income statement.
Managerial Accounting
Provides strategic information, including budget and competition analysis.
Tax Accounting
Focuses on the taxes a company must pay.
Types of businesses according to the purpose or objective of the organization
Profit Making
Non-for-profit
Governmental
Profit Making
Businesses that offer goods or services to generate income for owners (individual or stockholders)
Non-for-profit
Organizations that provide goods or services without the expectation of generating income
Governmental
Agencies that belong to the state and serve public interests.
Characteristics of the forms of business organizations
Individual
Partnership
Corporation
Individual Business
An unincorporated business owned and managed by a single person.
Partnership
An unincorporated business owned by two or more individuals.
Corporation
A business incorporated under state laws, recognized as a separate legal entity.
According to the types of activities performed by business organizations
Service companies
Merchandising companies
Specialized sectors
Service Companies
Businesses that perform services for a fee.
Merchandising Companies
Businesses that purchase goods for resale.
Specialized Sectors
Industries such as financial services, agriculture, and mining.
Primary objectives of any business
Profitability
Solvency
Profitability
The ability of a business to generate income.
Solvency
The ability of a business to pay its debts as they become due.
Assets (property)
Inventory, cash property of the company
Current Assets
Fixed Assets
Current Assets
Inventory, cash, banks (Activos circulantes, se pueden convertir en dinero mas rapido)
Fixed Assets
Buildings, estate, trucks (activo no circulante)
Liability
Short-term liabilities: Proveedores, cuentas (Deudas a pagar en menos de un año
Long-term liabilities: Cuentas por pagar
Equity
Equity refers to the ownership value in an asset after all liabilities have been deducted. (Dinero de reserve)
The four basic financial statements
balance sheet
income statement
statement of cash flows
statement of retained earnings
Balance Sheet
A financial statement that lists a company's assets, liabilities, and equity at a specific time.
Income Statement
A report showing a business's profitability over a specific period, also known as a profit and loss statement
Statement of Cash Flows
A report detailing cash inflows and outflows from operating, investing and financing activities
Statement of Retained Earnings
Connects the balance sheet and income statement, showing changes in equity (shows the difference between net income and dividends paid to stockholders
Business Entity
A business organization that exists as an economic unit
A business organization that has an existence of its own, separate from its owners, creditors, etc.
A set of resources with a common goal that is achieved through a decision-making process
Financial Analysis
The process of reviewing financial performance to assess viability, stability, and profitability of a company
Involves breaking down financial data into meaningful insights using financial ratios, trends and forecasts
Determine how well an organization is performing, identify areas for improvement, and predict future financial outcomes
Financial Analysis Provides
Decision making
Performance evaluation
Investment Assessment
Risk management
Strategic planning
Decision making
Financial Analysis gives a foundation for making strategic business decisions, such as whether to invest in a company, expand operations, or cut costs |
Performance evaluation
It helps assess the effectiveness of an organization’s management and operational strategies by comparing financial performance against industry benchmarks or historical data |
Investment Assessment
Inventors use financial analysis to determine whether a campany’s stock is undervalued or overvalued, guiding their investment preferences |
Risk Management
By identifying financial risks and vulnerabilities, financial analysis aids risk management strategies and helps mitigate potential losses |
Strategic Planning
It assists in formulating long-term strategies by forecasting future financial conditions and evaluating the potential impacts of different business decisions |
Key components of financial analysis
Financial statements
Financial ratios
Financial planning and forecasting
Investment analysis
Cost management
Financial statements
Financial statements are the primary sources of data for financial analysis
They provide a picture of a company’s financial health and performance over time
Main Financial Statements
Income statement (profit & loss statement)
Balance sheet (statement of financial postion)
Cash flow statement
Statement of changes in equity
Income statement (profit & loss statement)
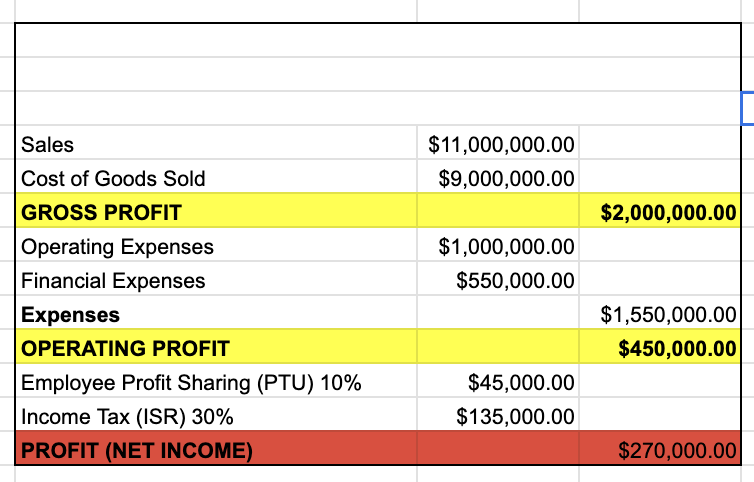
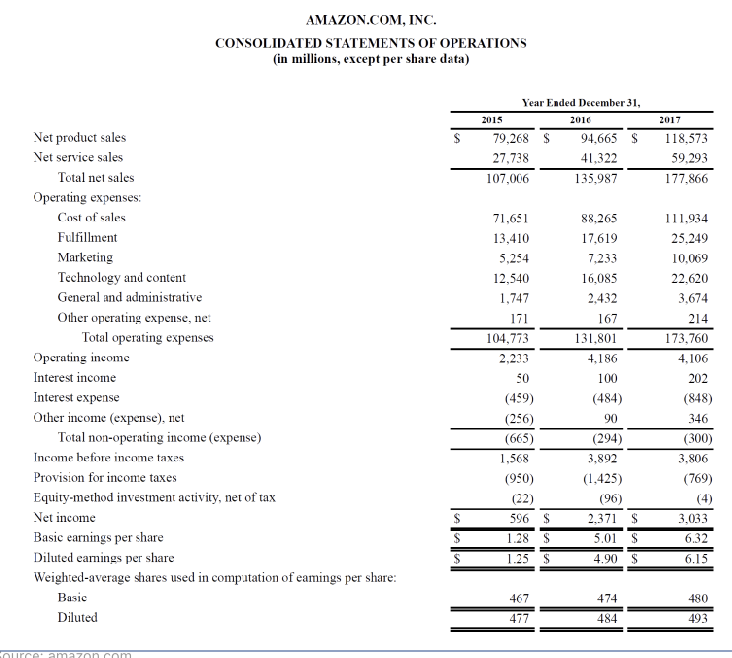
The income statement, also known as the profit & loss statement, is a vital financial document that summarizes a company’s revenue, expenses, and profits or losses over a specific period
It provides insights into the organization’s operational efficiency and profitability
Example of income statement
Balance Sheet
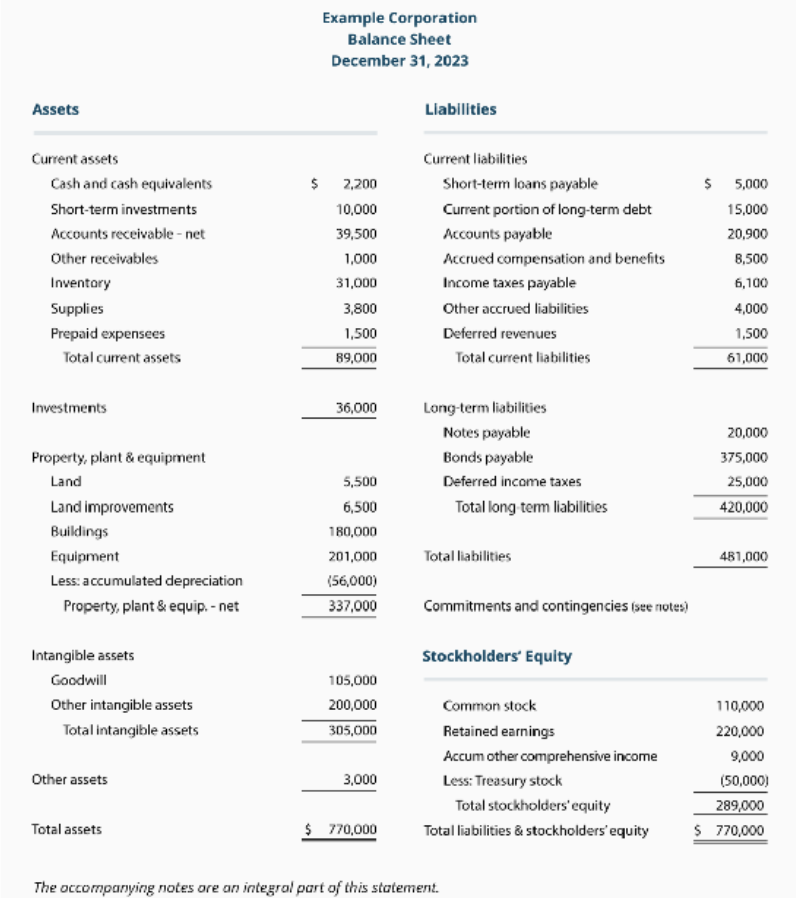
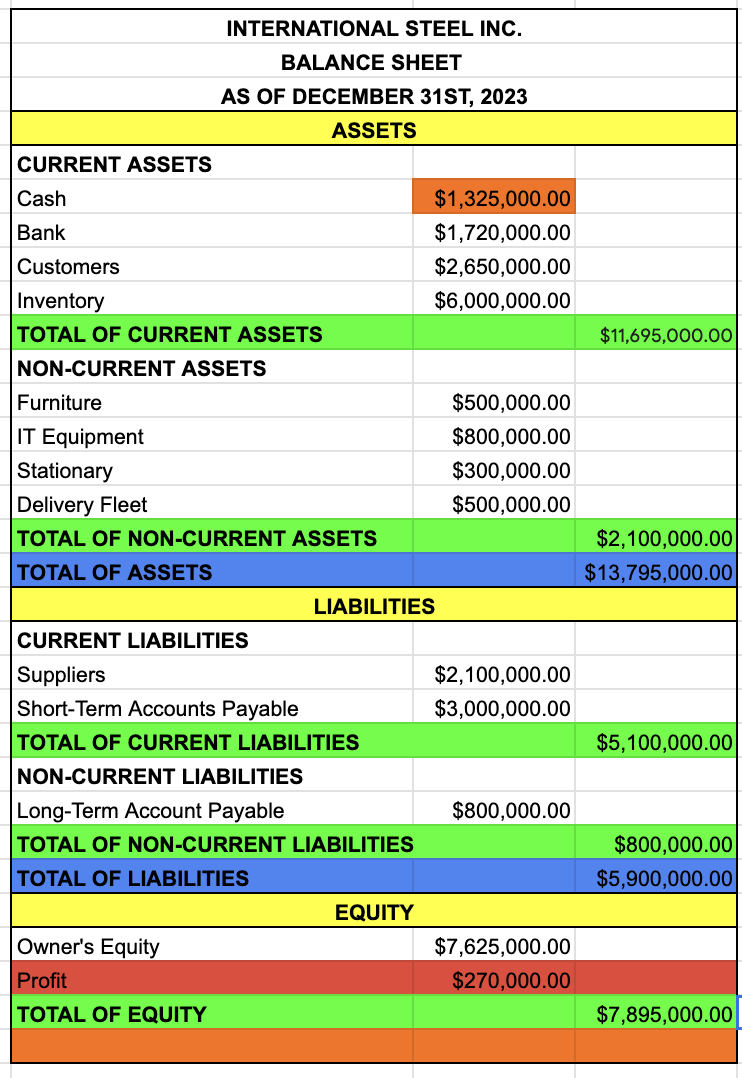
Also known as the statement of financial position, gives a snapshot of a company’s financial health at a specific point in time (it is usually a year)
Example of Balance sheet
Cash flow statement
Financial statement that gives a detailed summary of how cash flows into and out of a company over a specific period. It is one of the core financial statements, along with the Balance Sheet and Income Statement, and offers valuable insights into an organization’s liquidity, solvency, and overall financial health
3 segments:
Operating activities: Shows cash flows for the enterprise’s core business operations. It includes cash received from customers and cash paid to suppliers and employees
Investing activities: These activities include cash flows related to the acquisition and disposal of long-term assets
Financing activities: These activities cover cash flows associated with the company’s capital structure and financial decisions
Statement of changes in equity
Also knwon as the statement of stockholders’ equity or statement of retained earnings, they deliver a detailed account of the changes in an organization’s equity over a specific period
It captures how various transactions affect the owner’s equity, helping stakeholders understand movements in the components of equity
4 sections:
Opening balances: Reflects the equity balances at the beginning of the reporting period
Additions: This part details transactions that increase equity
Deductions: Transactions that decrease equity
Closing balances: Equity balances at the end of the reporting period, after all additions and deductions have been accounted for
Financial Ratios
Tools used to analyze an organization’s financial performance and stability, they provide insights into several aspects of a company’s profitability, liquidity, solvency, efficiency, and leverage
Are generally dervied from the financial statements: the balance sheet, the income statement, and the cash flow statement
Profitability Ratios
Metrics evaluating a company's ability to generate profit relative to revenue or assets. Help stakeholders understand how well a company is performing in terms of profit generation and are vital for assessing the financial health of a business
Gross Profit Margin
It measures the percentage of revenue that surpasses the cost of good sold (COGS)
Operating Profit Margin
It measures the percentage of revenue remaining after covering operating expenses but before interest and taxes
Net Profit Margin
It measures the percentage of revenue remaining after all costs, including interest, taxes, and operating cost
Return on Assets (ROA)
It measures how efficiently an organization uses its assets to generate profit
Return on Equity (ROE)
It measures the return on shareholders’ equity and indicates how effectively management is using shareholders’ resources
Liquidity Ratios
Measure an organization’s ability to meet short-term obligations and are essential for assessing financial health, reflect the company’s capacity to transform assets into cash to cover liabilities
Current Ratio
It measures an organization’s ability to pay short-term liabilities with short-term assets (cash, security, rent)
Quick Ratio (Acid-Test Ratio)
The quick ratio assesses an organization’s ability to meet short-term liabilities without relying on inventory sales
Cash Ratio
The cash ratio evaluates an organization’s ability to pay off short-term liabilities with cash and cash equivalents
Net Working Capital Ratio
The net working capital ratio measures the amount of liquid assets available after paying current liabilities
Solvency Ratios
Assess an organization’s ability to meet long-term obligations and assess its overall financial stability. These ratios help investors and creditors understand whether an enterprise can sustain operations over the long term and manage its debt
Equity Ratio
The equity ratio measures the proportion of a company’s assets that are financed by shareholders equity. It reflects the percentage of assets funded by equity
Efficiency Ratios
Measure how effectively a company uses its assets to generate revenue.
Asset Turnover Ratio
The asset turnover ratio measures how efficiently an organization uses its assets to generate sales revenue
Inventory Turnover Ratio
The inventory turnover ratio measures how many times an enterprise’s inventory is sold and replaced over a period
Leverage Ratios
Assess the degree to which a company relies on borrowed resources.
Debt-to-Assets Ratio
Like the debt ratio, this metric provides insight into the proportion of total assets financed through debt, highlighting the extent of financial leverage
Generation of Financial Information
The process of creating and compiling financial data and reports for decision-making, analysis, and communication within an organization or to external stakeholders
Typically involves collecting, processing, and presenting financial data in a structured format
What involves generating financial information?
Compliance and audit
6 stages to be created:
Data collection
Data processing
Report generation
Analysis and Interpretation
Communication
Data Collection
The first stage in generating financial information, involves source identification and verification.
Source Identification: Identifying and gathering data from various sources, such as financial transactions, accounting records, and operational data
Data Entry: Recording financial transactions into accounting systems or spreadsheets
Verification: Ensuring the accuracy and completeness of the collected data
Data Processing
Involves classification, aggregation, and analysis of financial data.
For it is important to follow this order:
Classification: Sorting data into categories like revenue, expenses, assets, and liabilities
Aggregation: Summarizing data to form financial statements and reports
Analysis: Applying accounting principles and methods to process data (ex. adjusting entries, accruals)
Report Generation
The creation of financial statements and management reports.
For report generation financial experts elaborate:
Financial Statements:
Income statement: Summarizes revenue, expenses, and profits over a period
Balance Sheet: Provides a snapshot of assets, liabilities, and equity at a specific date
Cash Flow Statement: Shows cash inflows and outflows from operating, investing, and financing activities
Management Reports:
Detailed reports for internal use, such as budget vs. actual performance, variance analysis, and departmental financial performance
External Reports:
Annual Reports: Comprehensive reports for shareholder and the public, often including statements, management discussion, and analysis
Regulatroy Fillings: Reports required by regulatory bodies, such as SED filings for public companies
Analysis and Interpretation
Involves financial analysis, ratio analysis, and forecasting.
Financial Analysis
Ratio analysis: Calculating financial ratios (ex. liquidity, profitability) to asses performance
Trend analysis: Analyzing historical data to identify patterns and trends
Variance analysis: Comparing actual performance to budgeted figures to understand deviations
Forecasting
Budgeting: Creating financial plans and projections for future periods
Scenario Planning: Developing different financial scenarios based on varying assumptions
Communication
Sharing financial information internally and externally.
A crucial aspect in generating financial information is how well it is communicated, there are two types of communications:
Internal Communication: Sharing financial information with management and staff to support decision-making and operational planning
External Communication: Presenting financial information to investors, regulators, and other stakeholders through formal reports and disclosures
Compliance and Audit
Ensuring adherence to standards and verifying accuracy of financial information.
Financial information must have:
Compliance: Ensuring that financial information adheres to accounting standards and regulatory requirements
Audit: Reviewing financial information to verify accuracy and completeness, often performed by external auditors
Different tools and techniques to generate financial information
Three very important are:
Accounting software
Spreadsheet software
Data visualization tools
Accounting Software
Tools used for managing financial data and reports.
Spreadsheet Software
Applications for organizing and analyzing financial data.
Data Visualization Tools
Software that helps present financial data in a visual format.
name of the company
BALANCE SHEET
date
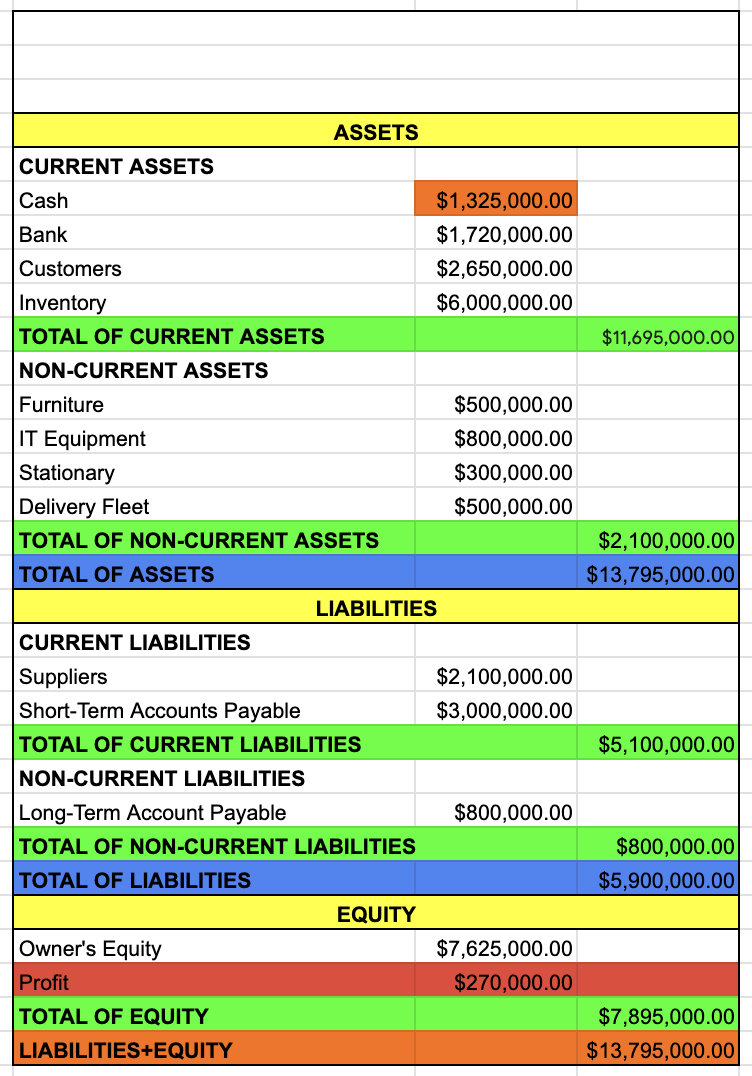
ASSETS
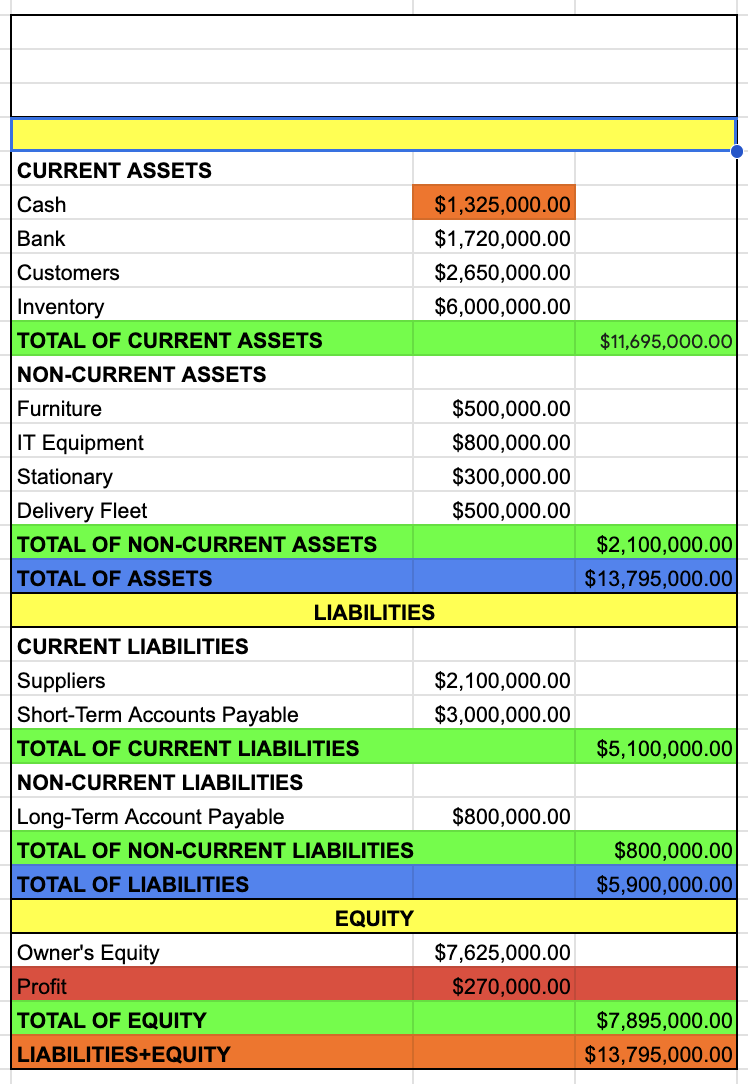
CURRENT ASSETS
CASH
BANK
CUSTOMERS
INVENTORY
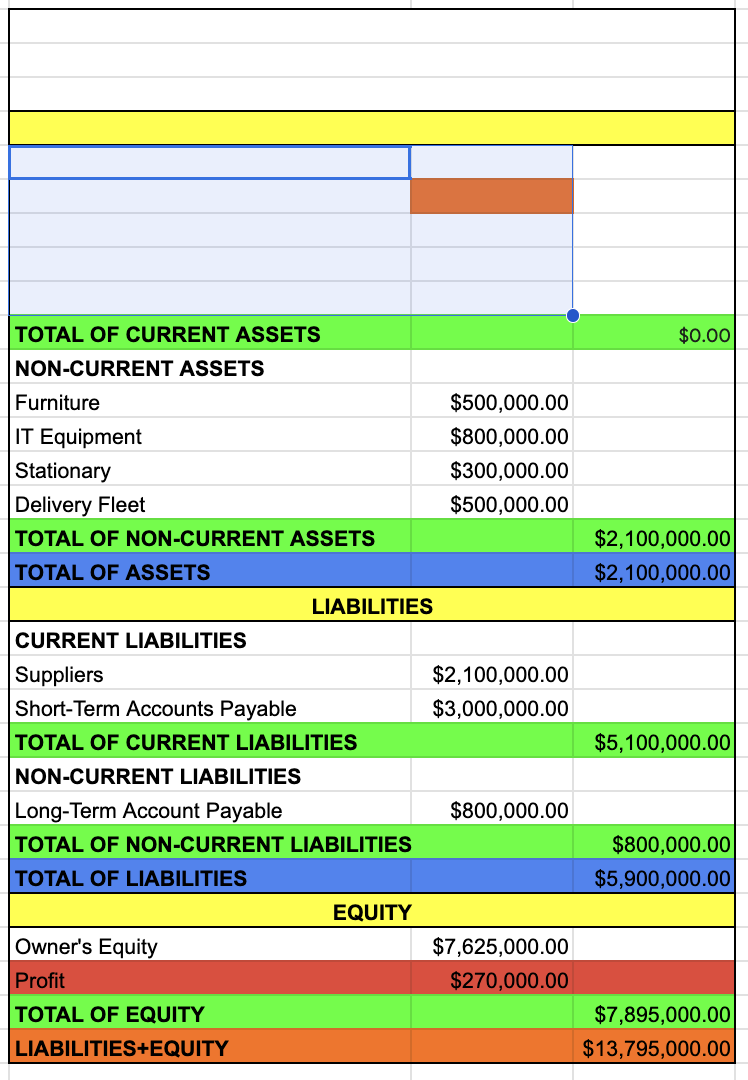
TOTAL OF CURRENT ASSETS
CASH + BANK + CUSTOMERS + INVENTORY
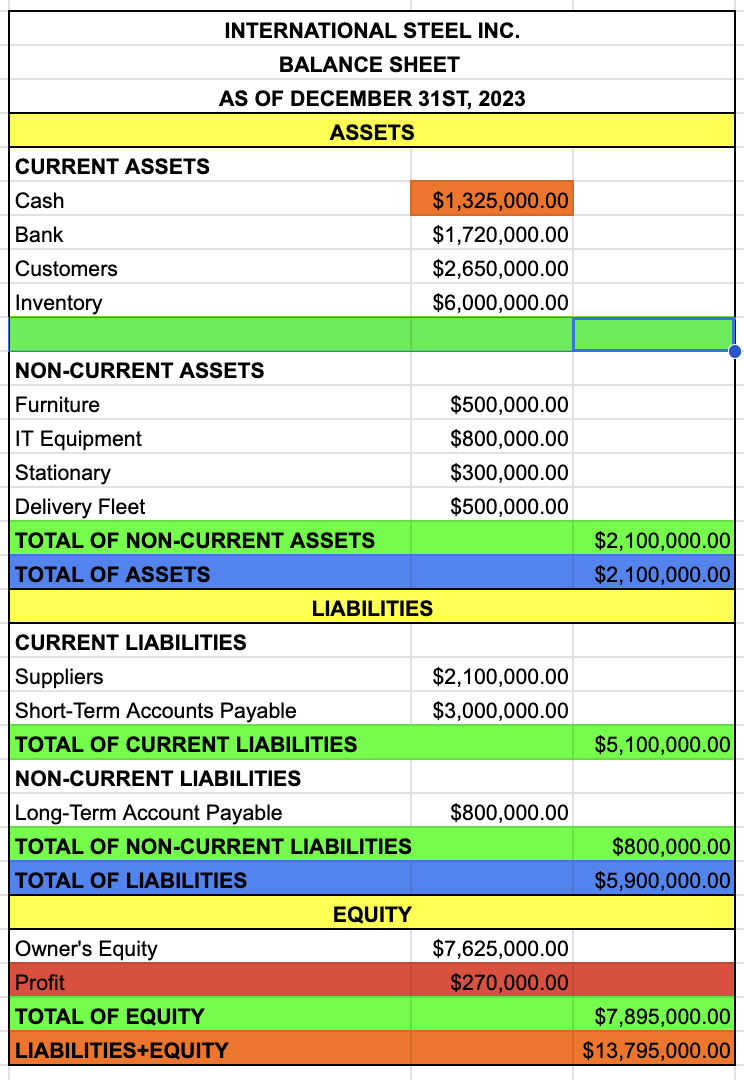
NON-CURRENT ASSETS
FURNITURE
IT EQUIPMENT
STATIONARY
DELIVERY FLEET
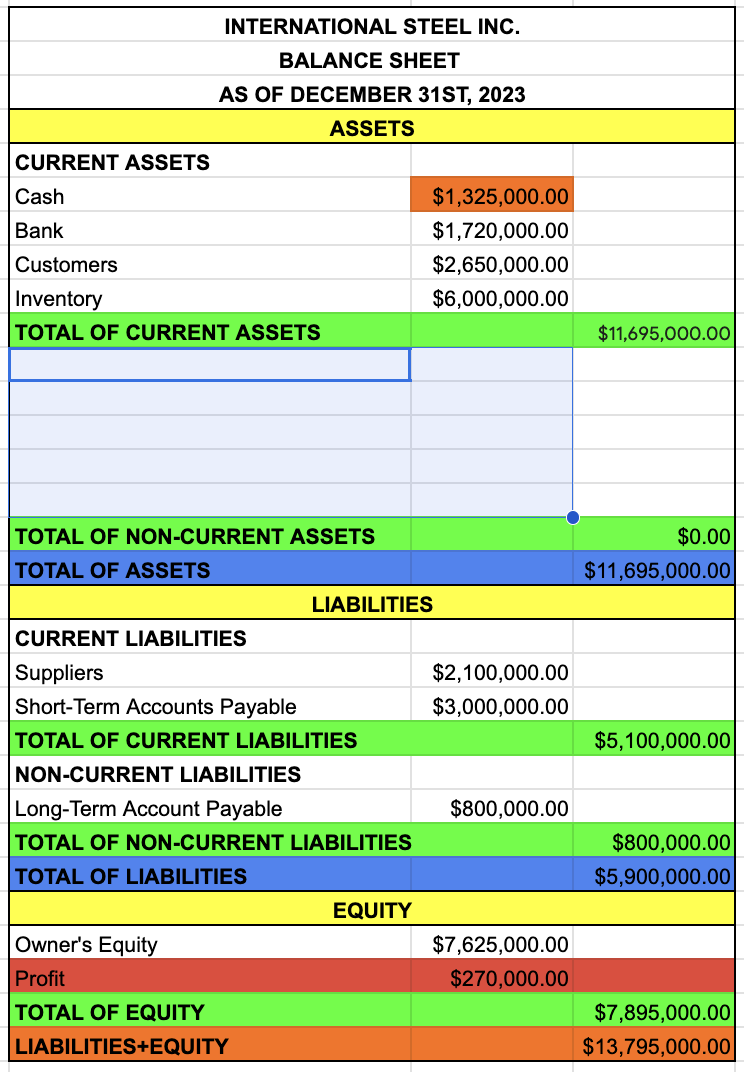
TOTAL OF NON-CURRENT ASSETS
FURNITURE + IT EQUIPMENT + STATIONARY + DELIVERY FLEET
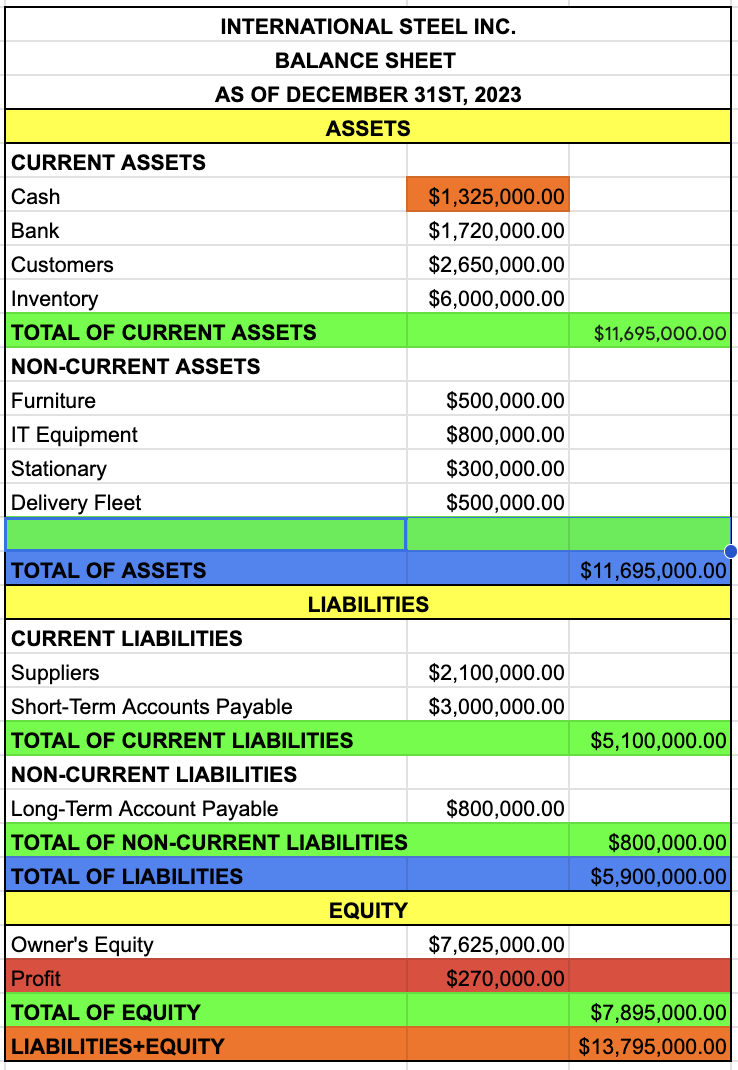
TOTAL OF ASSETS
TOTAL OF CURRENT ASSETS + TOTAL OF NON-CURRENT ASSETS
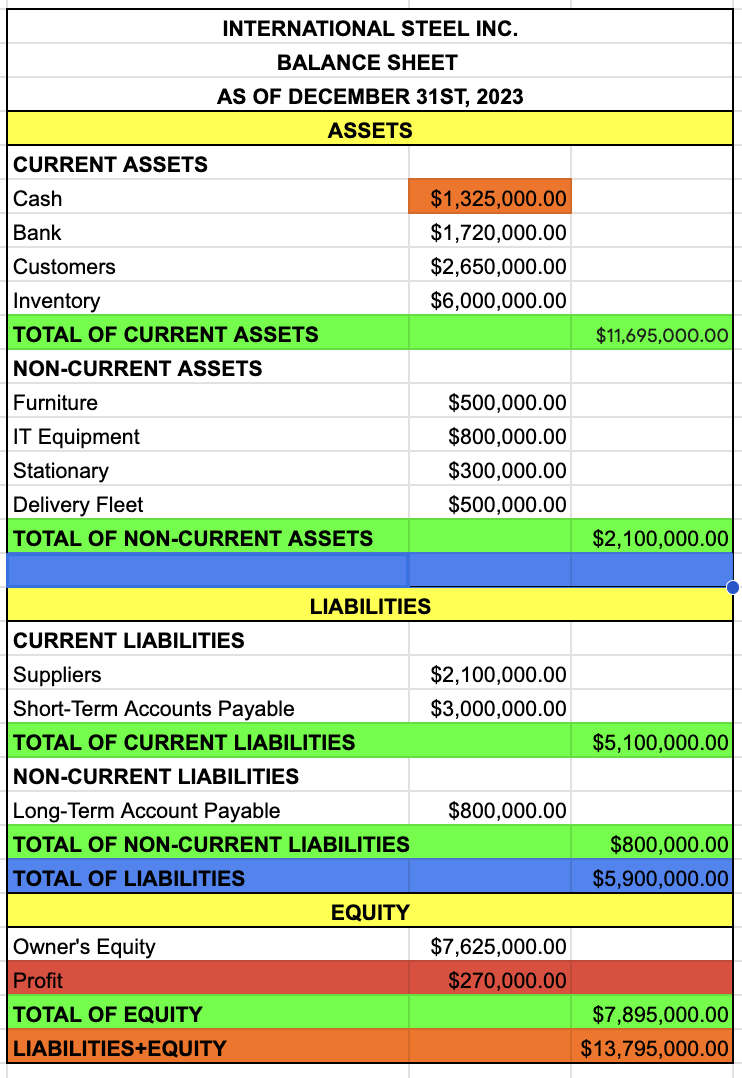
LIABILITIES
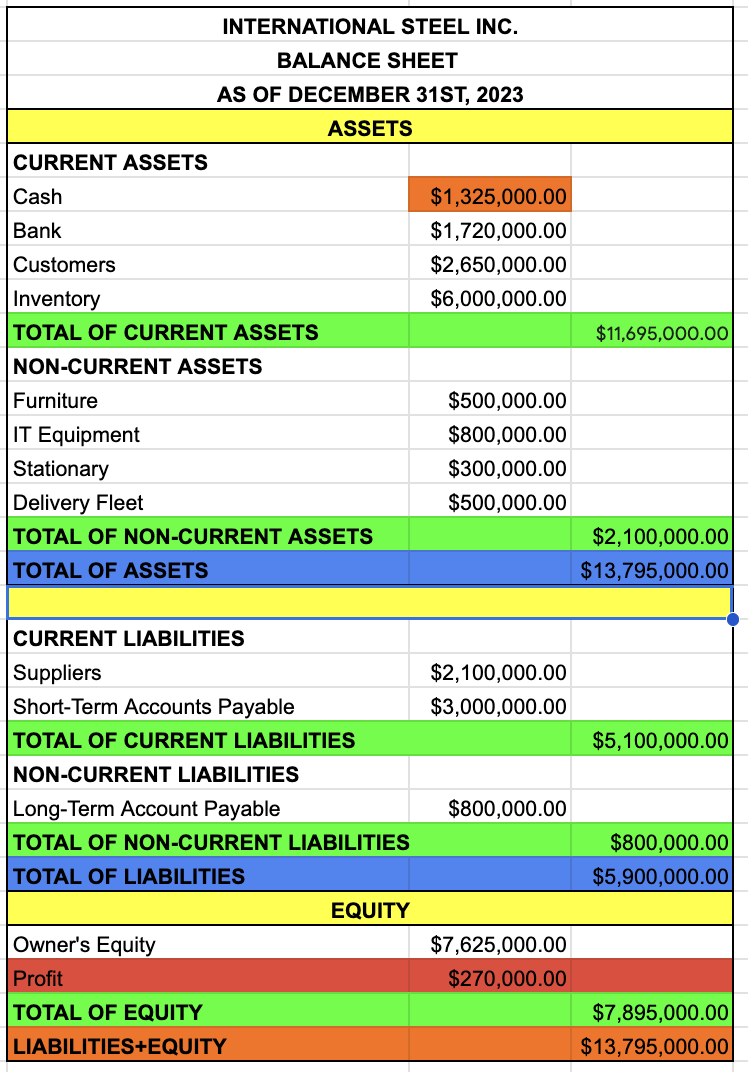
CURRENT LIABILITIES
SUPPLIERS
SHORT-TERM ACCOUNTS PAYABLE
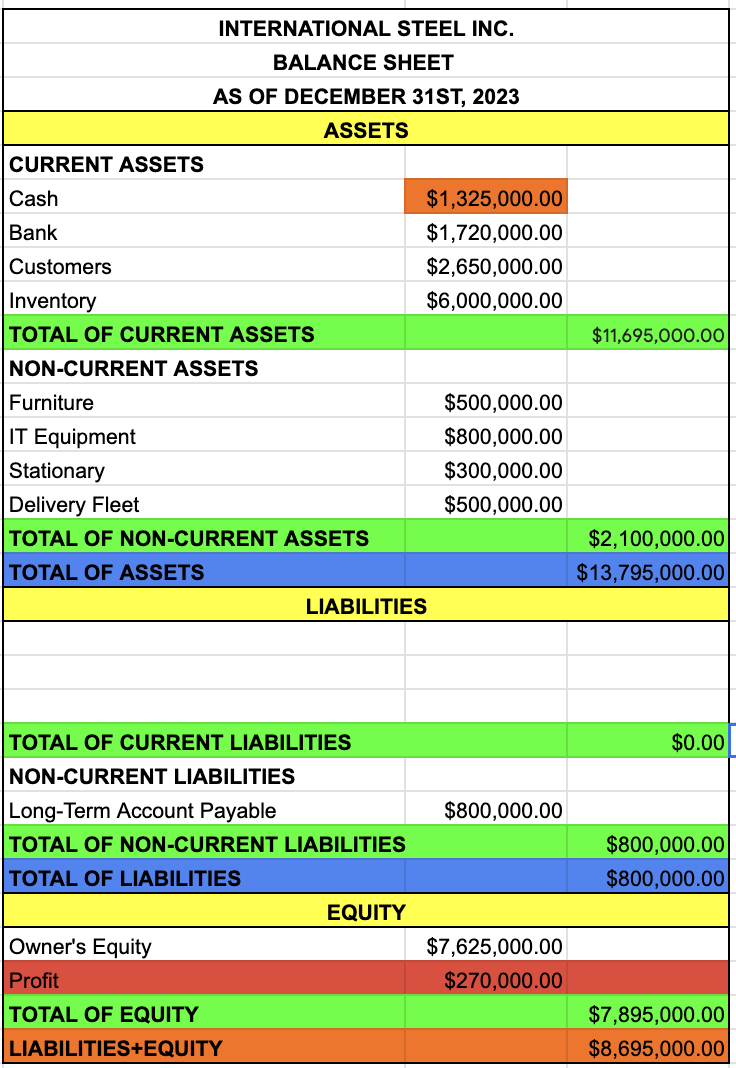
TOTAL OF CURRENT LIABILITIES
SUPPLIERS + SHORT TERM ACCOUNTS PAYABLE
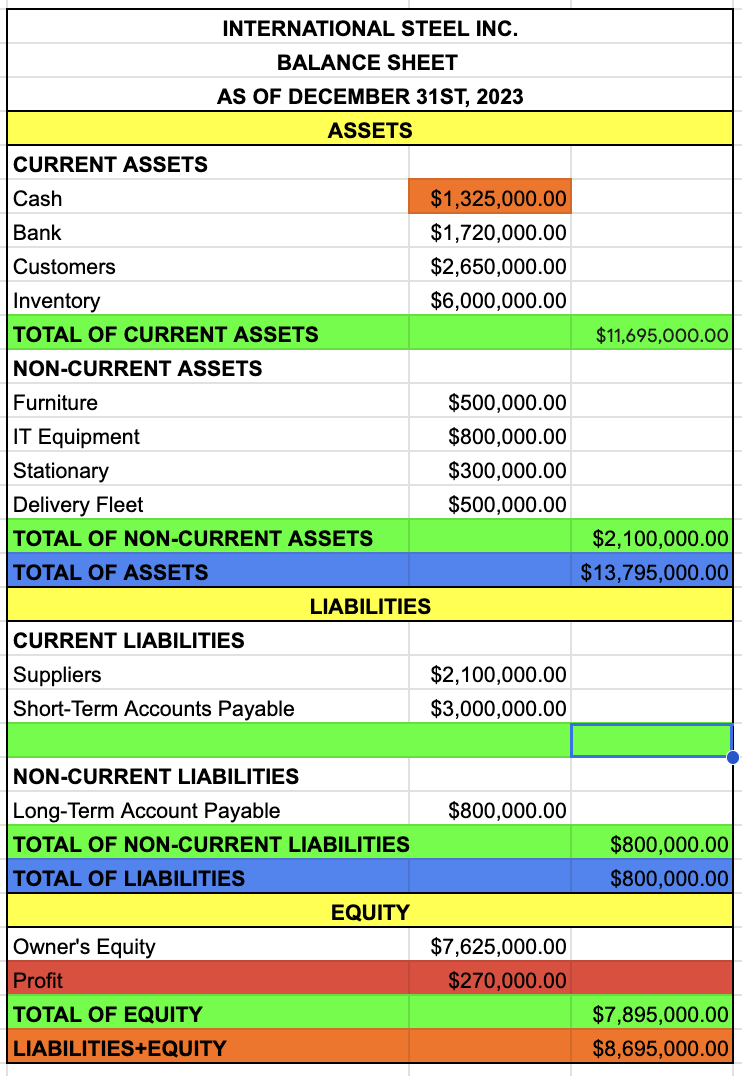
NON-CURRENT LIABILITIES
LONG-TERM ACCOUNT PAYABLE
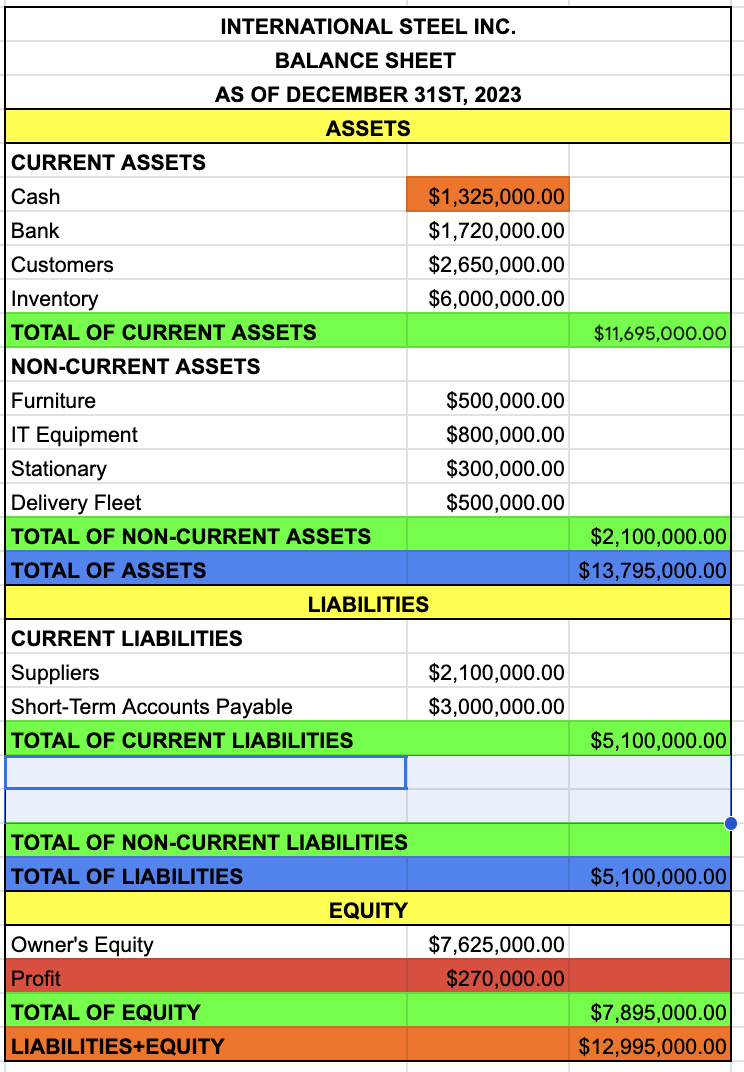
TOTAL OF NON-CURRENT LIABILITIES
LONG-TERM ACCOUNT PAYABLE
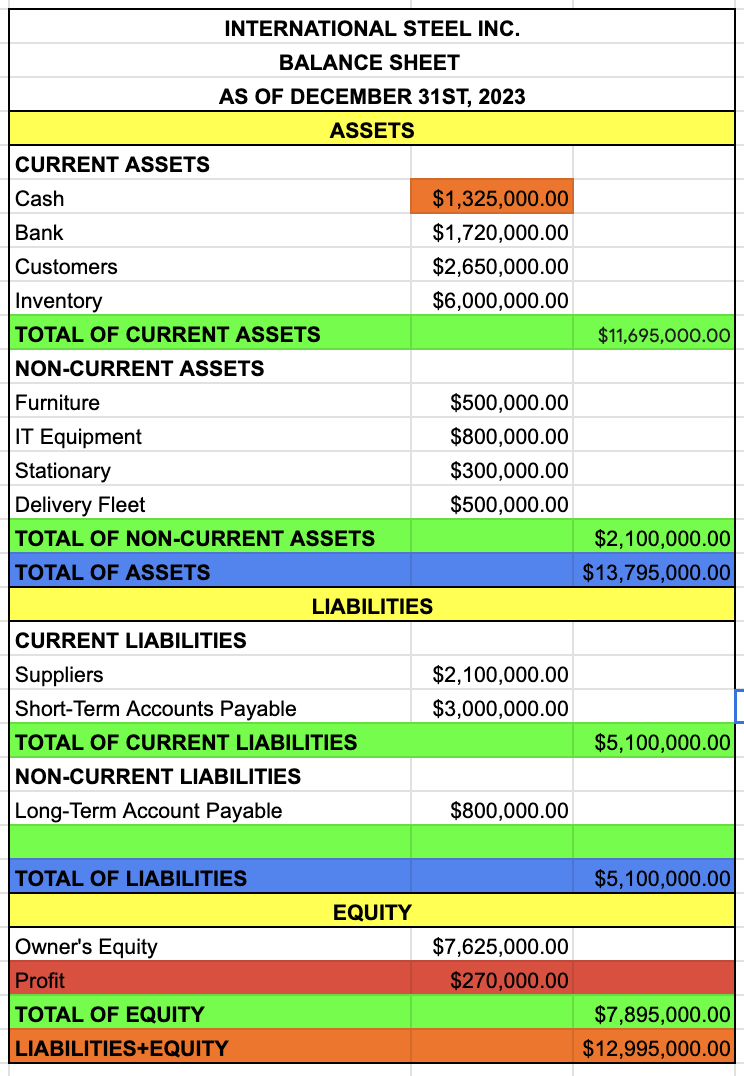
TOTAL OF LIABILITIES
TOTAL OF CURRENT LIABILITIES + TOTAL OF NON-CURRENT LIABILITIES
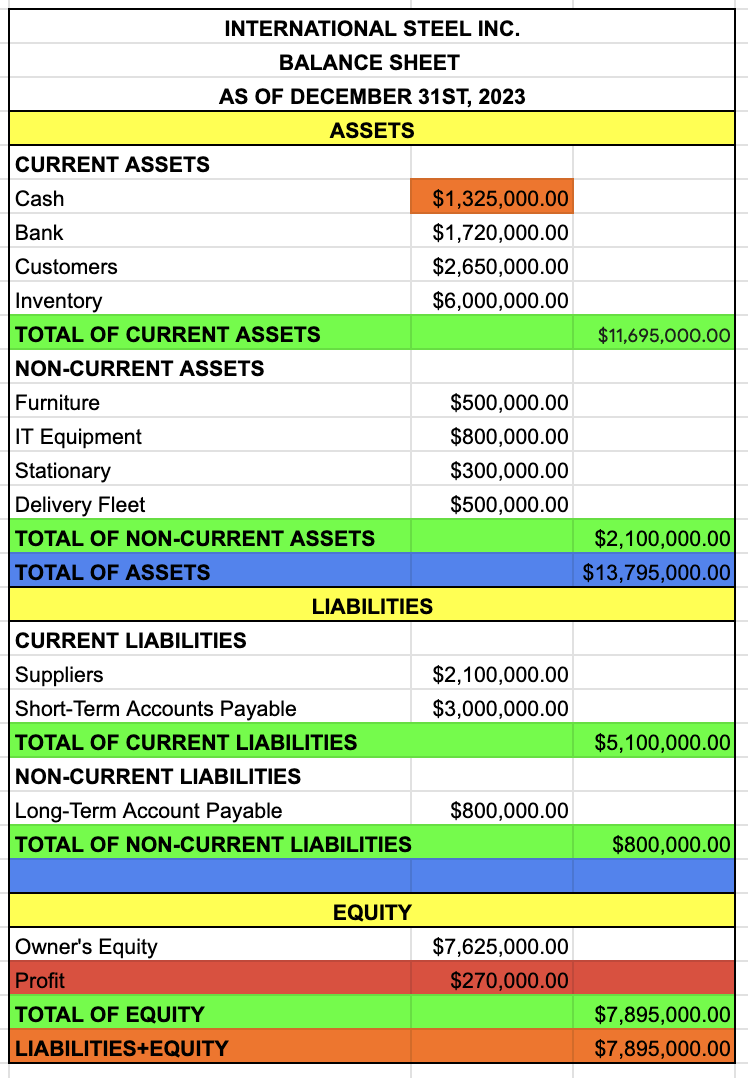
EQUITY
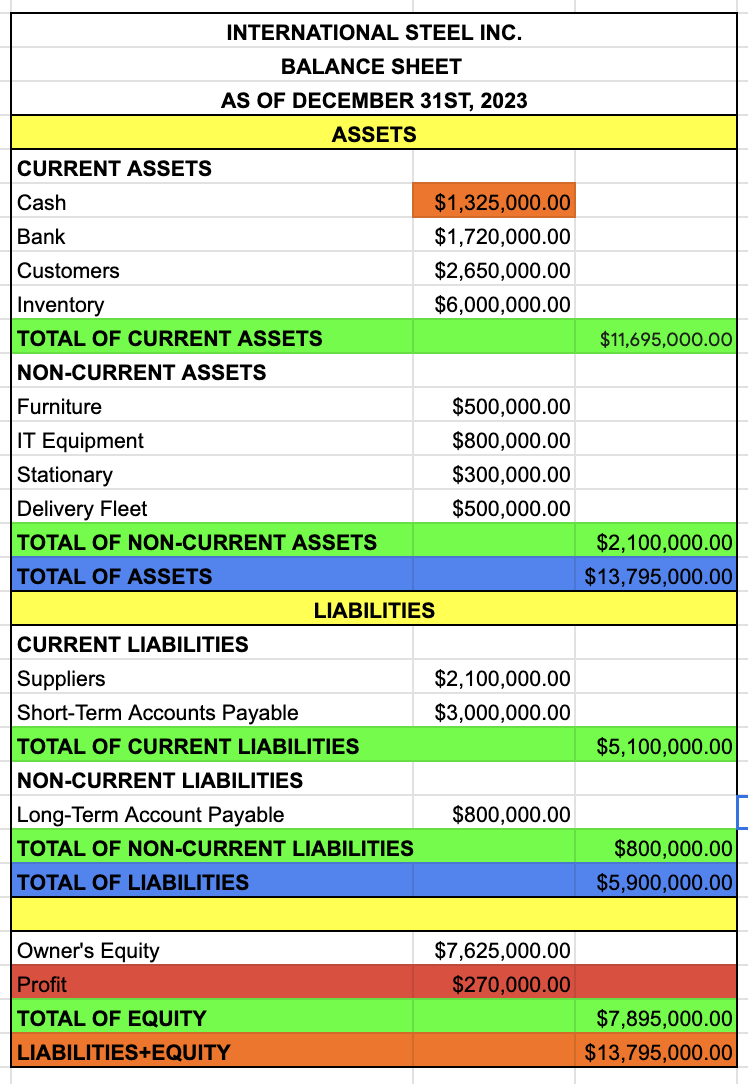
OWNER’S EQUITY
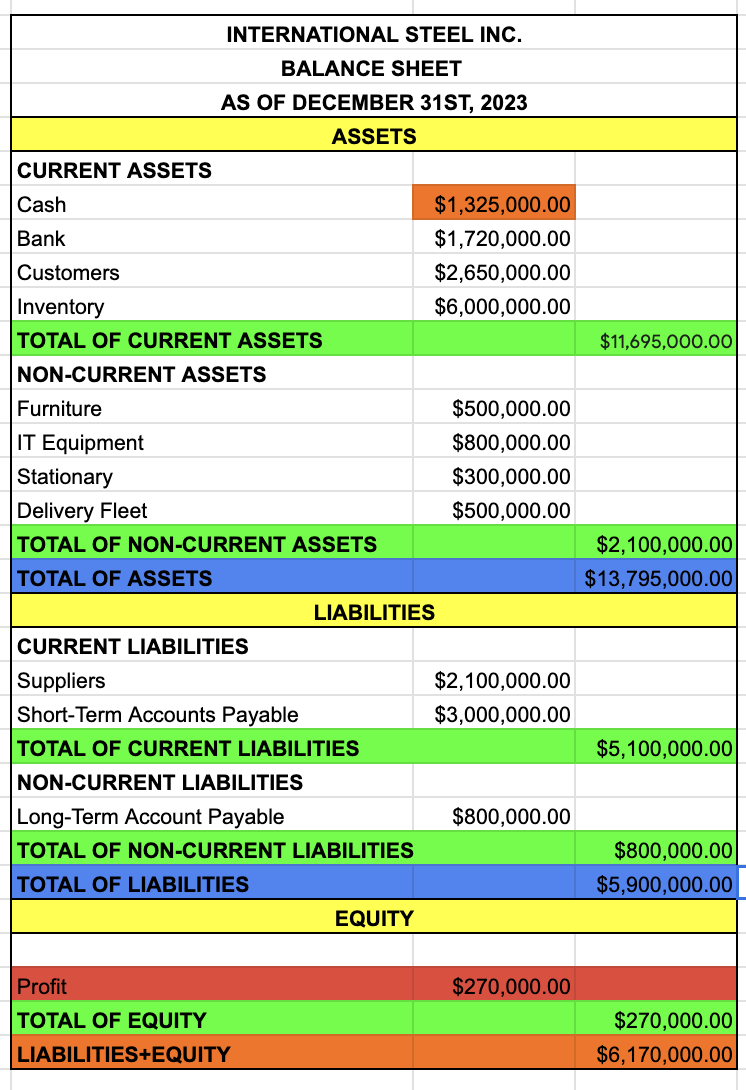
PROFIT
TAKE IT FROM THE INCOME STATEMENT
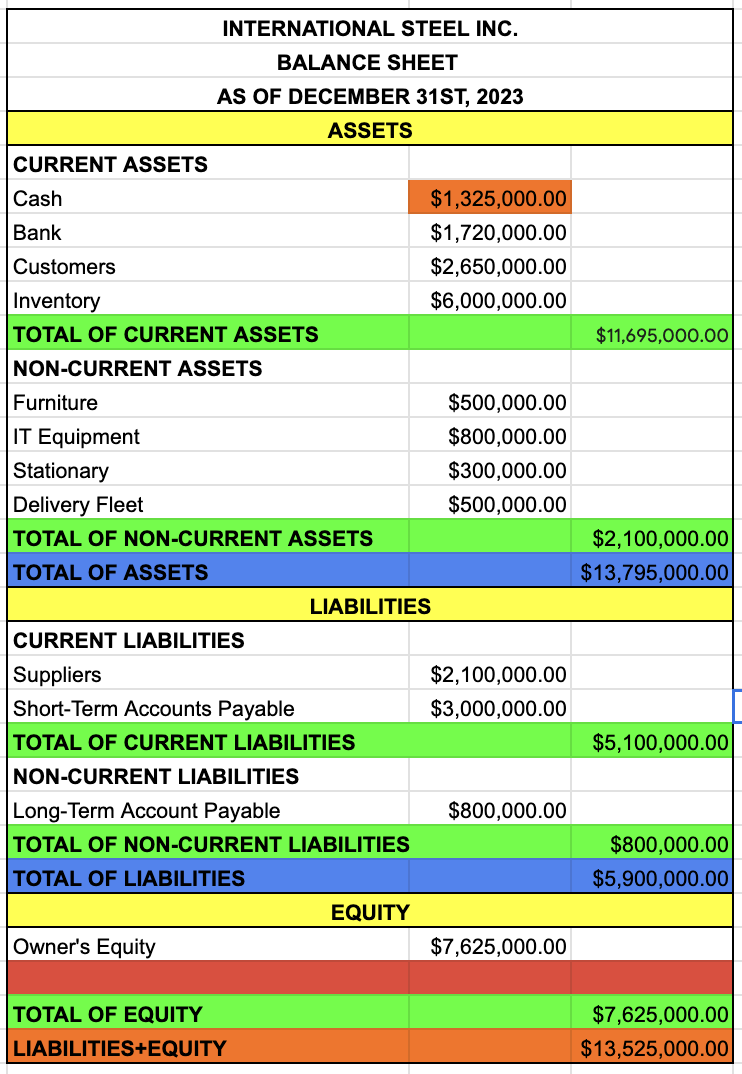
TOTAL OF EQUITY
OWNER’S EQUITY + PROFIT
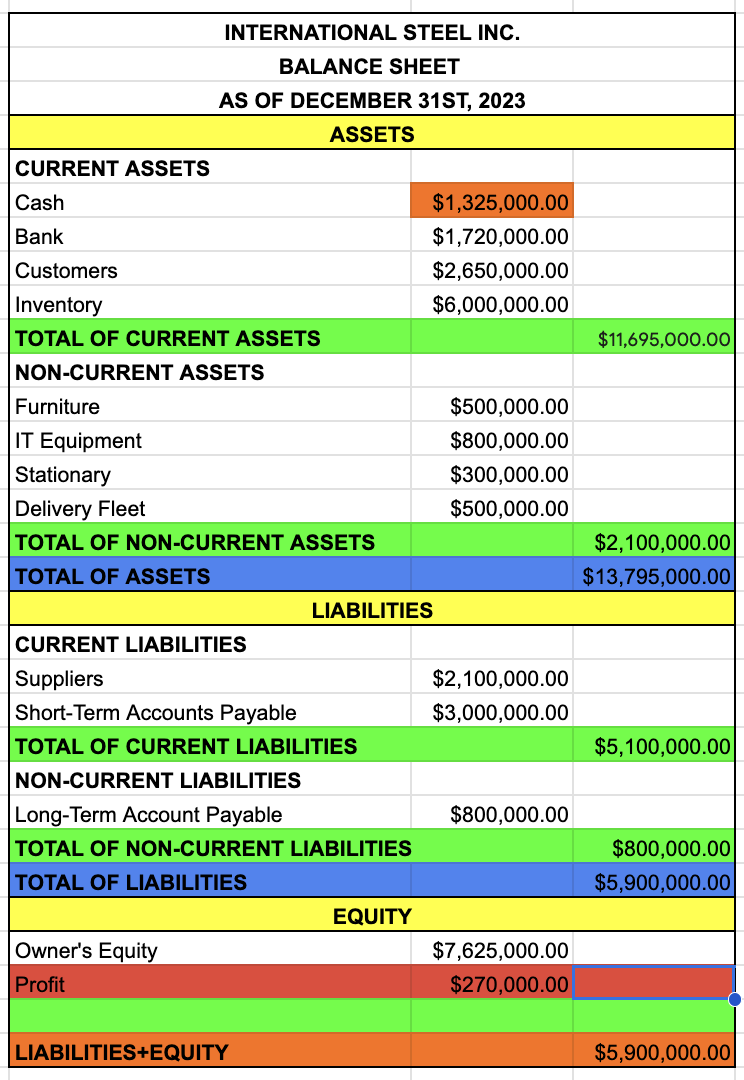
LIABILITIES + EQUITY
COMPANY
INCOME STATEMENT
DATE
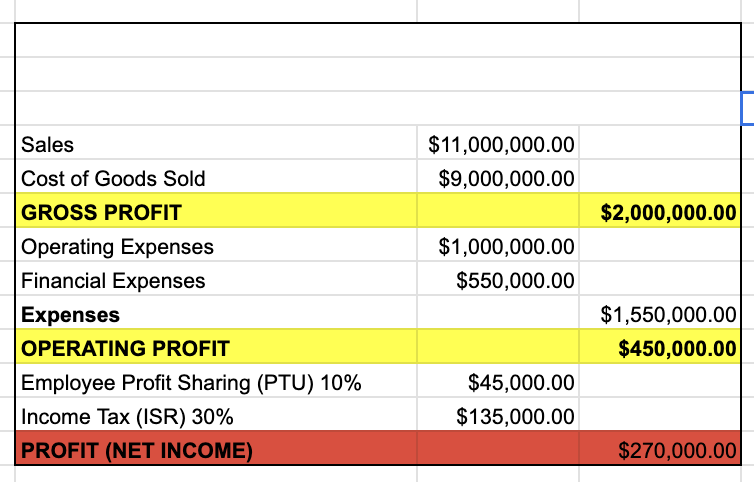
SALES
COST OF GOODS SOLD
