AP Human Geography Vocabulary you need for the exam
1/420
Earn XP
Description and Tags
These are flashcards with precise vocabulary to help you pass the exam.
Name | Mastery | Learn | Test | Matching | Spaced | Call with Kai |
|---|
No analytics yet
Send a link to your students to track their progress
421 Terms
Absolute distance
An exact measure of the seperation between two points using a standard measure (ex: inches meters, miles.
Absolute Location
The precise location of any object or place on the earth’s surface
(ex: latitude and longitude).
Accessibility
Relative ease with which you, goods and/or ideas can reach a destination. Determined by a place’s connectivity; the more means there are for interacting with a place, the higher its accessibility.
Administrative Regions
Politically determined, boundaries are exact
Aggregation
Refers to the size of the unit under investigation such as cities, counties, states, or countries.
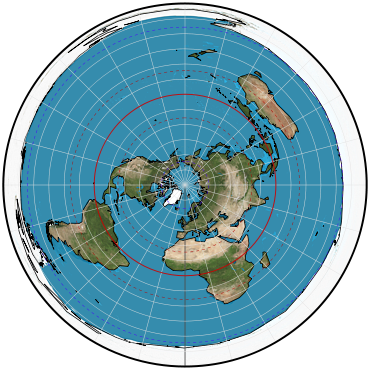
Azimuthal Projections
Projection from on top of the globe.
Barriers to diffusion
something that inhibits a phenomenon from spreading across space.
Physical barriers are objects in the environment that prohibit interaction from taking place like mountain ranges.
Sociocultural barriers prohibit diffusion when a person’s beliefs, culture or place in society prohibit interaction with certain people or places.
Psychological barriers are generally fear or ignorance that keep individuals from interaction with certain people or places.
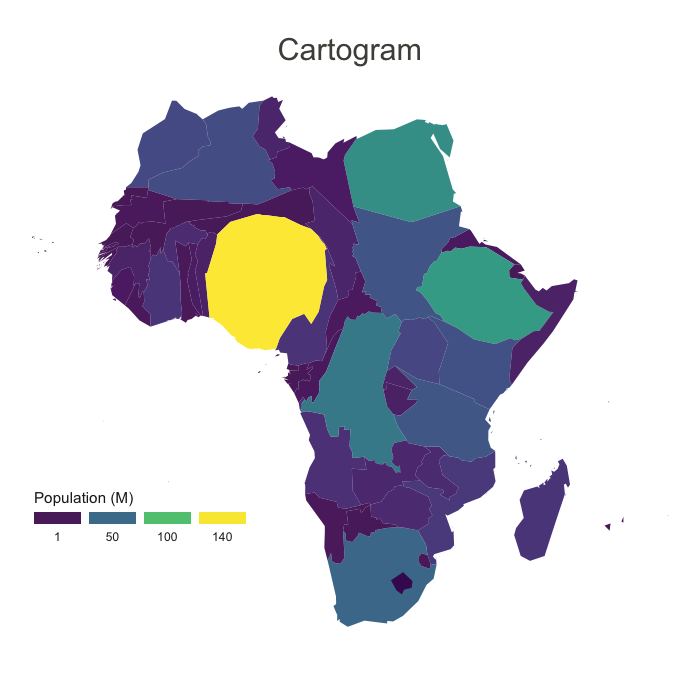
Cartograms
Transform space so that the political unit, such as a state or country with the greatest value for some type of data is represented by largest relative area and all other polygons are represented proportionately to the largest polygon.
Cartography
The art and science of making maps. The goal of cartography is to develop maps that accurately and elegantly convey spatial information
Cartographic Scale
AKA map scale, refers to the ratio between distance on a map and the actual distance on the earth’s surface.
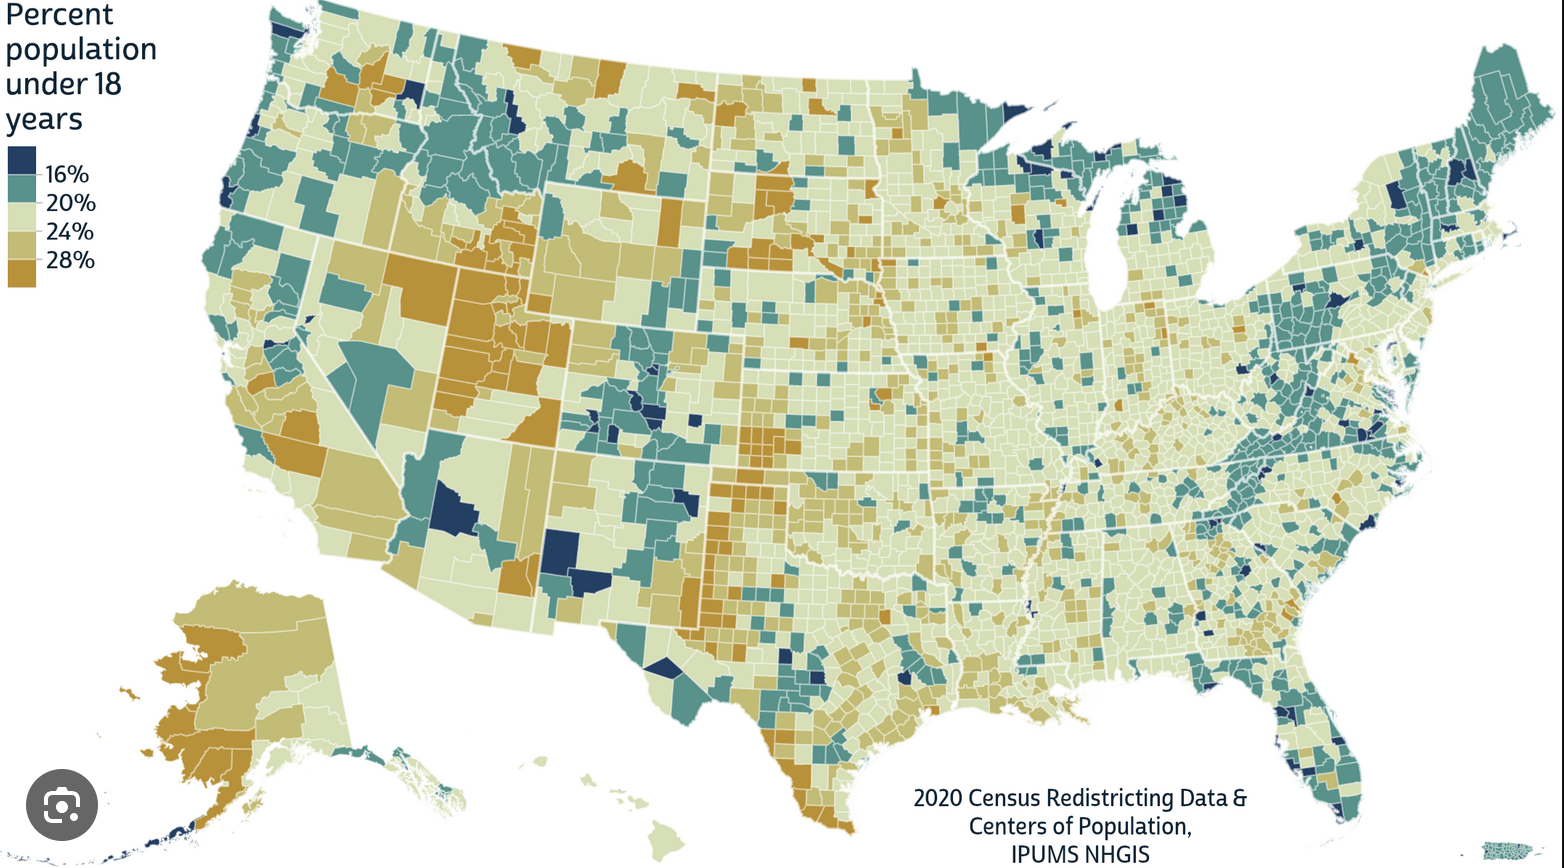
Chloropleth Maps
Use Colors or tonal shading to represent categories of data for given geographic areas: countries, states, or counties most commonly use polygons
A map of population density by country in US might use five shades of green to classify density values.
Cognitive Maps
A dynamic internal representation of a place or environment.
The Sketch map is external representation of the spatial information that exists in a person’s head
Each cognitive map is highly individual, dependent on information an individual deems important, and is limited by amount and type of experiences an individual has with a place.
Cognitive / Perceptual / Vernacular Regions
Describe how people informally organize places in their mind.
Even though formed by individuals, usually are shared between people because of culturally shared beliefs. ex, in the US, most ppl draw similar boundaries around the “deep south”.
Boundaries are Imprecise, vague or variable
Concentration
When Spatial distributions of objects or features appear in close proximity to one another, they are said to be concentrated. This is also called a cluster.
Conformal Projection
In conformal projections, the shapes of small areas are preserved.
In many conformal projections, such as the Mercator Projection, compass direction is preserved making them useful for navigation purposes.
Connectivity
A measure of all the means of connection and communication between places.
Virtually synonymous with relative distance as some places are highly connected to one another yet separated by significant distances.
Contagious Expansion Diffusion
Describe Diffusion resulting from direct contact with an individual.
All Infections diseases, such as AIDS, are spread by contagious diffusion.
Density
The amount of a particular feature within a given area. It is not the same thing as dense, which implies a cluster. Ex population density is the number of ppl within a given area.
Diffusion
The ways in which technological innovations, cultural trends, or outbreaks of disease travel over a space.
Two main processes - expansion diffusion and relocation diffusion
Relocation diffusion is a physical movement that leads to spread usually as a result of migration while number of adopters is relatively small ( like iphone 16)
With expansion diffusion, interaction leads to spread and number of adapters grow rapidly before stabilizing ( like covid)
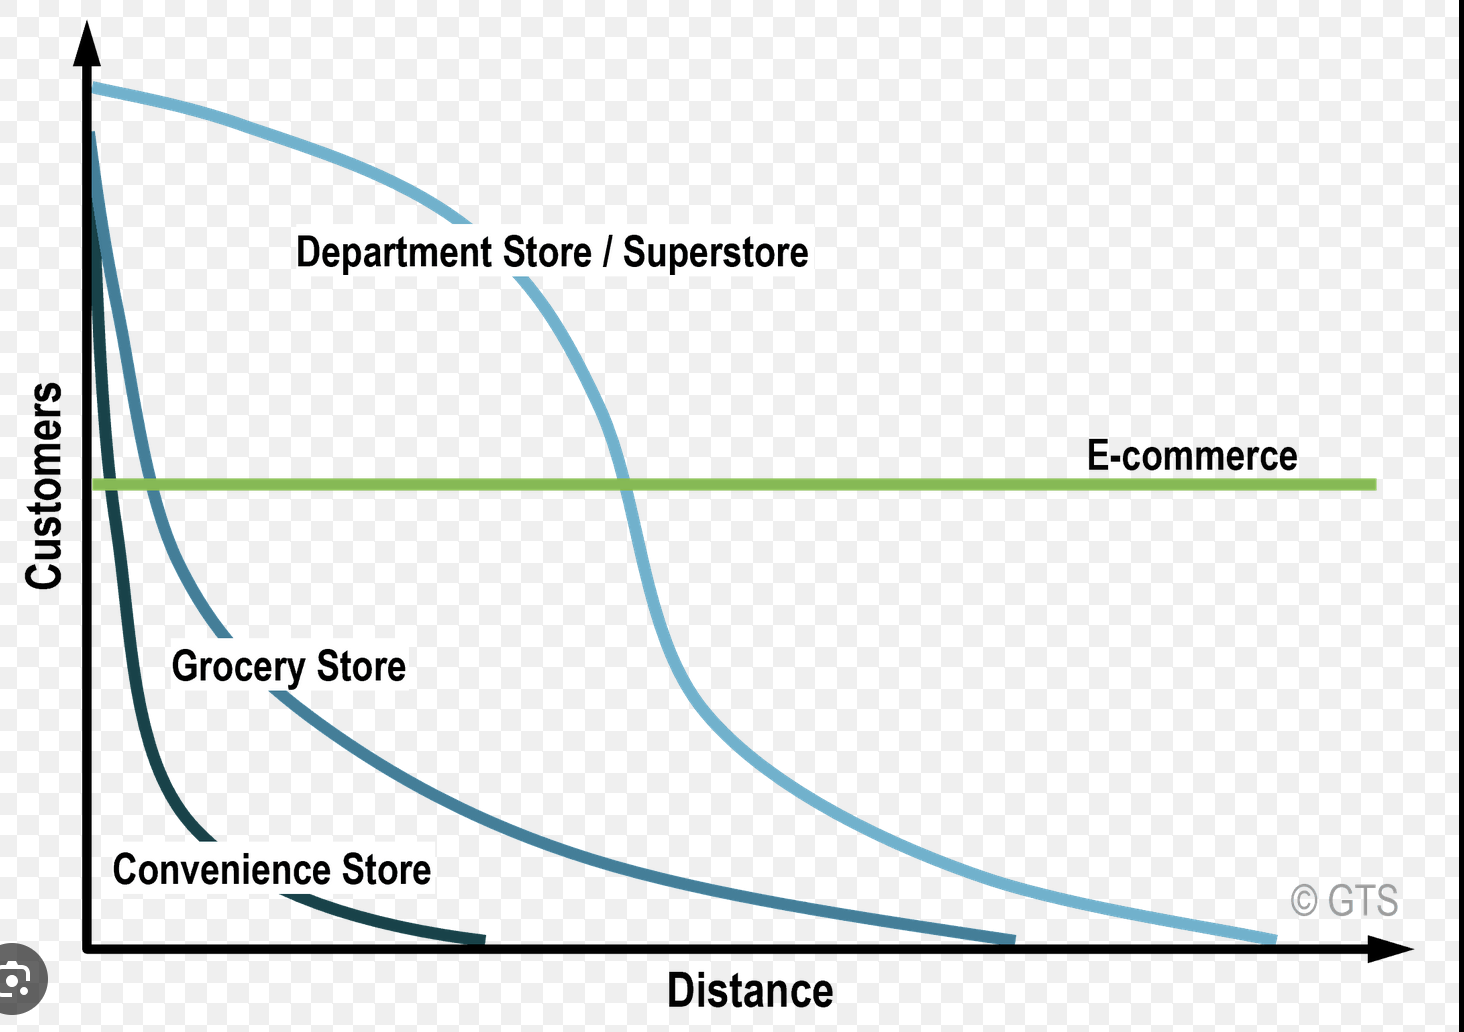
Distance Decay
Describes the pattern of diminishing likelihood of interaction with a place with increasing distance from that place.
Ex. the majority of people who shop at a particular grocery store, live or work close by. Few customers in that store live far from its location.
Different activities have different distance decay curves, ppl travel short distances for everyday goods like milk & bread, but travel farther to attend special events like concerts or sporting events.
Distance Decay Curve
See image and add your own image
Distortion
All flat maps are distorted as a result of projecting a 3-D surface onto a 2D surface. The only accurate representation of earth’s surface is a globe.
Some projections distort features in favor of preserving others.
Major features get distorted or preserved are shape, area and direction.
Distribution Concepts
Concepts that are used to understand how certain objects, features, and phenomena are organized in space.
Concentration, density, dispersion and pattern area are all distribution concepts.
Dot Density Maps
Use Points to represent particular values, for ex cropland harvested, where each dot represents 1,000 bushels of corn.
Value comes from ability to facilitate perception of spatial pattern, ex corp cropland harvested, obvious spatial pattern would emerge in the Midwest.
the disadvantage is the data that does not meet the threshold ( ex only 999 bushels of corn harvested in an area) will not be on the map.
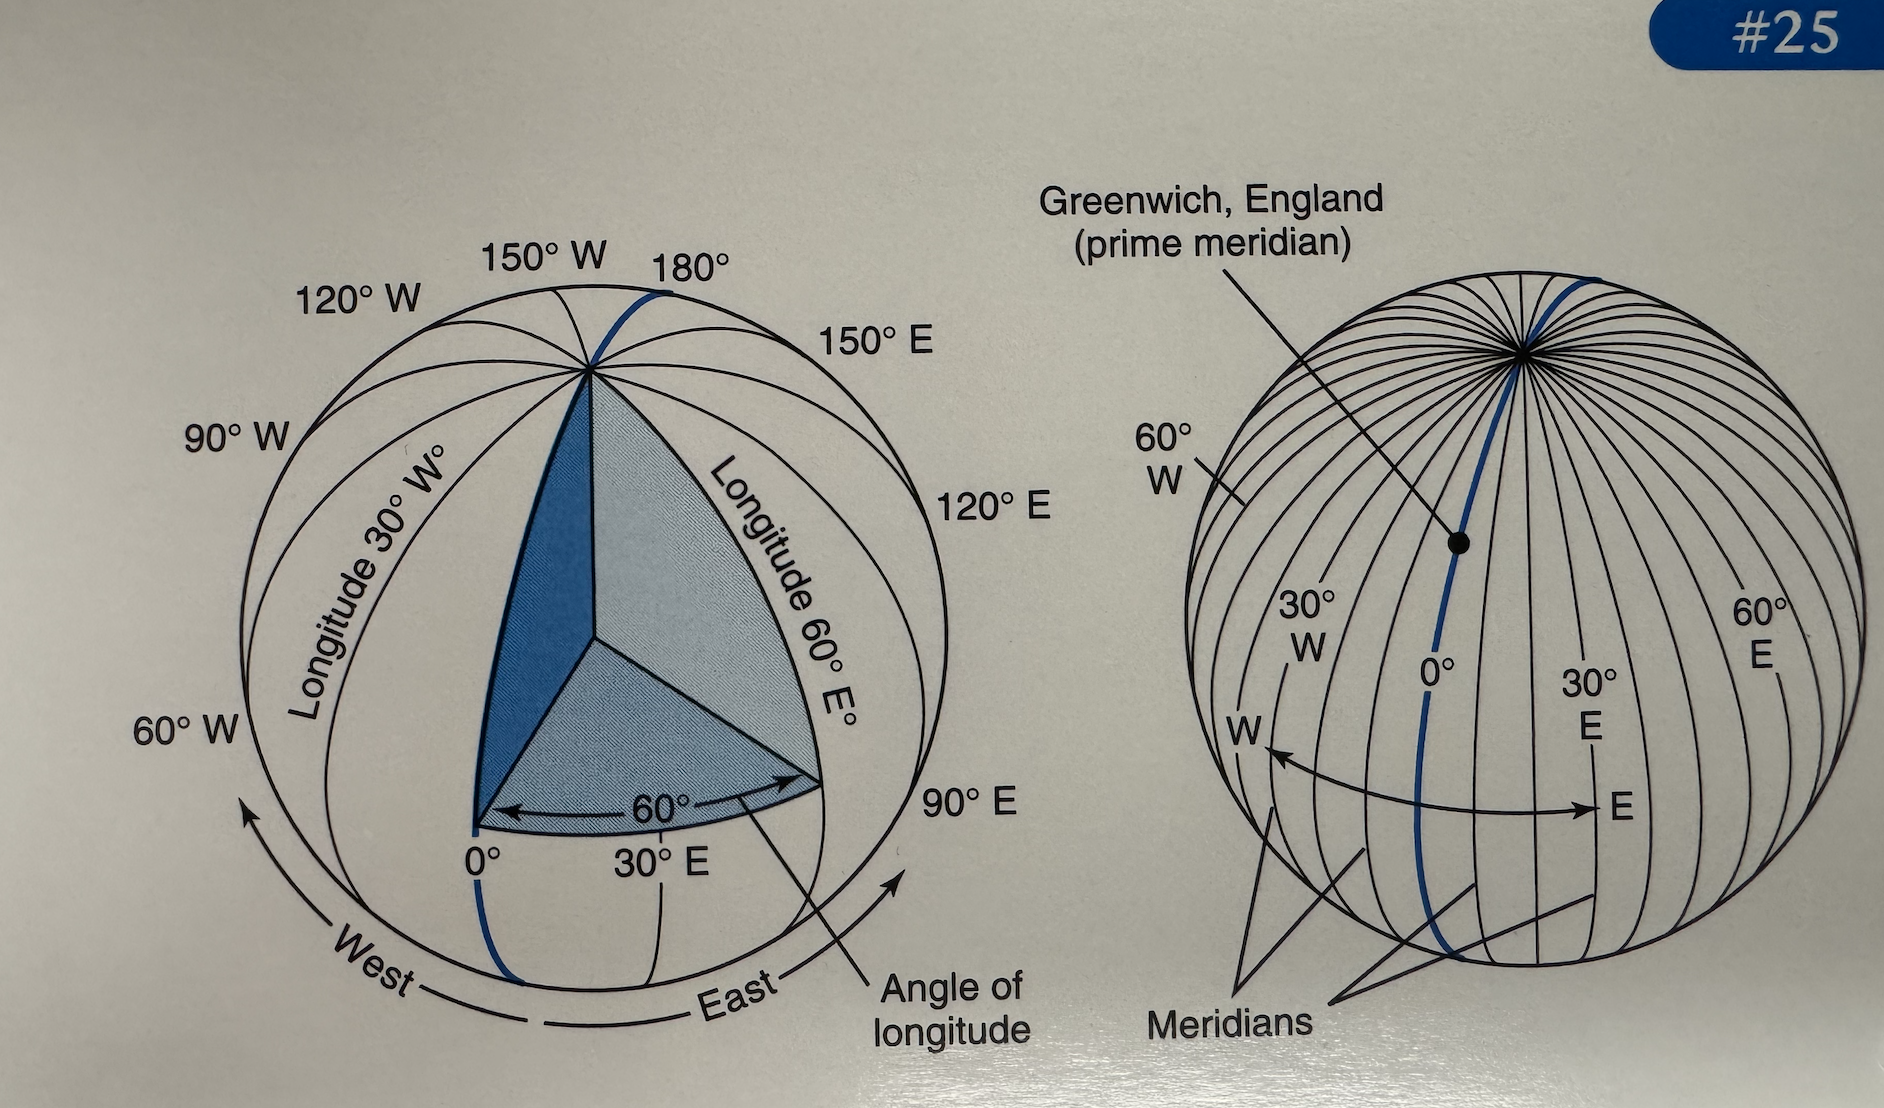
Earth’s Graticule
See image
Environmental geography
Results from intersection of human and physical geography
Geographers who study human environment relationships (HER) come from every academic discipline and occupy debates regarding anthropogenic, or human-induced environmental change, conservation planning and sustainability
Concerned with anything from history of a given landscape and effects of pollution on impoverished neighborhoods to the creation of nature reserves for endangered species.
Equal-Area Projection
Cartographers using or making these types of projections are interested in the preservation of an area; in other words, shapes or directions are distorted but sizes of landmasses are correct in relation to each other.
First law of Geography
Everything is related to everything else, but near things are more closely related than far things.
Describes “the friction of distance” meaning that the farther away something is, the less likely some is to interact with it.
Five themes of Geography
Location refers to position on Earth’s Surgace
Human /environment interaction refers to cultural ecology or the relationship btn culture and environment.
Regions are ways to organize or compartmentalize space
place differs from location in that it refers to associations among phenomena withing a particular area
Movement describes the interconnections btn areas.
Formal Regions
Sometimes called thematic regions bcz they are defnd by one ore more variables.
Group strength varies throughout the region, some places represent the theme defining the region more strongly than others.
bcz of varying memberships strength, boundaries are imprecise or vague. A clear line does not separate one area from another. Change btn regions tends to be gradual.
examples like climate regions, language, religion or any other theme that does not correspond to administrative boundaries.
Functional Regions
The boundaries are drawn around an interaction region, every functional region has a node that people interact with, the special pattern of that interaction defines the region.
For ex. commuters to a particular city, newspaper circulation or branch operations with a major bank.
Generalization
Average over details, in a cartographic context generalization results from scaling changes.
Small scale maps have high generalization or less detail, but show larger pieces of the earth’s surface area.
Large-scale maps have less generalization or more detail, but show smaller pieces of the earth’s surface.
a map of the entire United states (small scale) will not show the small towns and villages that would appear on a map of a local area.
Geographical Information System (GIS)
A software program that allows geographers to map, analyze and model spatial data.
Use thematic layers, consisting of individual maps that contain specific features such as roads, stream networks, or elevation contours.
Global Positioning System (GPS)
An integrated network of satellites that orbit the earth, broadcasting location information, in terms of latitude an longitude, to handheld receivers on the earth’s surface.
Gravity Model
First Described in the 1950’s it is based on Isaac Newton’s Law of Universal Gravitation.
Lij = PiPJ/Dij2
Where
Lij - the interaction btn places i and J
Pi = the population of place i
Pj= the population of place j
Dij2 = the distance between places I and j, squared
An important implication is large cities may still have extensive interaction despite being separated by great distances, ex NY and LA
Hierarchical Expansion Diffusion
Hierarchical diffusion describes spread first to major nodes and then down a hierarchy. fashion trends typically spread hierarchically by first appearing n major fashion nodes such as London, Milan, and Paris and then spread from there.
within the major nodes, a phenomenon spreads, typically, by contagious diffusion (eg. fashion trend spreading within Milan).
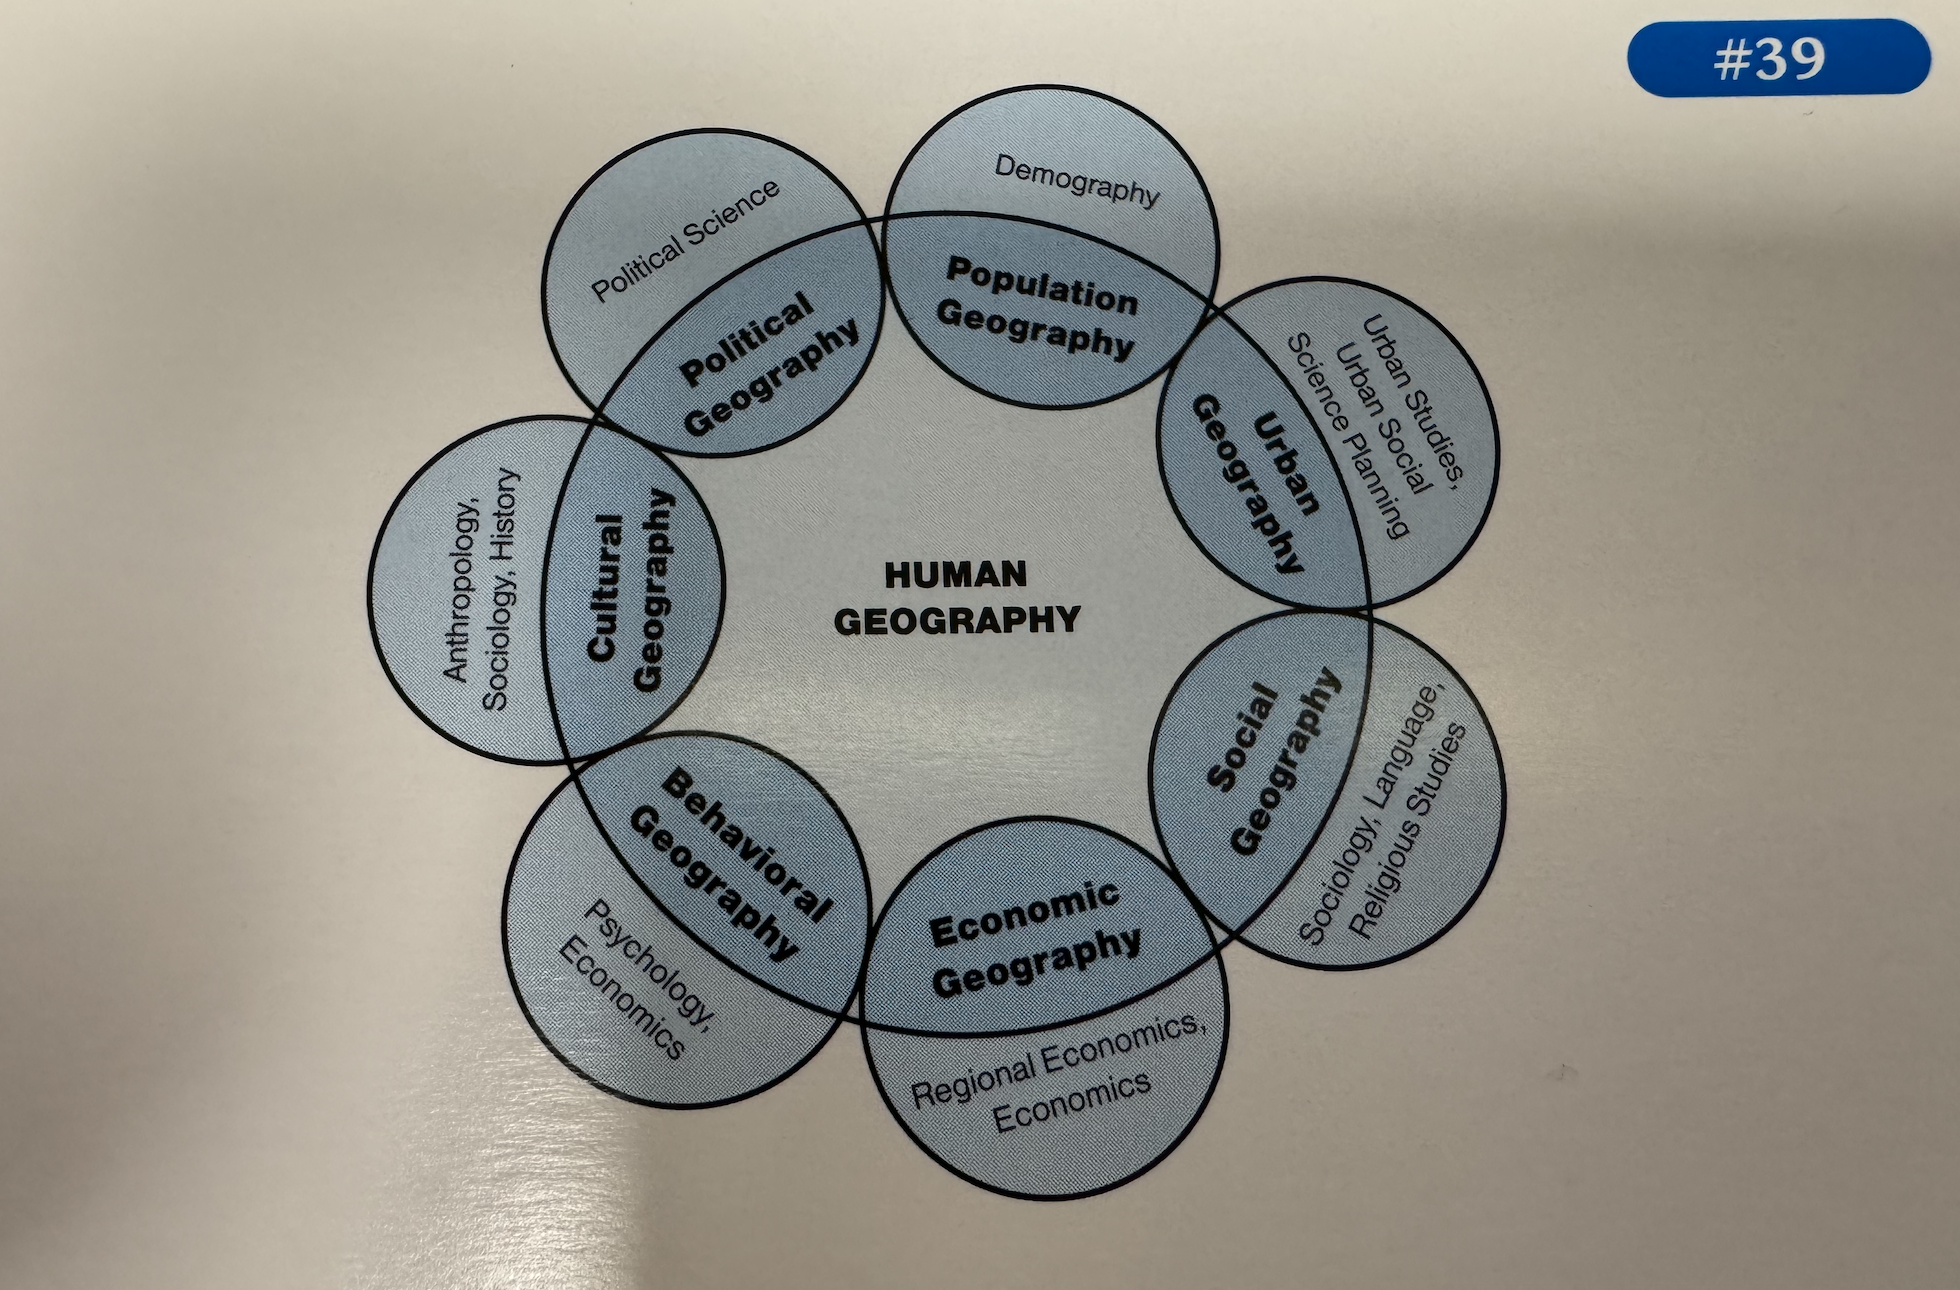
Human Geography
The field of geography that looks at variations in human behavior over space.
Human Geographers look at human characteristics including population, economy, agriculture, urbanization, culture, political systems, and how those characteristics vary depending on where you are on the earth’s surface.
Human geographers also look at the complicated relationship between humans and their environments.
Human Geography
See image
Isoline Maps
Maps that use lines to represent quantities of equal value.
Ex. Topographic where each line represents a constant elevation.
Lines spaced close together indicate a rapidly changing values, where as lines far apart indicate little change over space.
Isolines can be used to show other values that vary continuously over space such as temperature or population density
Latitude and Longitude
Lines of longitude, or meridians, originate at the prime meridian which passes through Greenwich England and ends at the international date line, all lines of longitude meet at the poles.
Lines of latitude run parallel to one another and are often called parallels. They originate at the equator and terminate at the poles.
Together they allow for precise determination of location on the surface of the earth.
Maps
Pictorial Models of reality that use symbol to convey meaning.
Power comes in their ability to make something nonspatial e.g., population rates), spatial, therby facilitating the perception of spatial relationships.
The only way to see the entire earl's surface at once.
Mercator Projection
Preserves accurate compass direction but distorts area of landmass relative to each other.
Landmasses become increasingly distorted, or large in size, at high latitude near the North and South Poles. Originally created by projecting the earth's features onto a cylinder (a cylindrical projection), which results in lines of latitude becoming parallel rather than intersecting leading to tremendous distortion at the poles.
Network
The areal patter of connections between places.
Some networks describe literal connections between places such as the connections between subway stops on a metro map. However, some are less literal; for example, many emerging internet sites such as "facebook" are social networks, describing all links between a group of "friends."
Pattern
A distribution concept that conveys how objects, features, or phenomena are spatially situated in relation to one another.
For example, some features can have a linear pattern, some centralized, some triangular, etc.
Pattison’s Four Traditions of Geography
In 1964, Pattison published a piece on the discipline of geography's four defining traditions:
The earth-science tradition as defined by Pattison is essentially physical geography.
• The culture-environment tradition is essentially the same thing as HER or environmental geography.
• The location tradition relates to the analysis of spatial data through cartography.
The area-analysis tradition refers to regional geography, which involves an investigation and description of a unique piece of the earth's surface.
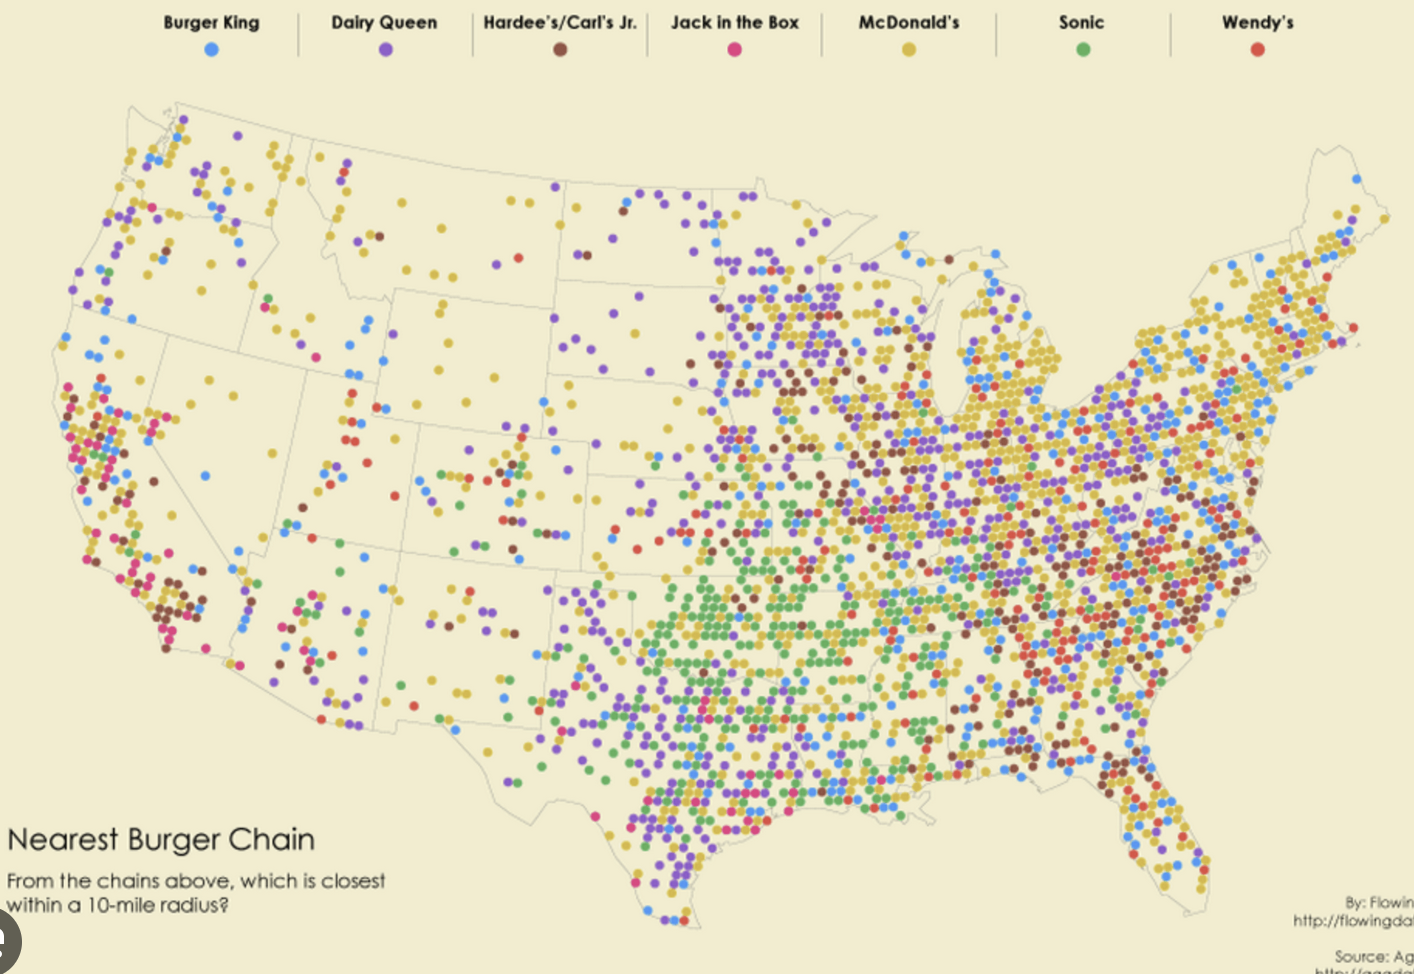
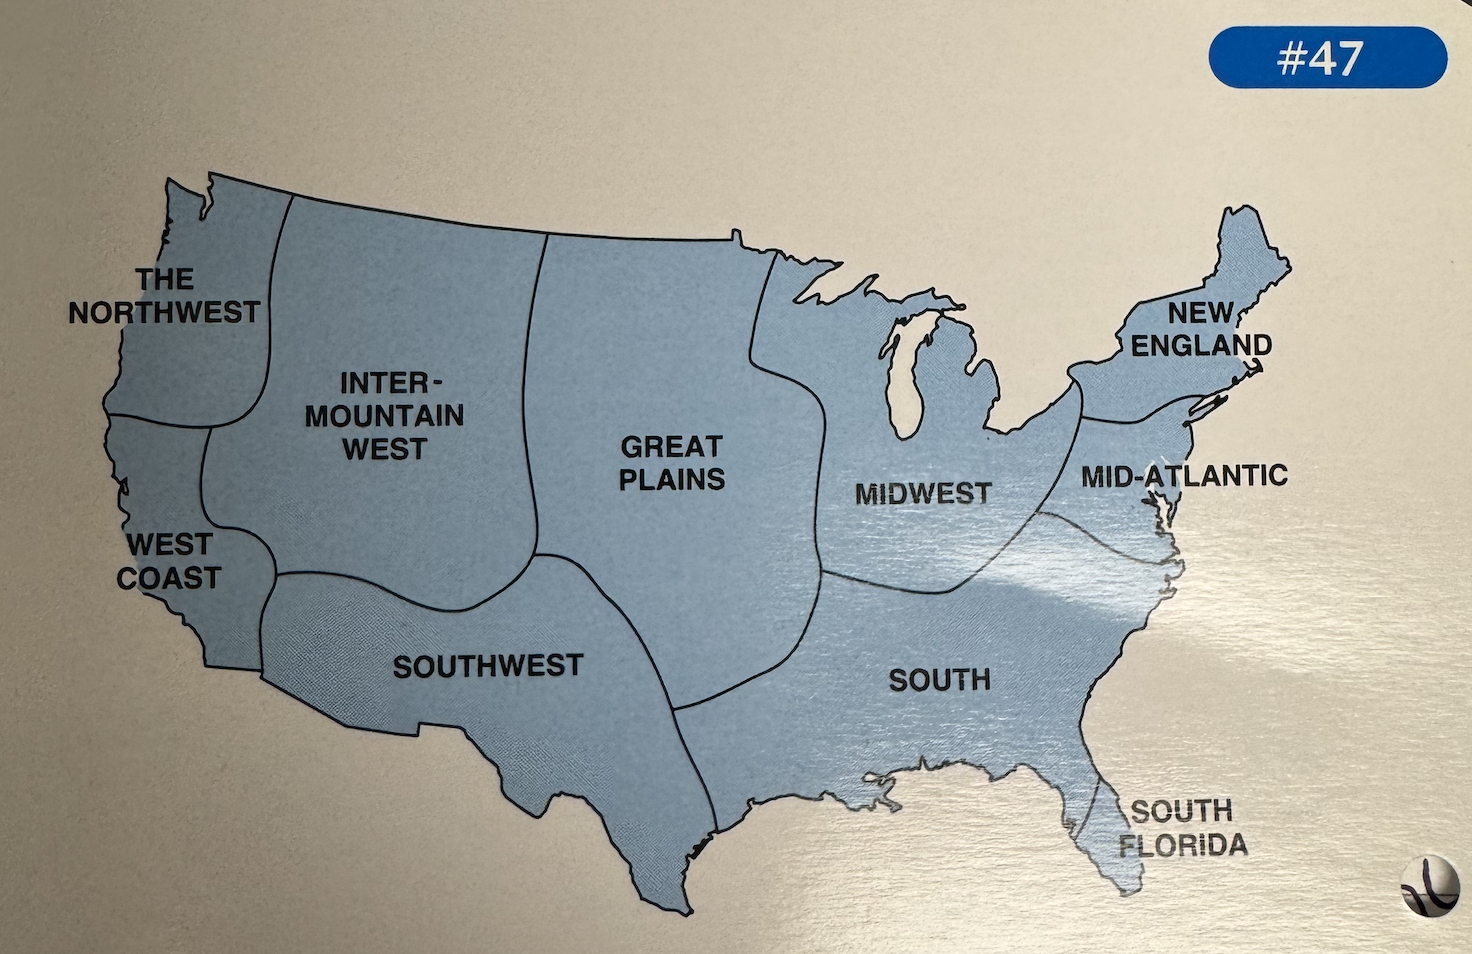
Perceptual Regions of the United States
See image
Peter’s Projection
A cylindrical projection that retains accurate sizes of all the world's landmasses.
Reveals how large the landmasses near the equator actually are.
Often viewed as a political statement-an attempt to focus attention on the world's poorest countries.
Physical Geography
• Physical geographers study spatial characteristics of the earth's physical and biological systems.
• Many natural scientists, including meteorologists, climatologists, ecologists, oceanographers, geologists, soil scientists, and hydrologists, study physical geography.
• Through the understanding of the spatial variability of the phenomena under investigation each of these types of scientists gain insight into why certain phenomena behave the way they do in certain places.
Preference Map of the United States
See image
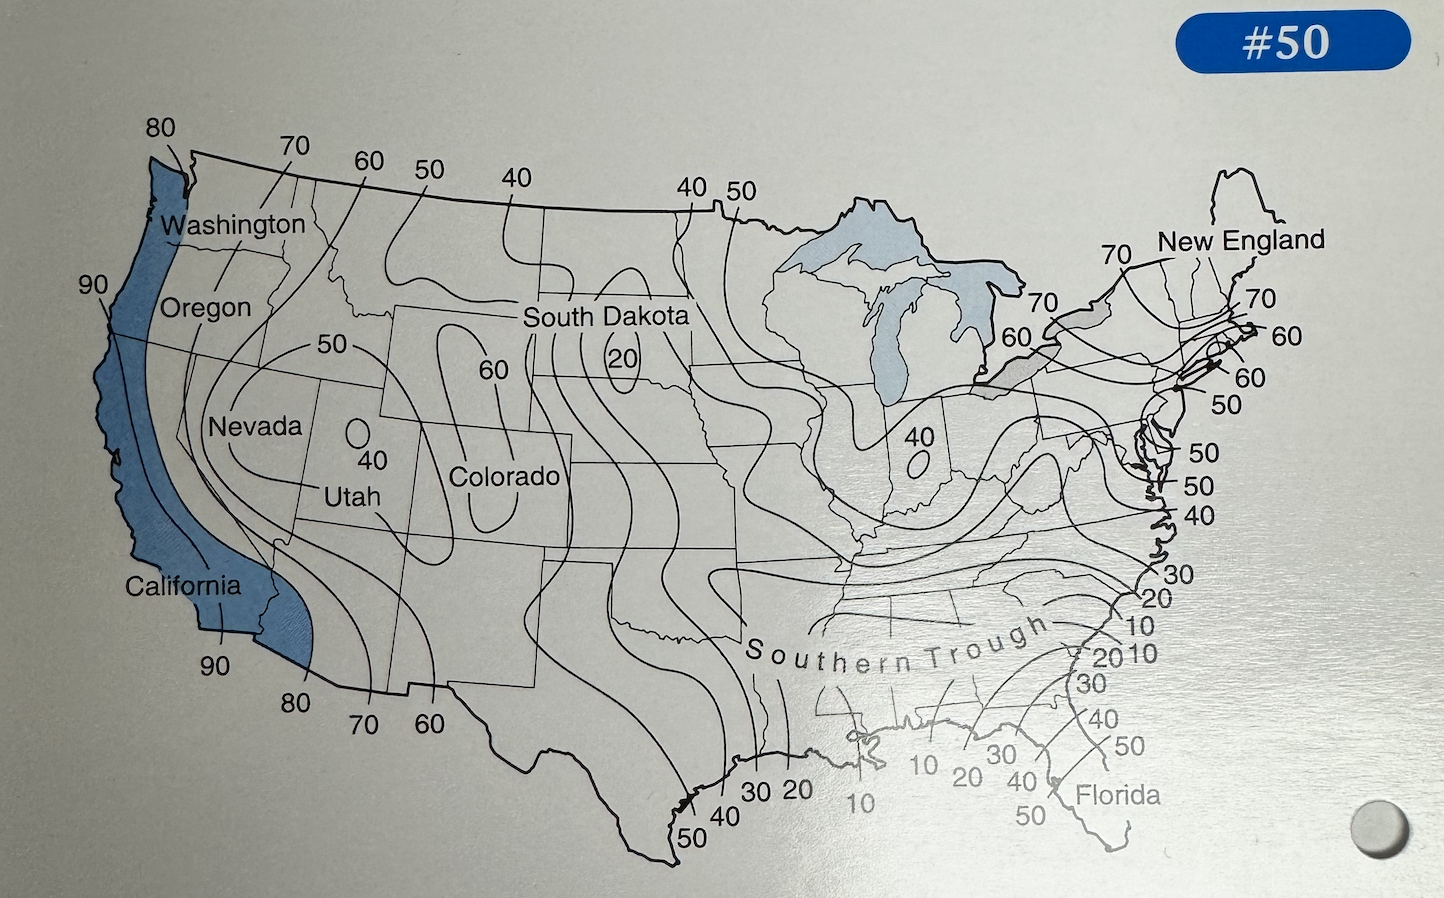
Preference Maps
• Show people's ideas about environmental, social, or economic quality of life in various places.
• In general, most Americans rate their home state highly, and most show preferences for coastal areas, especially California, and the East Coast.
Projection
• Refers to the process by which the three-dimensional surface of the Earth is transferred to a two-dimensional map.
• Traditionally, maps were made by placing a light source (e.g., a candle or bulb) inside of a translucent globe and then projecting the globe's features onto another shape (usually a piece of paper) surrounding it.
Currently produced through numerous different, complicated, mathematical equations.
Proportional Symbols and Maps
• Size of the chosen symbol (e.g., circle, triangle, or flow line) indicates relative magnitude of some value for a given geographic region.
• Flow lines often used to show movement of goods or people over space; lines get relatively thinner and thicker as values shrink or expand.
Reference maps
• Reference maps are used to navigate between places and include topographic maps, atlases, road maps, and other navigational maps.
Region
One of the fundamental units of analysis in human geography.
Regionalizing allows geographers to group pieces of the earth's surface together according to certain similarities.
Regions do not exist as well-defined units in the landscape; instead they are conceptual constructions that geographers use for convenience and comparison.
Regional Geography
• Regional geography, or Pattison's area-analysis tradition, is the study of regions.
• Regions vary in size; a region may be an entire continent, for example, North America, or a smaller area, such as southern Florida.
Regional geographers, no matter the size of the region under study, investigate the unique characteristics, patterns, and processes existent within that place.
Relative Distance
• Relative distance is when less precise but often meaningful measures are used to describe separation between two points.
• Most common relative distance measure is time, or how long it takes to get from point A to point B, which is typically relative to a person's mode of transportation.
• For example, New York might be five hours by plane from Los Angeles, but over three days by car.
Relative Location
• Relative location describes a place's location in terms of its relationship to places around it.
• It is more common in everyday language.
Remote Sensing
• Process of capturing images from Earth's surface from airborne platforms such as satellites or airplanes.
• Images can be digital or analog photographs and data can be collected from several bands of the electromagnetic spectrum
Resolution
• Refers to a map's smallest discernible unit; basically it is the smallest thing visible on a map.
• If an object has to be 330 feet (100 meters) long in order to show up on a map, then that map's resolution is 330 feet (100 meters).
Robinson Projection
• An example of an attempt to balance projection errors.
Does not maintain accurate area, shape, distance, or direction, but minimizes errors in each.
• Provides an aesthetically pleasing balance leading to its frequent use by cartographers at organizations such as the National Geographic Society (which is where the projection was made).
Scale
• Geographic scale is a general concept that refers to a conceptual hierarchy of spaces, from small to large, that reflect actual levels of organization in the real world.
A characteristic scale in human geography, from small to large, is the increase in size from the neighborhood, to the urban area, to the metropolitan area, and finally, to the region.
• Geographers seek to understand how processes occurring at one scale may affect activities at other scales.
Simplification
Refers to level of detail portrayed on a map.
If a cartographer designs a map of the entire United States, he or she would probably not include minute details such as locations of towns smaller than fifty thousand people.
• Level of simplification depends on the purpose of the map and the size of the area the map is portraying.
Site vs Situation
• Site refers to the physical and cultural features of a place, independent of other places around it.
• Situation describes a place's relationship to other places around it.
• For example, New Orleans's site is poor: it is essentially a bowl below sea level, meaning big rain events lead to significant problems.
However, its location on the Mississippi River delta makes its situation in relation to the rest of the United States very important.
Spatial Association
• Describes the distribution of two or more features and how they do or do not correspond to one another.
• Powerful concept in spatial analysis as it allows geographers to understand why certain spatial patterns exist.
• For example, the mapping of type 2 diabetes and socioeconomic status (SES) reveals a strong spatial association: the states with the highest rates of type 2 diabetes also have lowest SES.
Spatial Perspective
• An intellectual framework that allows geographers to look at the earth in terms of the relationships between various places.
• Geographers look at the spatial distribution of different types of phenomena and ask why and how certain phenomena come to occur in certain places.
• Some major questions of geographers are: How do two places interact economically, socially, and culturally? Why do some places have more in common than others? How are social phenomena conveyed over time and space?
Stimulus Expansion Diffusion
• Describes the pattern by which a concept is diffused but not in the same form as in original contact.
• For example, some Native American groups' exposure to written language stimulated them to develop their own written language systems that differed from the language they were exposed to.
Systematic Geography
• Study of the earth's integrated systems as a whole, instead of focusing on particular processes in a single place.
• This approach allows geographers to apply their knowledge of a specific spatial process broadly beyond unique places to other areas across the globe.
Thematic maps
Thematic maps display one or more variables across a specific space such as population variables, voting patterns, or economie welfare.
Many ways to display thematic data, some common methods include choropleth maps, proportional symbol maps, isoline maps, and cartograms.
Time-Distance Decay
• The idea that the longer it takes for something to spread or move over space, the less likelihood of interaction with or spread of that phenomena.
• Essentially description of time as a barrier to spatial diffusion.
Time-Space Convergence
• The idea that with increasing transportation and communications technology, absolute distance between certain places is, in effect, shrinking.
For example, increased transportation technology has "shrunk" the distance between New York City and London; it used to take days, even weeks, to cross the Atlantic by boat; it now takes only half a day by plane.
• Increased communications technology allows places to communicate instantaneously with each other, which, in effect, completely negates distance's effect on interaction (via voice or text communication).
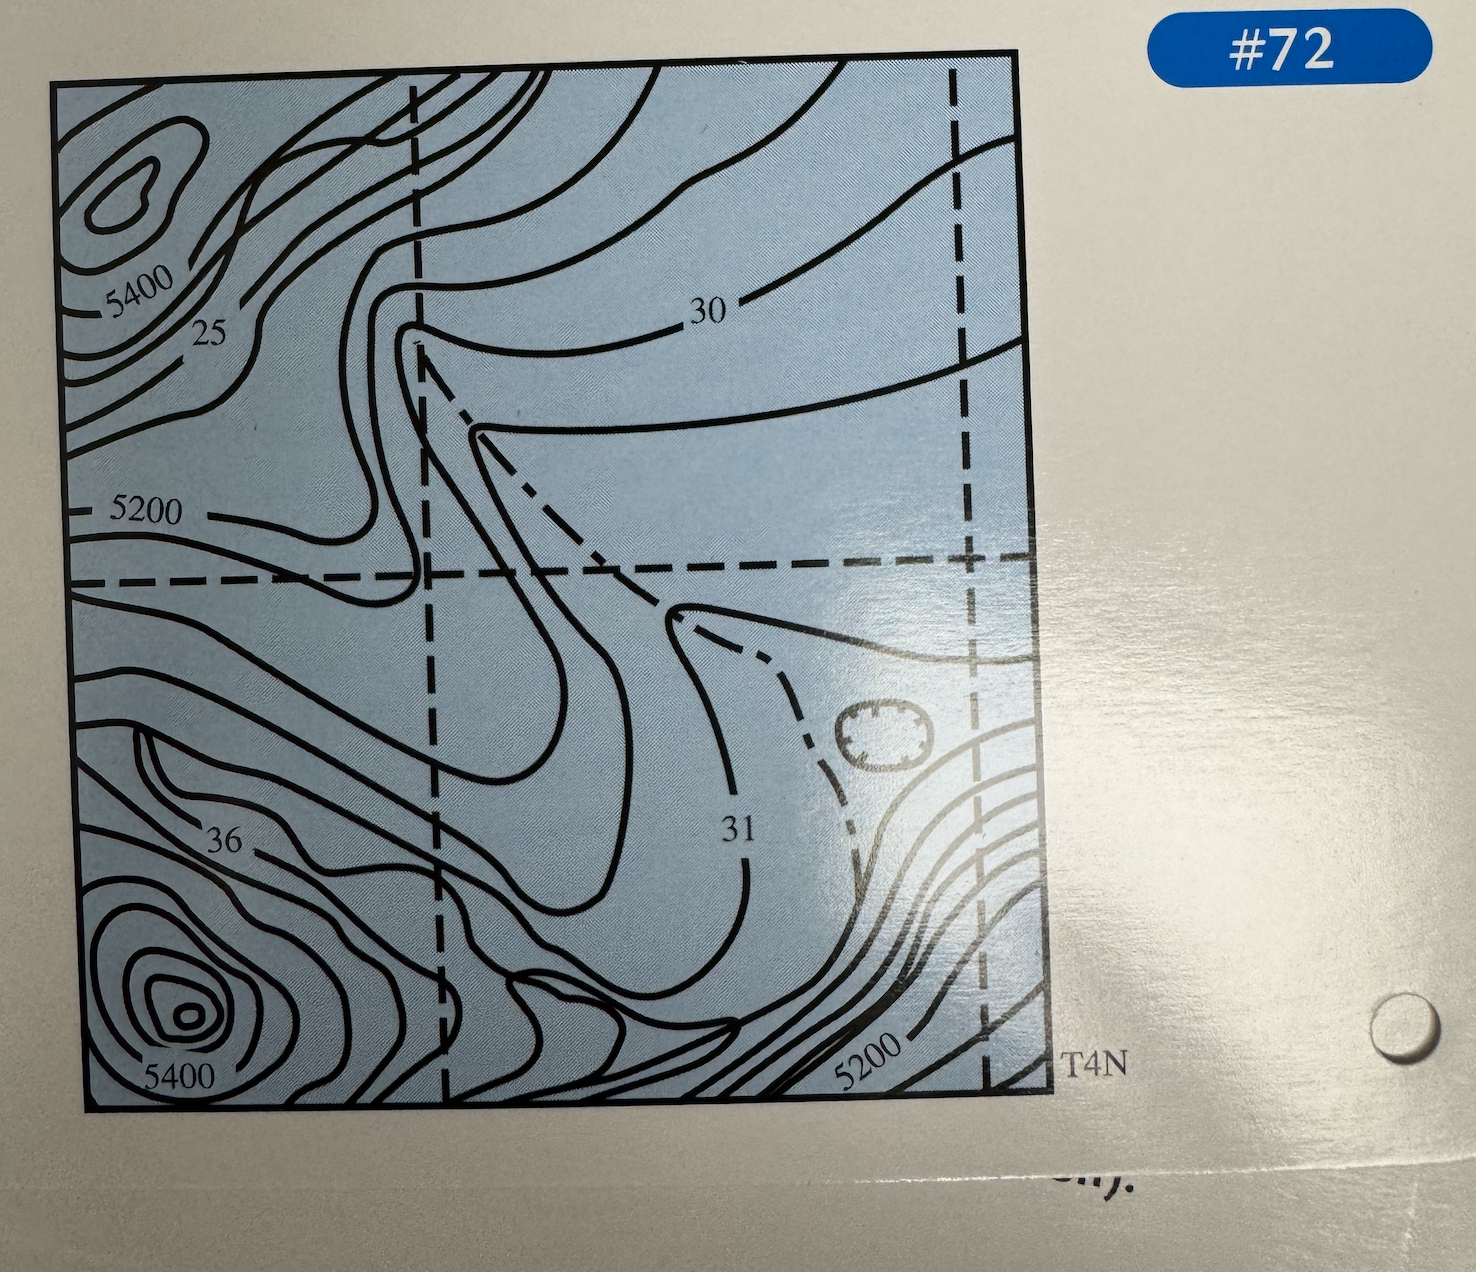
Topographic Map Showing Elevation Contours
See Image
Visualizations
• Exist digitally and use sophisticated software to create dynamic computer maps, some of which are three-dimensional or interactive.
• Some allow geographers to investigate features that cannot be seen with the naked eye; others use models to show how landscapes change over time.
• In some, people can walk through, or fly over, landscapes.
Antinatalist Population Policies
• Encourage couples to limit the number of children they have.
• Most often, these policies discourage growth through the provision of contraception or abortion or through establishment of specific disincentives, such as steep penalties for couples bearing more children than allowed by the state.
• China is famous for its one-child population policy from the 1980s in which many drastic measures (e.g., forced sterilization for couples with one child or infanticide of female babies) ensured decreasing population growth.
Arithmetic Density
Number of people in a given unit of area.
• Does not take into account physiographic differences in that area.
Baby Boomers
• Consist of individuals born post World War II (between 1946 and 1964).
• Baby Boomers are the largest population cohort in United States demographic history.
• As this large generation of individuals enters retirement, the burden is increasingly falling on the economically productive members of the country.
Baby Bust
• Following the Baby Boom, the Baby Bust was a period of time during the 1960s and 1970s when fertility rates in the United States dropped.
• The drop is attributed to large numbers of women from the Baby Boom generation who sought higher levels of education and more competitive jobs, causing them to marry later in life, causing them to have fewer children than the previous generation.
Cairo Plan
• In 1994, the United Nations, at the U.N. International Conference on Population and Development, endorsed a strategy to stabilize global population at 7.27 billion no later than 2015.
• Instead of focusing on top-down programs that limited reproduction in certain regions of the world, policies focused on giving women greater social and economic control of their lives.
• Many argue that global drops in fertility are a result of women, particularly in developing regions, assuming greater control over their economic and reproductive lives.
Carrying Capacity
• Essentially the number of people an area can sustain without critically straining its resource base.
• Depends on both level of technology and determining an appropriate standard of living.
Advanced technologies can typically sustain many more people than more primitive technologies.
• On a global scale, if people in developing regions begin to consume at a rate comparable to the developed world's consumption rates, the globe has certainly exceeded carrying capacity. If, however, the people of the earth live more modestly, the number of people the earth can sustain will increase.
Chain Migration
• Describes migrant flows from a common origin to the same destination. Family or friends move first and get established within an area, paving the way for more friends and family to follow the same path.
• As number of migrants from a similar area congregate in one place, services specific to that population (both cultural and social) begin to accrue in that area.
Channelized Migration
• With channelized migration streams, the flows between a particular origin and destination are larger than would normally be the case, but are not the result of family or kinship ties as is the case with chain migration.
• For example, channelized migration occurs between Texas and California; in other words, a significantly larger number of people move from Texas to California and vice versa than migration models predict.
Cornucopians
• In the 1980s, when many argued that stricter population controls needed to be placed on countries with high TFR (Total Fertility Rate) in order to stimulate development, many economists argued that increasing populations stimulate rather than hinder economic development.
• "Cornucopians" believe that with increasing populations come increasing opportunities for innovation.
• Current global totals have not proven to have the dire consequences predicted by Malthus and his followers. While many across the globe die of starvation on a daily basis, this is more an issue of food distribution than food availability.
Crude Birth Rates (CBR)
• Number of live births in a single year for every 1,000 people in a population.
• Birth rates tend to be highest in least developed regions where both number of women at or near reproducing age and fertility rates are high.
• Places with high birth rates tend to be countries where women's access to education is low.
• Places with high birth rates tend to have a high portion of their population engaged in agriculture; more children equal more laborers.
Crude Death Rates (CDR)
•Number of deaths in a country per 1,000 people.
•It is "crude" because it does not take into account the age structure of a population. For example, several countries in in Western Europe have relatively high death rates because of a high proportion of individuals in older-age cohorts.
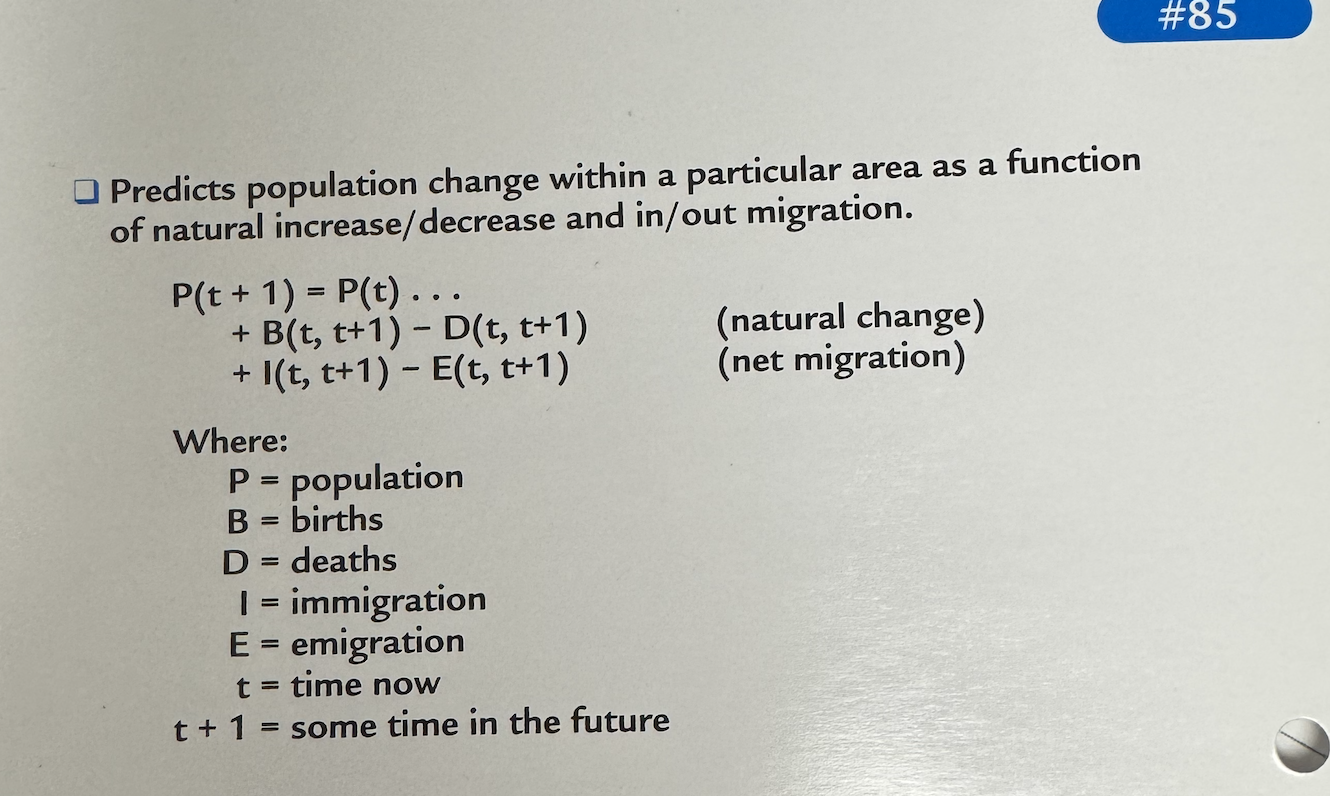
Demographic Accounting Equation
• Predicts population change within a particular area as a function of natural increase/decrease and in/out migration.
P(t + 1) = P(t) .. •
+ B(t, t+ 1) - D(t, t+1)
+ I(t, t+1) - E(t, t+1)
(natural change)
(net migration)
p = population
B = births
D = deaths
| = immigration
E = emigration
t = time now
Demographic Momentum
• Tendency of a population to continue to grow in spite of stringent population policies or rapid fertility decline because of the large number of individuals in their childbearing years.
• In countries that implement policies encouraging or enforcing replacement-level fertility rates, it takes several generations before stable growth is achieved because of demographic momentum.
Demographic Transition Model
See Image
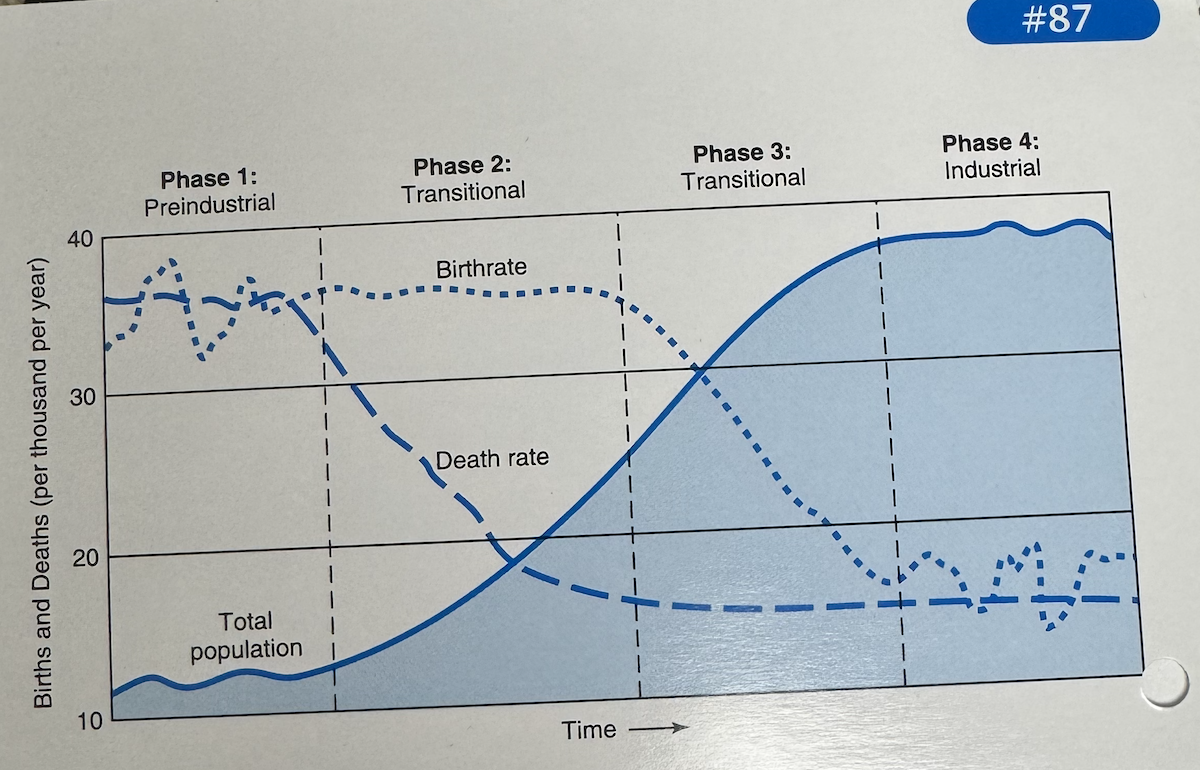
Demographic Transition
• Describes population growth stabilization as a function of economic development.
• In Stage 1 (preindustrialization), a country is characterized by high birth and death rates and little-to-no growth.
• In Stage 2, as the country industrializes, birth rates remain high, death rates drop, and population growth is rapid.
• In Stage 3, birth rates begin to drop as a country becomes fully industrialized.
Stages 4 and 5 describe highly developed countries across the globe where population growth is stable or negative (as is the case in Stage 5).
Dependency Ratio
• A measure of the economic impact of younger and older cohorts on the economically productive members of a population.
• Younger cohorts are typically children under the age of fifteen (ineligible to work); older cohorts are over the age of sixty-four (retired members of a population).
In some countries the dependency ratio includes only males in the economically productive cohort if the local culture prohibits women's participation in the workforce.
Global Growth Doubling Time
• Doubling is the amount of time it will take a particular population to double in size.
• Countries with growth rates of 1 percent take approximately 70 years to double their population, whereas countries with 2 percent growth rates take only 35 years to double.
When this growth rate is graphed, a J-curve represents the exponential growth.
In the last couple of decades, growth rates have declined. Population follows more of an S-curve, meaning greater stability.
Ecumene
• The proportion of the earth's surface that's inhabited by humans.
Global Population Distribution Patterns
• Sixty percent of the world's population lives within 60 miles
(98 kilometers) of the ocean.
• Population concentrates in areas with high soil arability/fertility, which also tend to have mild climates.
• Population is becoming more urban.
• Currently a little over half of the global population is urban with much higher rates in highly developed regions.
Global Refugee patterns
• Post-September 11th security issues have led many countries of the world, particularly Western Europe and North America, to tighten borders to individuals seeking asylum.
• In many African countries, borders are open to refugees such that countries in which refugees are fleeing from also host significant refugee populations.
• For example, several million refugees have fled Sudan as a result of civil war, but Sudan also hosts numerous refugees from neighboring countries.
Guest Workers
• Individuals who migrate temporarily to take advantage of job opportunities in other countries.
• Send a significant portion of their pay, called remittances, back home to support friends and family.
• In some countries, remittances are a significant source of income for the national economy.
HIV / AIDS
• A major and dramatic exception to recent population growth trends, particularly in the developing world, where the epidemic is having great effects on birth rates, death rates, and life expectancy.
• Currently the third most common cause of death worldwide and expected to surpass Black Death of the fourteenth century as history's worst-ever epidemic.
• Sub-Saharan Africa, particularly hard-hit by this disease, and some other countries, have had life expectancy cut in half with dramatic increases in death rates.
Illegal Immigration
Can be characterized as involuntary But unforced migrants.
Individuals choose to risk risk their lives in the migration decision; a decision that is motivated by dire economic situations within their own country
Infant Mortality
• Number of deaths during the first year of life per thousand live births.
• Tends to be much higher in developing regions as it is strongly related to a country's access to health care services.
Overall, rates have decreased significantly over the last fifty years.
Internal Migration History of the United States
• The most significant internal migration movements in the United States can be characterized in three waves:
• Wave 1: beginning with colonization, a movement of the population westward and movement from rural to urban areas as places become increasingly industrialized.
• Wave 2: from the early 1940s through the 1970s a massive movement of African Americans from the rural south to cities in the South, North, and West.
• Wave 3: post-World War II to the present day movement to the sun belt states (the fifteen states from North Carolina to Southern California and all the states south of that line).
Internally Displaced Persons
People who have had to leave their home because of conflict, human rights abuse, war, or environmental catastrophes, but do not leave their country to seek safety.
• A good example in the United States is the individuals whose homes were destroyed by Hurricane Katrina in
August 2005.
Life Expectancy
• Average number of years a person can be expected to live.
• Number varies globally with highly developed countries experiencing much higher life expectancies than developing countries.
• Varies within countries, within cities, among ethnicities, and even between sexes.