elasticities
1/20
There's no tags or description
Looks like no tags are added yet.
Name | Mastery | Learn | Test | Matching | Spaced | Call with Kai |
|---|
No analytics yet
Send a link to your students to track their progress
21 Terms
PED definition
responsiveness of the quantity demanded of a g/s to a change in it’s price
elasticity values
0 → perfectly inelastic
0<x<1 → relatively inelastic
1 → unitary elastic
1<x<∞ → relatively elastic
∞ → perfectly elastic
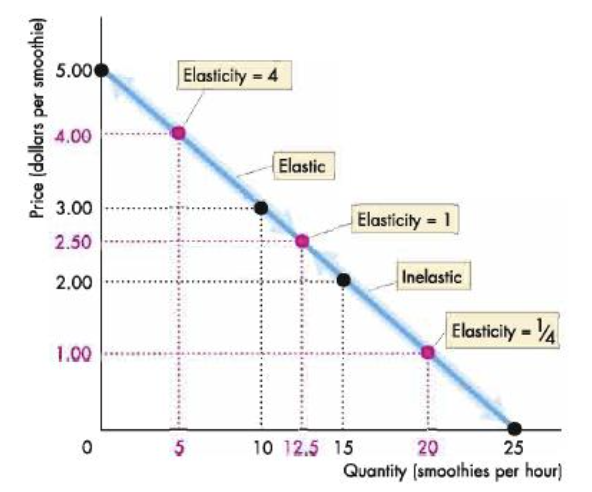
PED on a straight line demand curve
there are different PED values on a straight line demand curve.
Midway point → PED = 1
elasticity decreases as price falls
(above elastic below inelastic)
PED determinants
substitutes → more substitutes + easier to purchase → more price elastic in demand
habits → more addictive → more price inelastic in demand
income → necessity (inelastic) vs luxury (elastic)
time-period → longer time period → price elastic demand
Applications of PED
business pricing decisions
governments’ taxation decisions
business pricing decisions - applications of PED
objective → revenue maximisation
PED is inelastic → businesses raise prices to raise revenue (fall in qt. sold will be more than compensated by the higher price per unit)
when is revenue maximised on demand curve
midway point, PED = 1
Government’s Taxation decisions - applications of PED
(look at graphs after)
governments target products that are relatively price inelastic if the objective is to raise more tax.
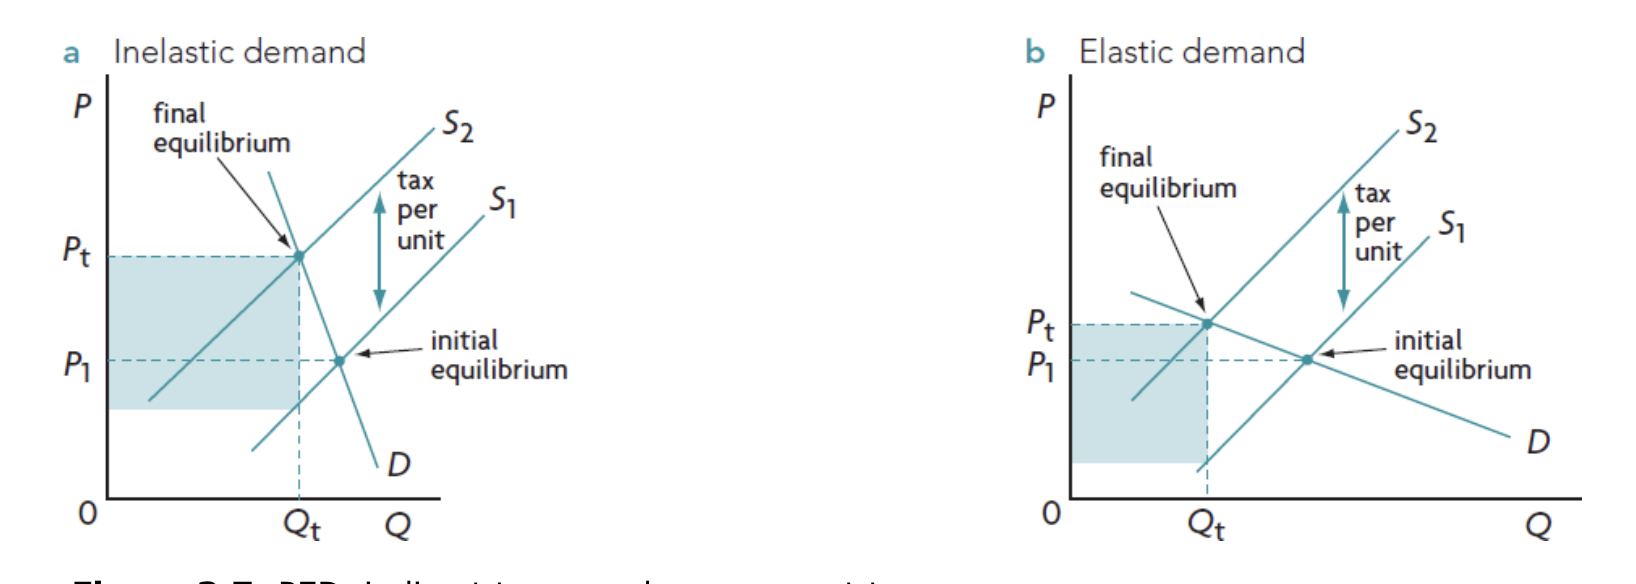
effect of tax on elastic + inelastic products
inelastic demand - people keep buying g/S → high tax revenue
elastic demand → people avvoid tax by not buying the g/s anymore
primary commodities vs manufactured goods
primary commodities → mostly necessity goods (any product produced in primary sector) → relatively inelastic in demand (higher price fluctuation)
manufactured goods → not necessities / a lot of substitutes → relatively elastic in demand
income elasticity of demand (YED)
the relative change in the quantity demanded in response to the relative change in income.
same formula %change quantity demanded / % change in income
income elasticity of demand (YED) values
positive → normal goods
negative → inferior goods
YED>1 → luxury
YED<1 → necessity
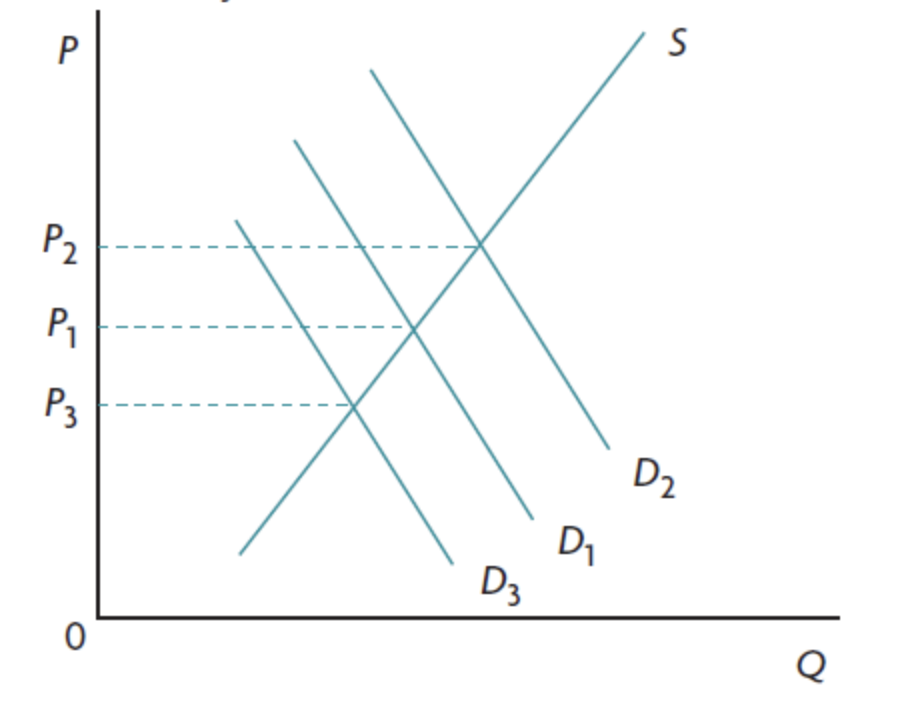
relatively inelastic → small shift in demand curve
relatively elastic → big shift in demand curve
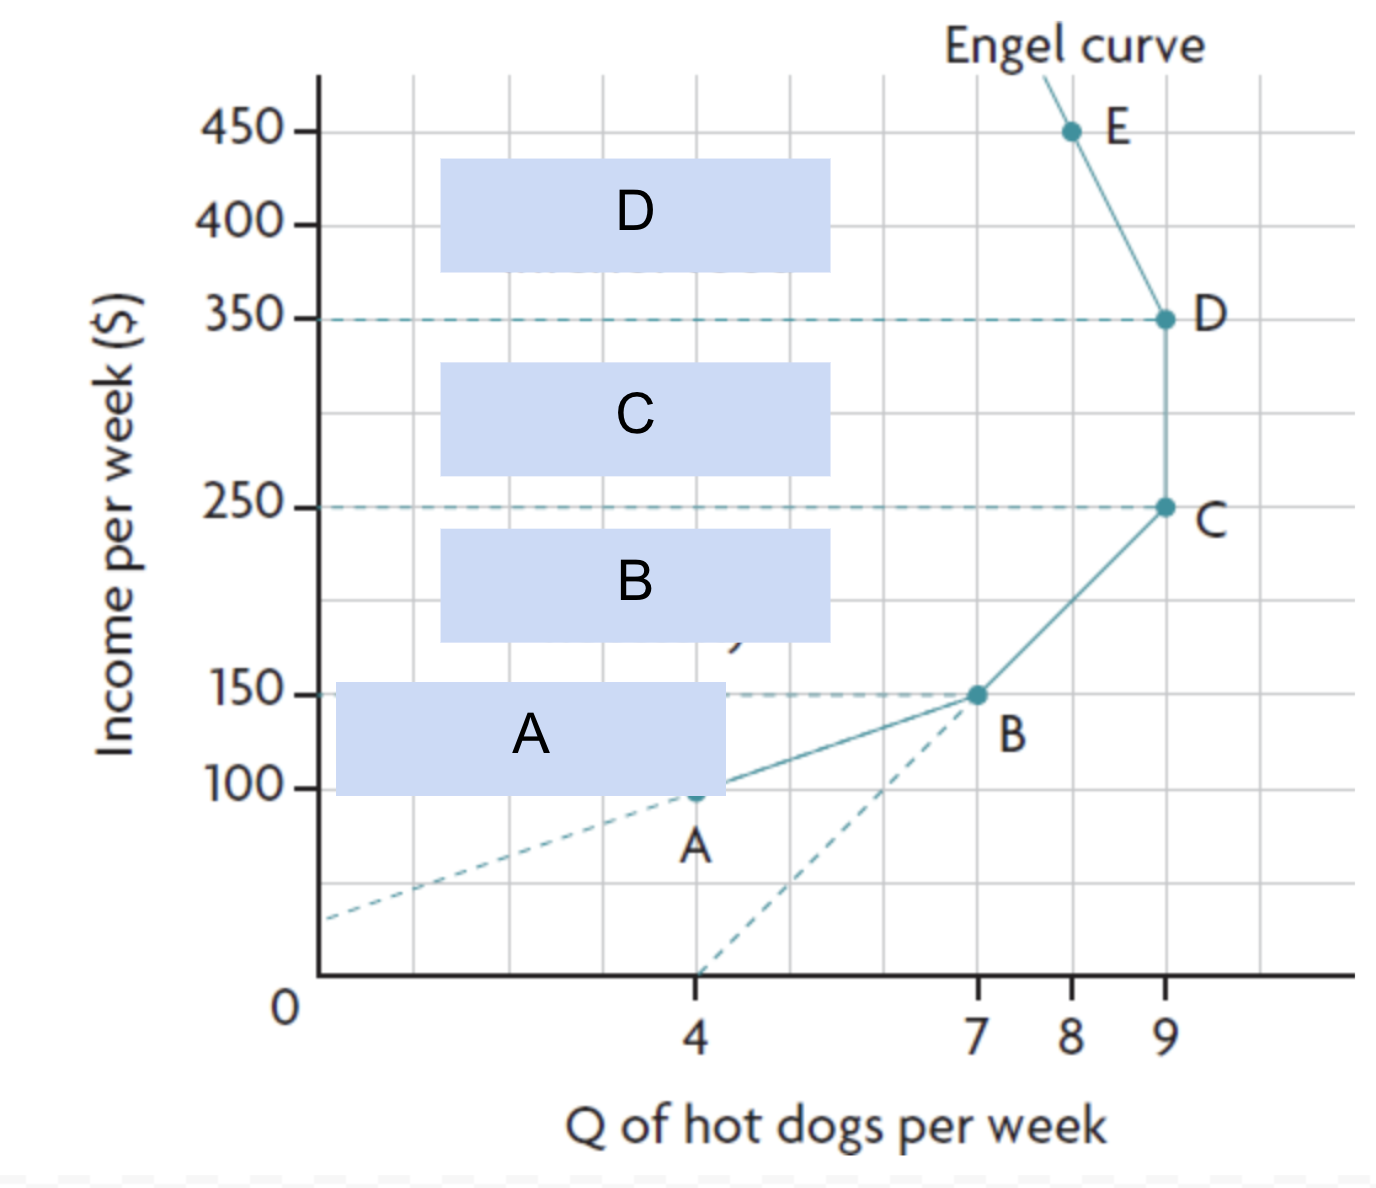
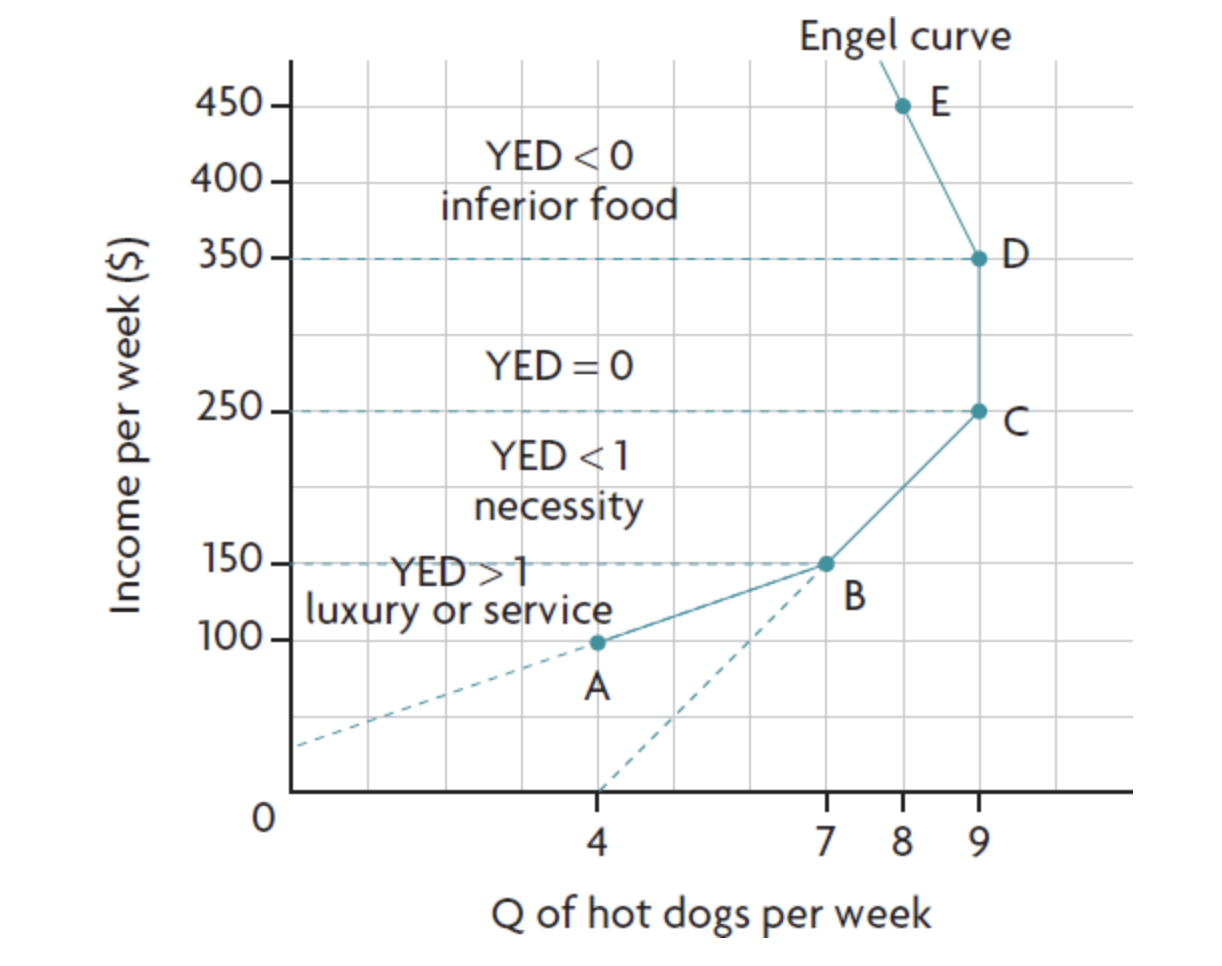
engle curve - label
A - YED>1 → luxury
B - YED<1 → necessity
C - YED=0
D - YED<1 → inferior
applications of YED
growth of industries
structural economic changes
growth of industries - applications of YED
if producer that operates in an industry with a low + positive YED (e.g +0.5) the industry will grow but at a slower rate than those with YED bigger than 1(elastic)
structural economic changes - applications of YED
overtime as manufacturing + service sectors (elastic) grow at a faster rate than the primary sector they gain a large proportion of national income.
PES definition
responsiveness of the quantity supplied of a g/s to a change in the market price of the g/s
Determinants of PES
length of time to adjust input factors and output to changes in price
mobility of factors of production - easier/faster resources can be moved from one process to another → Higher PES
spare capacity
ability to store stocks
rate at which costs per unit increase - smaller the rate of increase of costs per unit the more able are producers to expand their qt. supplied in response to a small increase in price.
primary commodities + manufactured g/s - price elasticity of supply
primary commodities - rel. price inelastic in supply due to taking time to grow/mine + higher scarcity
manufactured g/s - rel. price elastic in supply due to being able to produce output faster
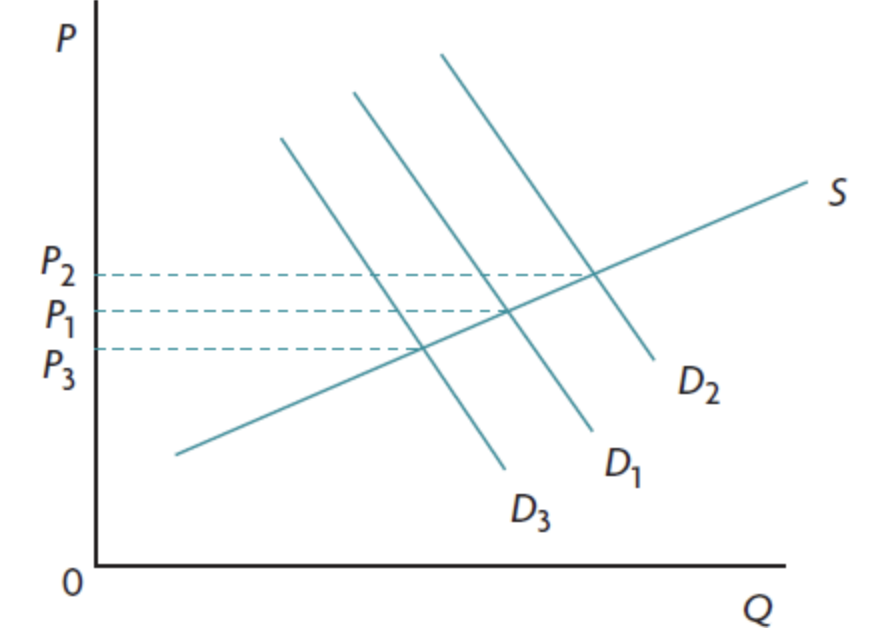
consequences of low PES + PED on primary commodities
rel. inelastic
big change in price → small change in qt. traded
strong price fluctuations
consequences of high PES + PED on manufactured g/s
rel elastic
small changes in price → big change in qt. traded
smaller price fluctuations