Nursing Advanced Concepts and Skills Class 1, 2 and 3
1/64
Earn XP
Description and Tags
DKA, EKG, Virtual Monitoring, Hemodynamics
Name | Mastery | Learn | Test | Matching | Spaced | Call with Kai |
|---|
No analytics yet
Send a link to your students to track their progress
65 Terms
DKA
Occurs when there is no insulin available. Usually an infection triggers the insulin insufficiency
DKA Symptoms
Polyuria
Ketonuria
Hypovolemia (low BP, high heart rate)
Dehydration
Polydipsia
Nausea & vomiting
Kussmaul's respirations
Fruity breath
Anticipated Lab Values
hyperglycemia (bg >13)
H+ increases
pH decreases
CO2 increases
K+
initially hyperkalemia due to lack of insulin
more potassium out of cells
after insulin infusion starts, potassium moves into cells
patient can become hypokalemic (order for potassium)
Ketones increase
Creatinine and BUN increase due to poor kidney function
possible detection of UTI (cause for infection)
DKA Treatment
Treat BP first (Hypertonic infusion)
Insulin infusion runs in tandem with infusion (ratios depend on orders)
Possible potassium infusion after insulin
May switch infusion to Dextrose to prevent hypoglycemia (insulin overdose)
Monitoring
Vital signs
HR increases
BP decreases
RR increases
O2 saturation decreases
blood glucose
EKG - potassium imbalance
Urinalysis - ketones/kidney function/infection
input and output
DKA prevention
regular blood sugars
education
advocacy
EKG Interpretation: 8 Step Approach
1. Heart rhythm (regular or irregular)
2. Heart rate
3. Presence of P wave
4. Calculate PR interval
5. Width of QRS complex
6. ST segment
7. QT interval
8. T wave
Calculate PR interval
atrial depolarization
beginning of P to start of QRS
0.12 - 0.20 seconds
3 to 5 boxes
Width of the QRS complex
ventricle depolarization (Lead II)
0.08 - 0.12 seconds
1½ to 3 boxes
ST segment
if below isoelectric line = myocardial ischemia
if elevated = myocardial infraction
QT interval
time required for depolarization and repolarization of ventricles
0.34 - 0.42
8½ to 10½ boxes
prolonged in some disease states or medications
T wave
ventricular repolarization or relaxation
Peaked T wave = hyperkalemia
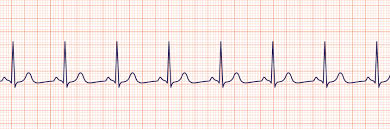
Normal Sinus Rhythm
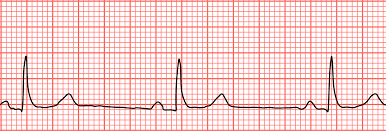
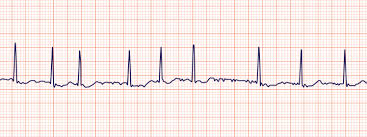
Sinus Bradycardia
Sinus Tachycardia
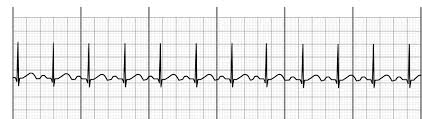
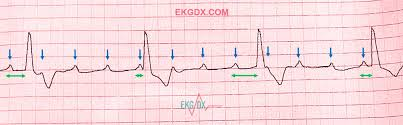
Atrial Flutter
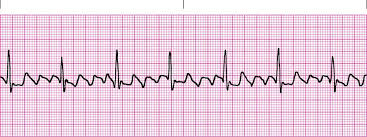
Atrial Fibrillation
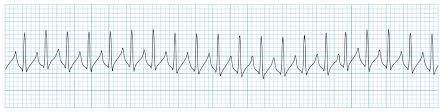
SVT (supraventricular tachycardia)
Ventricular Arrhythmias
PVC (premature ventricular contractions)
VT (ventricular tachycardia)
VF (ventricular fibrillation)
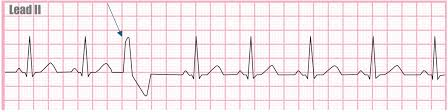
Premature Ventricular Contractions
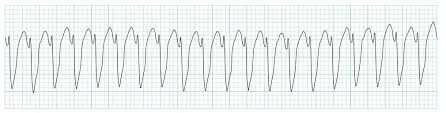
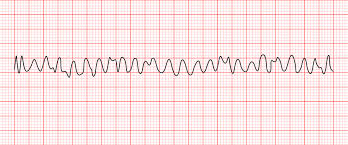
Ventricular Tachycardia (monomorphic)
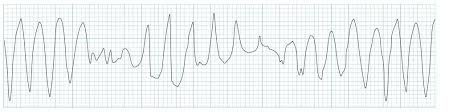
Ventricular Tachycardia (polymorphic)
Ventricular Fibrillation
heart blocks
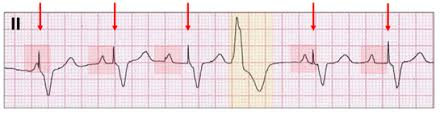
Third degree heart block
regular P waves
regular QRS complex
more P waves than QRS complex
each beating to the beat of their own drum
no correlation between P waves and QRS complex
Ventricular pacemaker rhythm (single chamber)
Narrow Complex Tachycardias
A Fib
A Flutter
SVT
Atrioventricular pacemaker rhythm (Dual chamber)
Adenosine
Sinus Tachycardia
SVT
Amiodarone
A Fib
V Fib
V Tach
Atropine
Sinus Brady
3rd Degree Heart Block
Asystole
Beta Blockers
Sinus Tachy
A Flutter
A Fib
Digoxin
A Fib
A Flutter
Heart Failure
Diltiazem
Sinus Tach
Dopamine
Sinus Brady
Epinephrine
Sinus Brady
V Tach
Asystole
V Fib
Lidocaine
V Tach
V Fib
PVC
Metoprolol
Narrow Complex Tachycardia
A Fib
A Flutter
SVT
Norepinephrine
Acute Hypotension
Cardiac Arrest
Types of Remote Patient Monitoring
wearable devices
pacemakers + cardioverter defib
inhaler sensor
non-invasive ventilation
BP monitors
Nursing Care and Services of Remote Patient Monitoring
Assessment, initiation, and evaluation of the treatment plan
Education
Counselling
Health Care Monitoring
Benefits of Remote Patient Monitoring for HCP
Reduced operational costs
Improved management of patients with chronic illness
Improved patient outcomes
Can monitor continuously between clinic visits, sometimes unreported symptoms are caught
Identify deterioration earlier and provide prompt care
Reduce “White Coat Syndrome”
Benefits of Remote Patient Monitoring for Patients
Can serve rural and remote areas
Emergency consultation with specialists
Reduced travel
Can stay at home – reduce unnecessary clinic/ER visits
Early symptom management and connection between patients and clinicians
Timely assurance about symptoms
Personalized health care and data management
Ability to make self care decisions – better compliance
Allows for habit changes by seeing data – better control over their disease
Can show condition is improving
Risks of Remote Patient Monitoring
Digital health literacy
Accuracy of wearable devices
High cost of devices
Complexity of data analysis
Lack of integration with electronic medical record
Increased stress over changes in symptoms –increases patient anxiety
Increased practitioner workload
Hard to determine what is valuable vs extraneous data
Data is maintained by a third party....Apple?
Privacy concerns
Data accuracy
Lack of trust in technology
May postpone contact or required visits
Virtual Nursing Practice
appropriate technology
appropriate duty of care
level of assessment required vs reality level completed virtually
correct use of tools
appropriate employment support
Preload
degree of ventricular stretch before next contraction
afterload
the amount of resistance the ventricles overcome to deliver the stroke volume
contractility
strength of contraction
Stroke Volume
determined by preload, afterload and contractility
affects CO and BP
Arterial Line
Invasive hemodynamic monitoring of BP
monitors systolic, diastolic and MAP
MAP
Mean Arterial Pressure
MAP → 70 - 105 mmHg
MAP = (systolic + 2(diastolic)) ÷ 3
indications for an Arterial line
Evaluate unstable pts
acute hyper or hypotension
shock
monitor vasoactive drugs
frequent blood samples for ABG
Arterial line sites
radial
brachial
femoral
Central Venous Pressure (CVP)
aka Right Arterial Pressure (RAP)
Normal value is 2-8 mmHg
Measures right ventricular preload
Often used to trend fluid status
Elevated CVP - right ventricular failure or volume overload
Low CVP – hypovolemia
Why Central Venous Pressure Monitoring
Measure right heart filling pressures
Estimate fluid status
Guide volume resuscitation
Assess central venous oxygen saturation
Administer large-volume fluid resuscitation or medications
Administration of vesicant medications
Access to place transvenous pacemake
Central Venous Pressure sites
Subclavian vein
Internal Jugular
Femoral Vein
Pulmonary Artery Pressure Monitoring
PA catheter aka Swan-Ganz catheter
Most invasive technology for hemodynamic measurement
Not used as frequently anymore
Assess left heart function
Identify and treat cause of hemodynamic instability
Assess pulmonary artery pressures
Assess mixed venous oxygen saturation
Directly measures cardiac output
PAP Monitoring sites
large vein
Subclavian vein
Internal Jugular
PA Catherter lumens
5 lumens
distal lumen port is in the PA – measures pulmonary artery pressure
Proximal lumen ports are in the right atrium and the right ventricle – measure central venous pressure
The balloon inflation valve is used to inflate the balloon with air to allow reading of the PA wedge pressure.
A thermistor located near the distal tip senses PA temperature and is used to measure thermodilution cardiac output when the solution is cooler than body tempreture is injected into proximal port
Complications of PA Insertion
Hemothorax
Pneumothorax
Perforation of vena cava, cardiac chamber, or pulmonary artery
Cardiac dysrhythmia - especially when passing through right ventricle
Pulmonary Artery Wedge Pressure (PAWP)
Aka Left Atrial Pressure (LAP)
Used to estimate left ventricular preload
6-12 mmHg
The PAWP is obtained when the balloon of the PAC is inflated to wedge the catheter from the PA into a small capillary. The resulting pressure reflects the left atrial pressure and left ventricular end-diastolic pressure (LVEDP) or ventricular filling pressures when the mitral valve is open. When properly assessed, the PAWP is a reliable indicator of left ventricular function.
Pulmonary Artery Wedge Pressure
Increased PAWP - increase in left ventricular blood volume
Fluid volume excess (IV fluids, renal dysfunction)
Impending left ventricular failure (MI)
Decreased PAWP – decrease in left ventricular blood volume
Fluid volume deficit (dehydration, diuretics, hemorrhage)
Venous Oxygen Saturation (SvO2)
60 - 80%
CVP and PA can include sensor to measure SvO2
compare with arterial O2
decreased SvO2
decreased arterial O2
low hemoglobin
increased O2 consumption
increased SvO2
increased O2 supply
Decreased O2 demand
When is Invasive Hemodynamic Monitoring used?
Septic Shock
Heart Failure
Surgery and Perioperative Care
Trauma and Hypovolemic Shock
Why is invasive hemodynamic monitoring important?
Guides fluid and drug therapy
Monitors response to therapy
Assesses cardiovascular function
Early detection of deterioration
Evaluates tissue perfusion and oxygenation