Chapter 10 - Behind the Supply Curve: Profit, Production, and Cost
1/77
Earn XP
Description and Tags
Name | Mastery | Learn | Test | Matching | Spaced | Call with Kai |
|---|
No analytics yet
Send a link to your students to track their progress
78 Terms
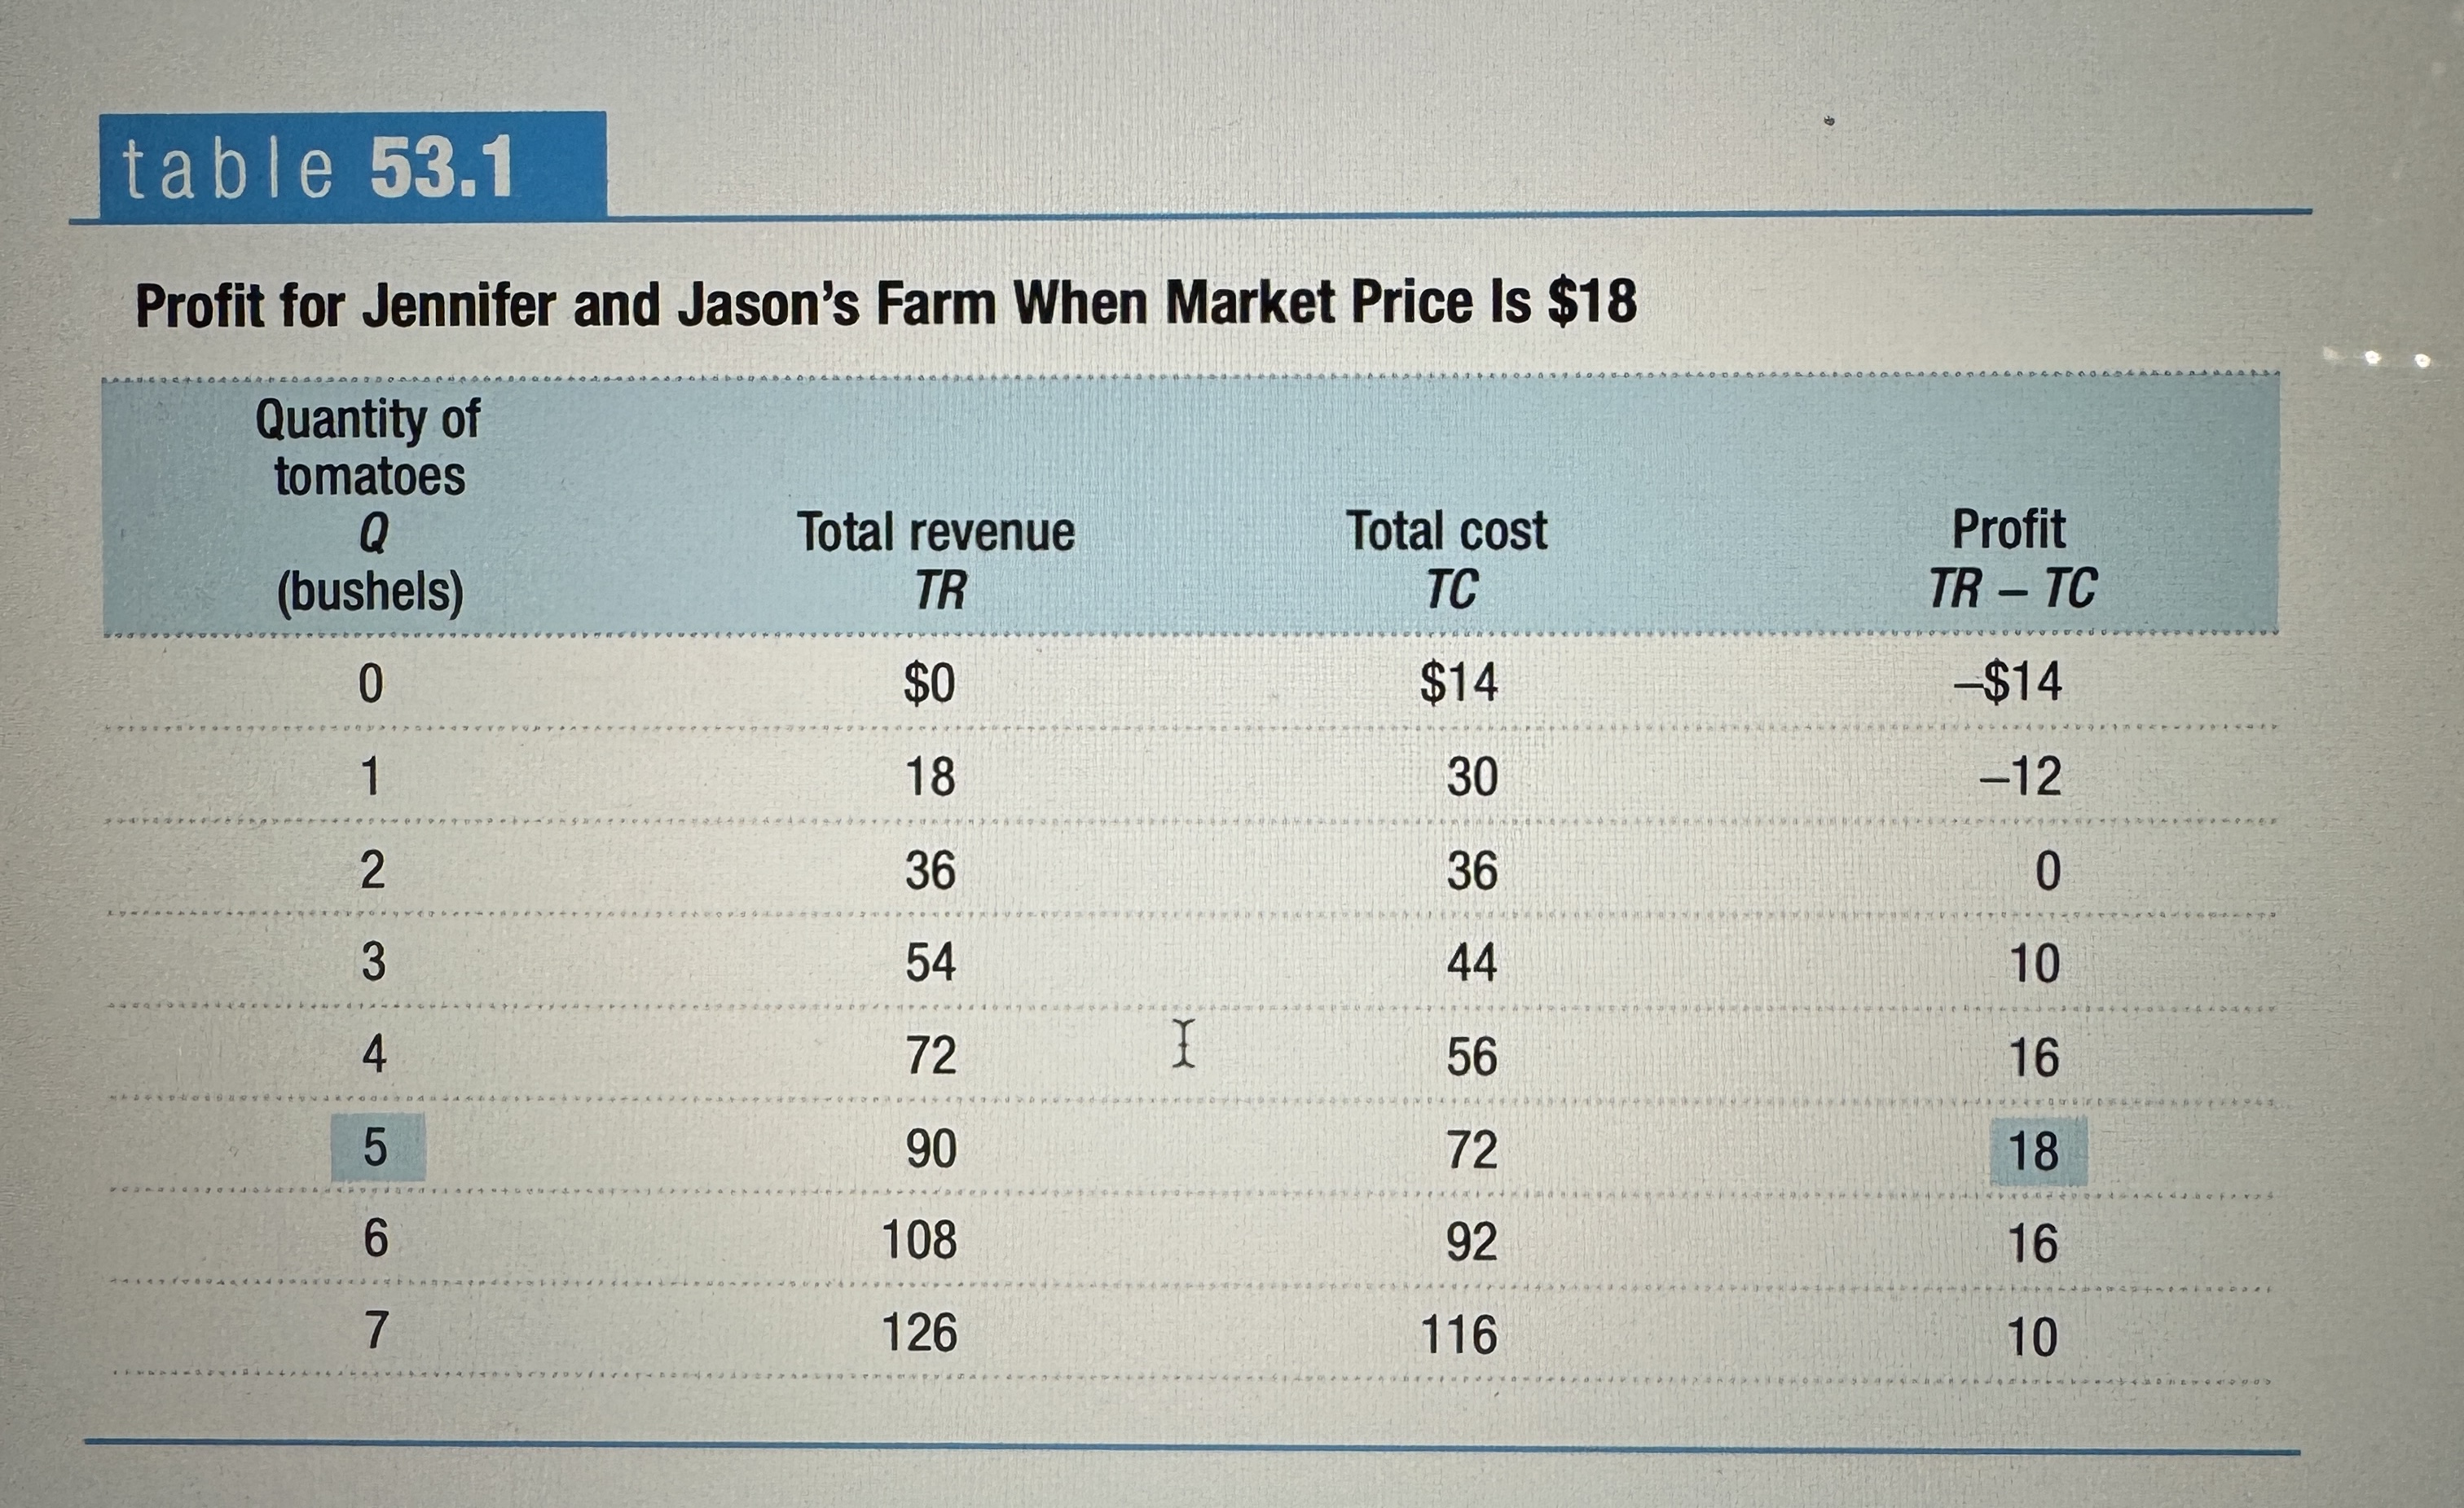
Profit
Profit = Total Revenue - Total Cost
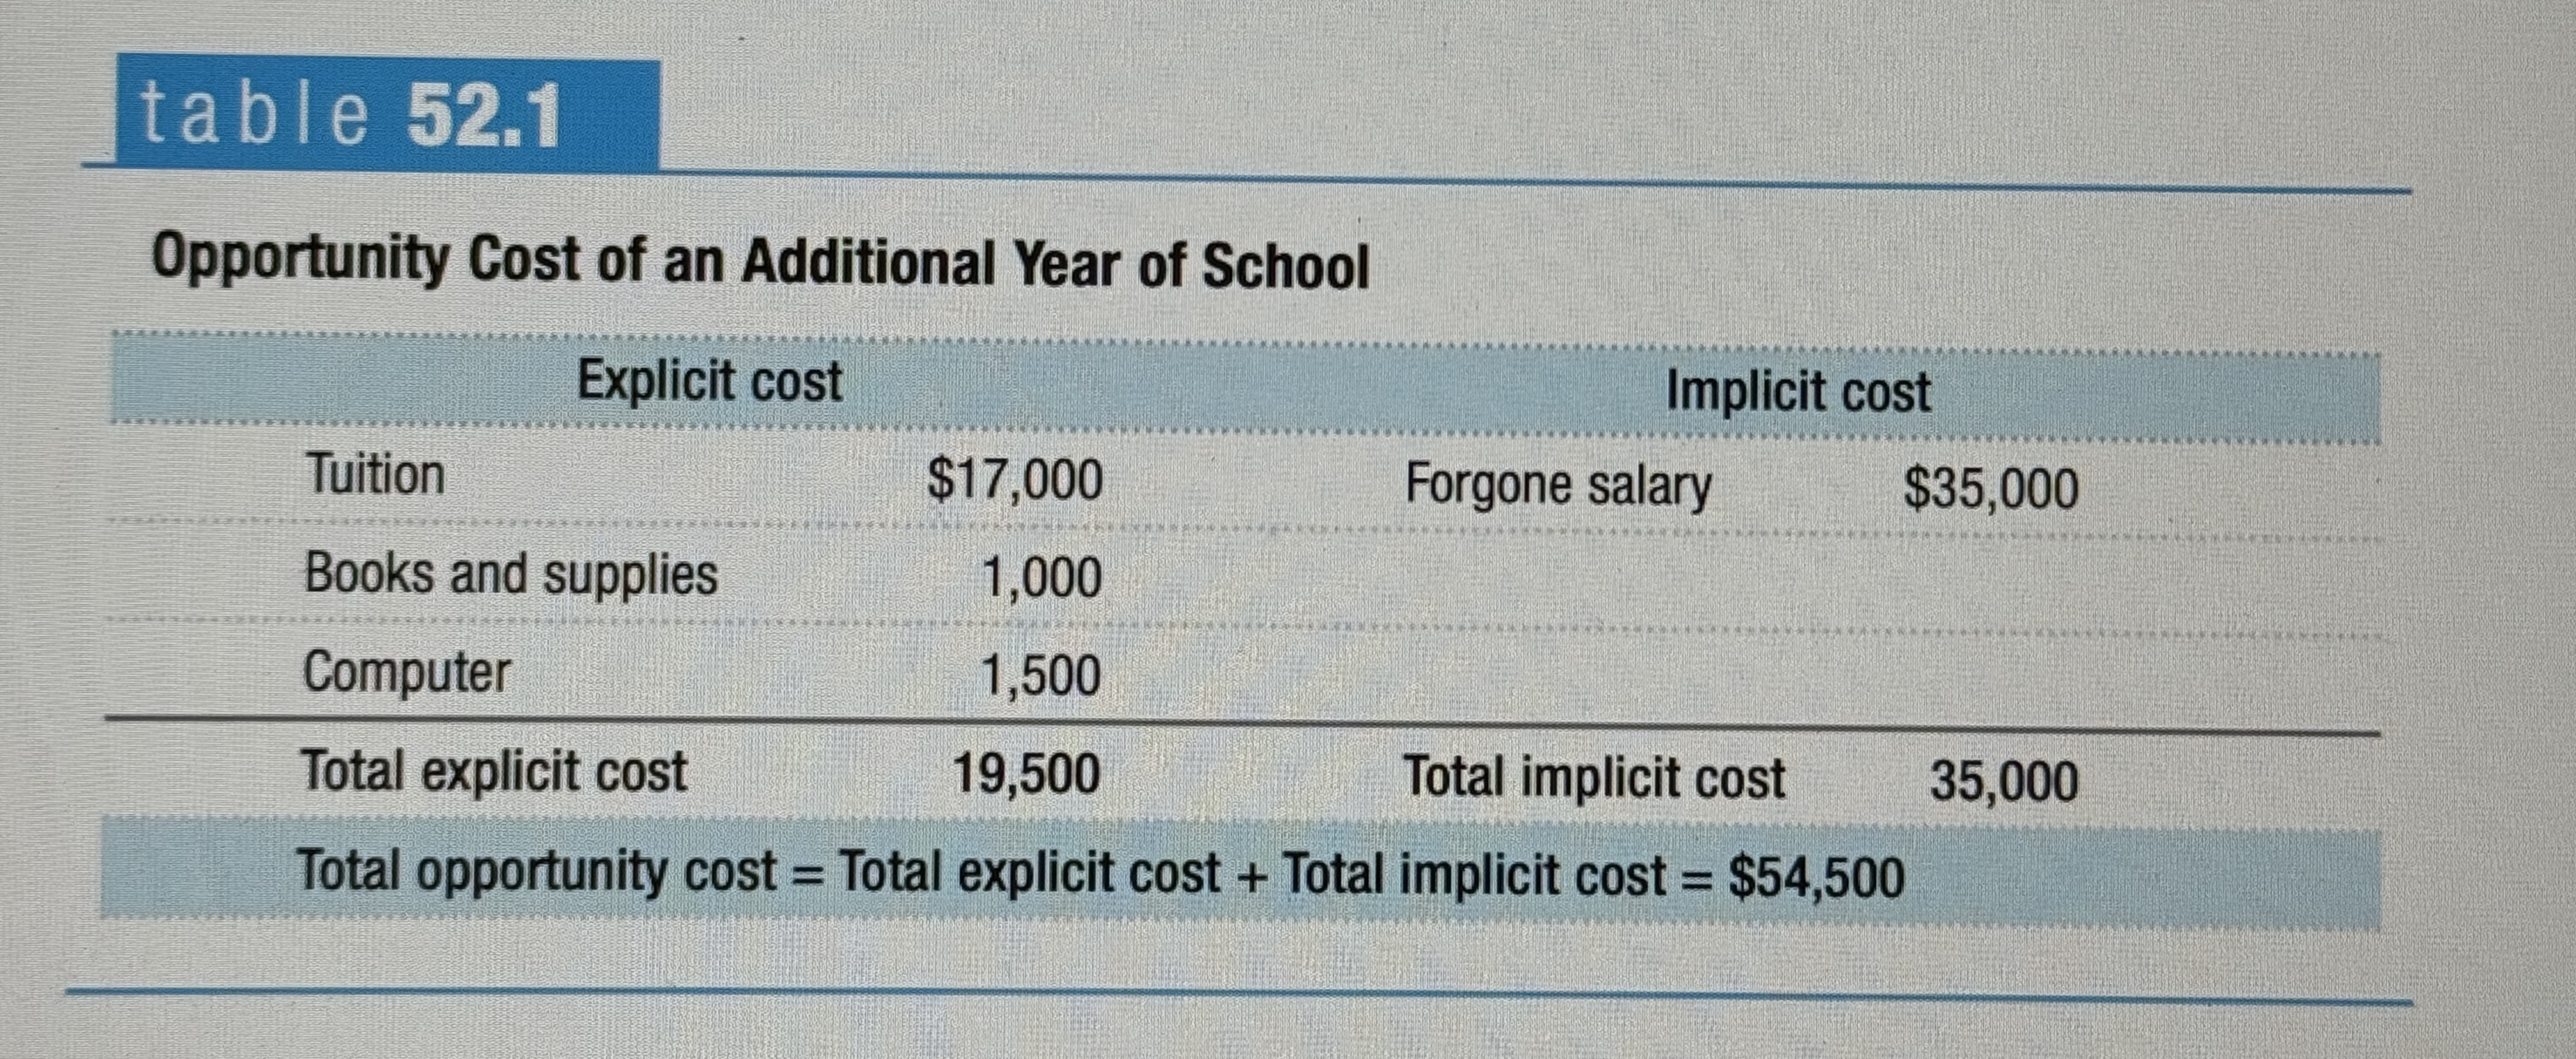
Explicit Cost
A cost that involves actually laying out money.
Implicit Cost
Does not require an outlay of money; it is measured by the value, in terms of dollars, of benefits that are forgone.
Opportunity Cost of an Additional Year of School
Ex.
Accounting Profit
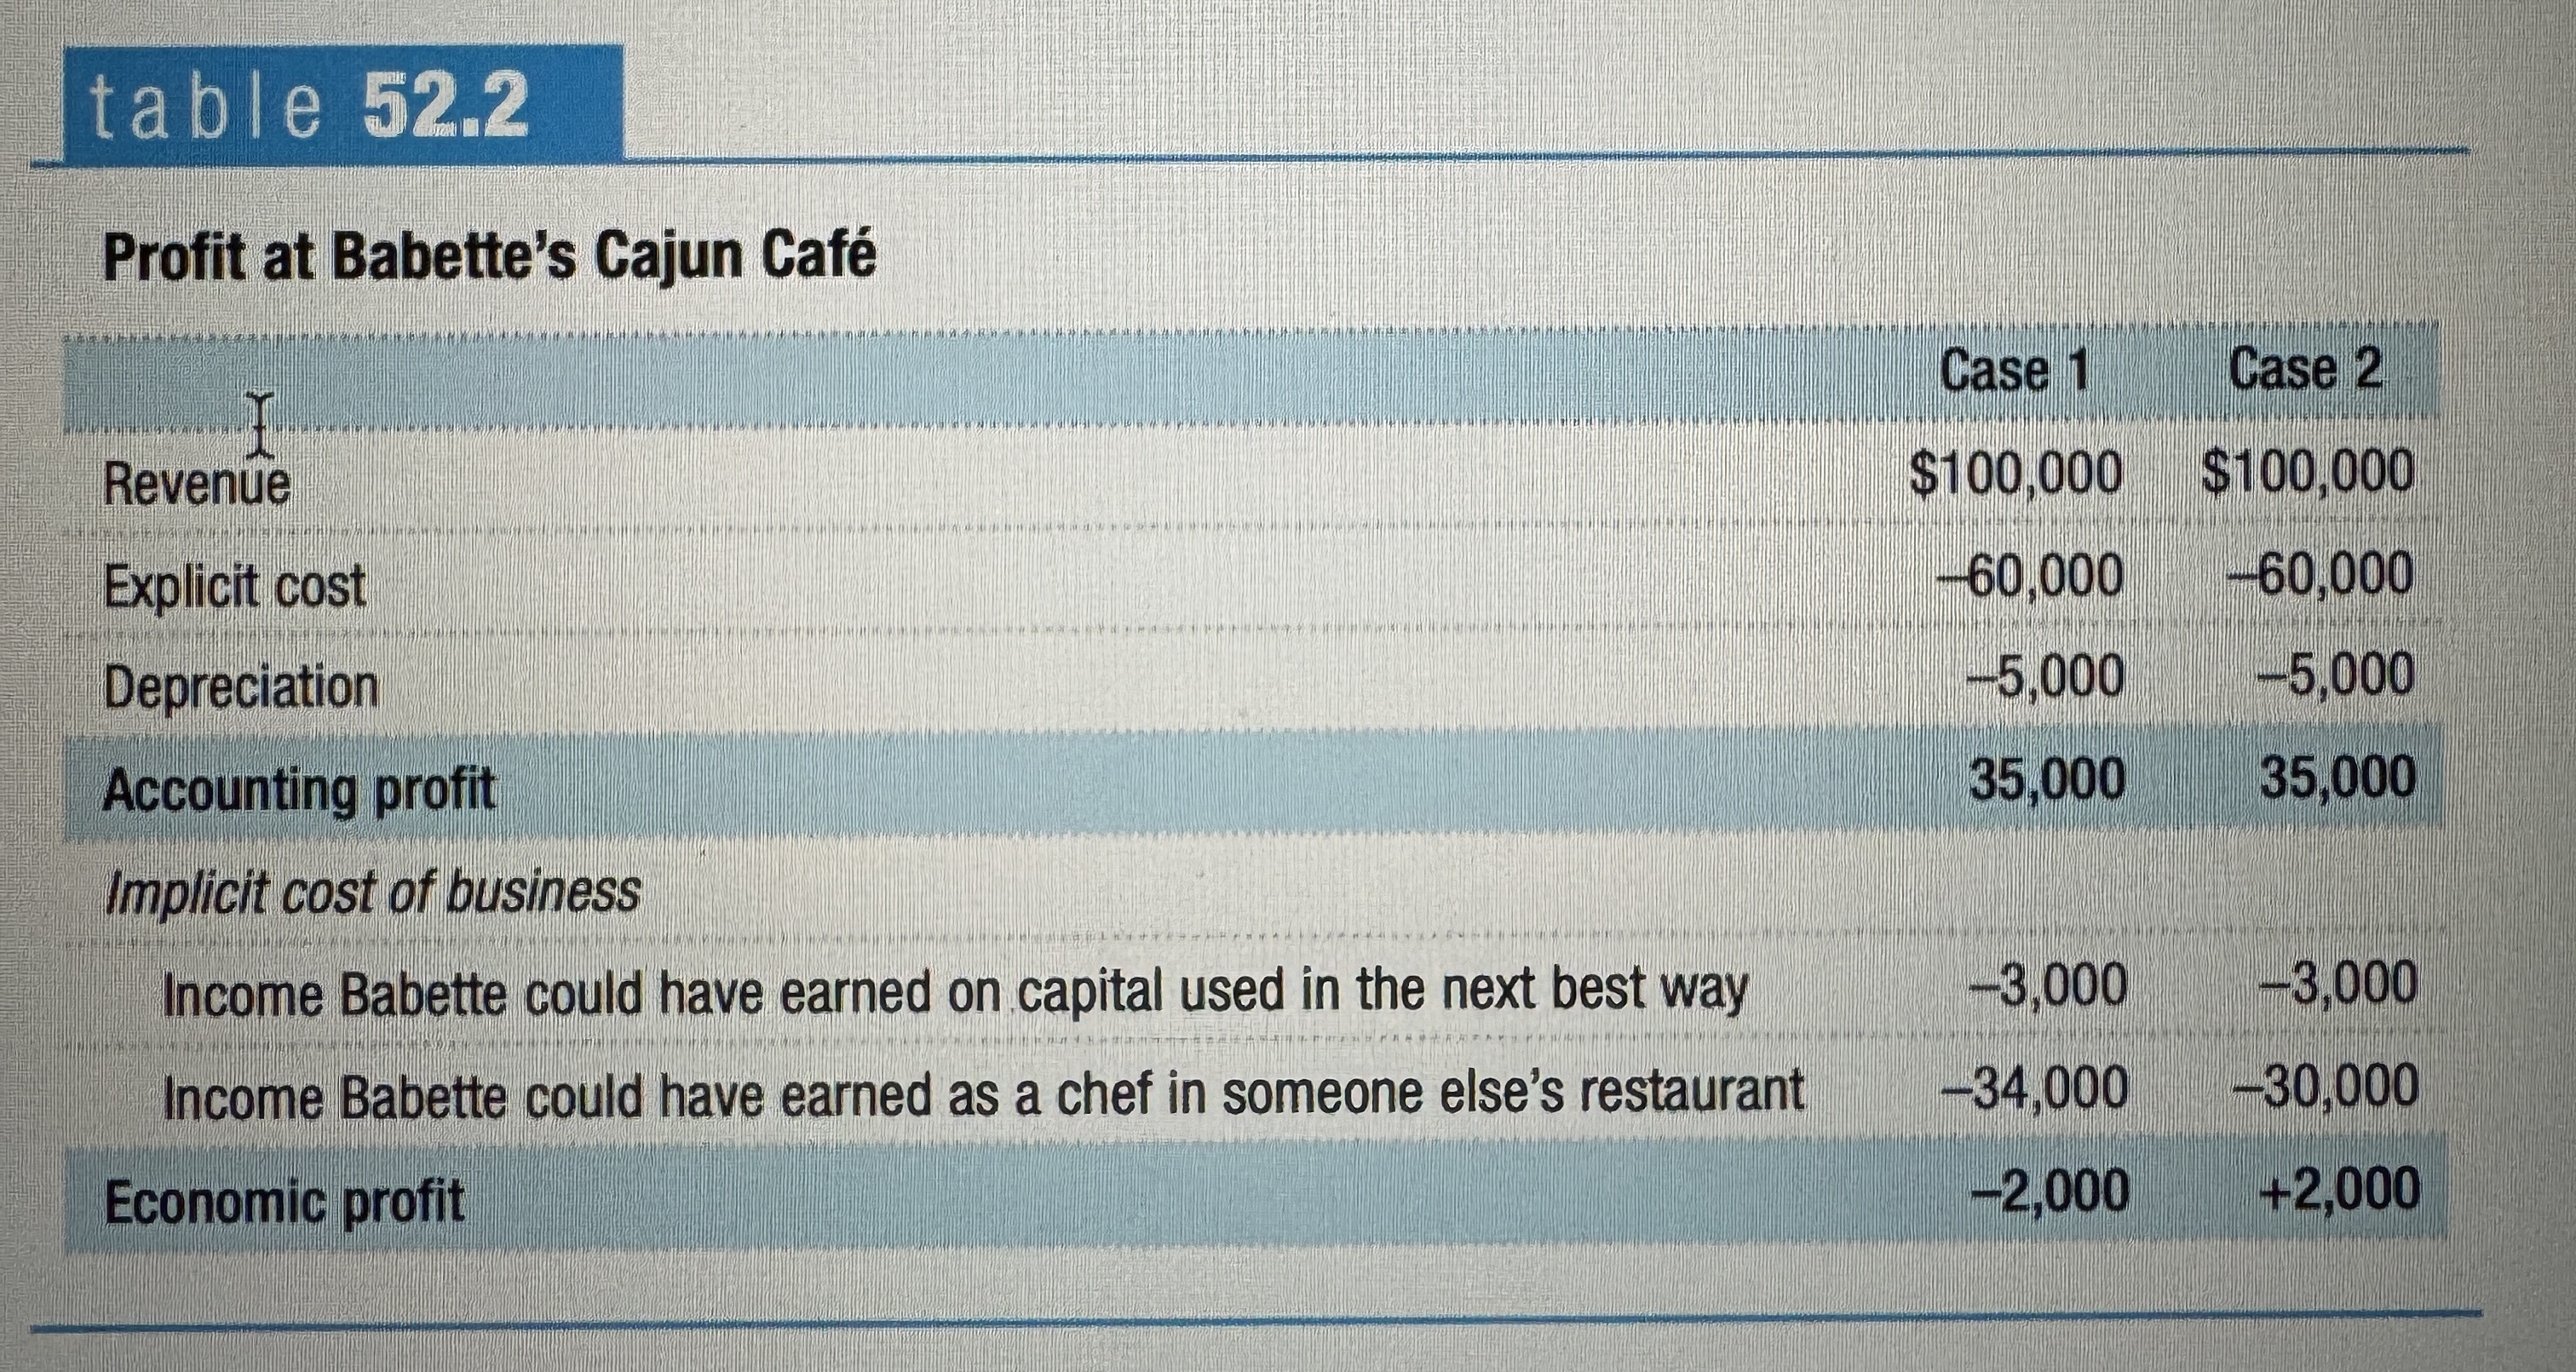
A business’s total revenue minus the explicit cost and depreciation.
Economic profit
The economic profit of a business is the businesses total revenue minus the opportunity cost of its resources. It is usually less than the accounting profit.
Implicit cost of capital
The opportunity cost of the capital used by a business – the income the owner could have realized from that capital if it had been used in its next best alternative way.
Profit at Babette's Cajun Café
Ex.
Normal Profit
An economic profit equal to zero is also known as a normal profit. It is an economic profit, just high enough to keep a firm engaged in its current activity.
Profit for Jennifer and Jason's Farm When Market Price Is $18
Ex.
The Principle of Marginal Analysis
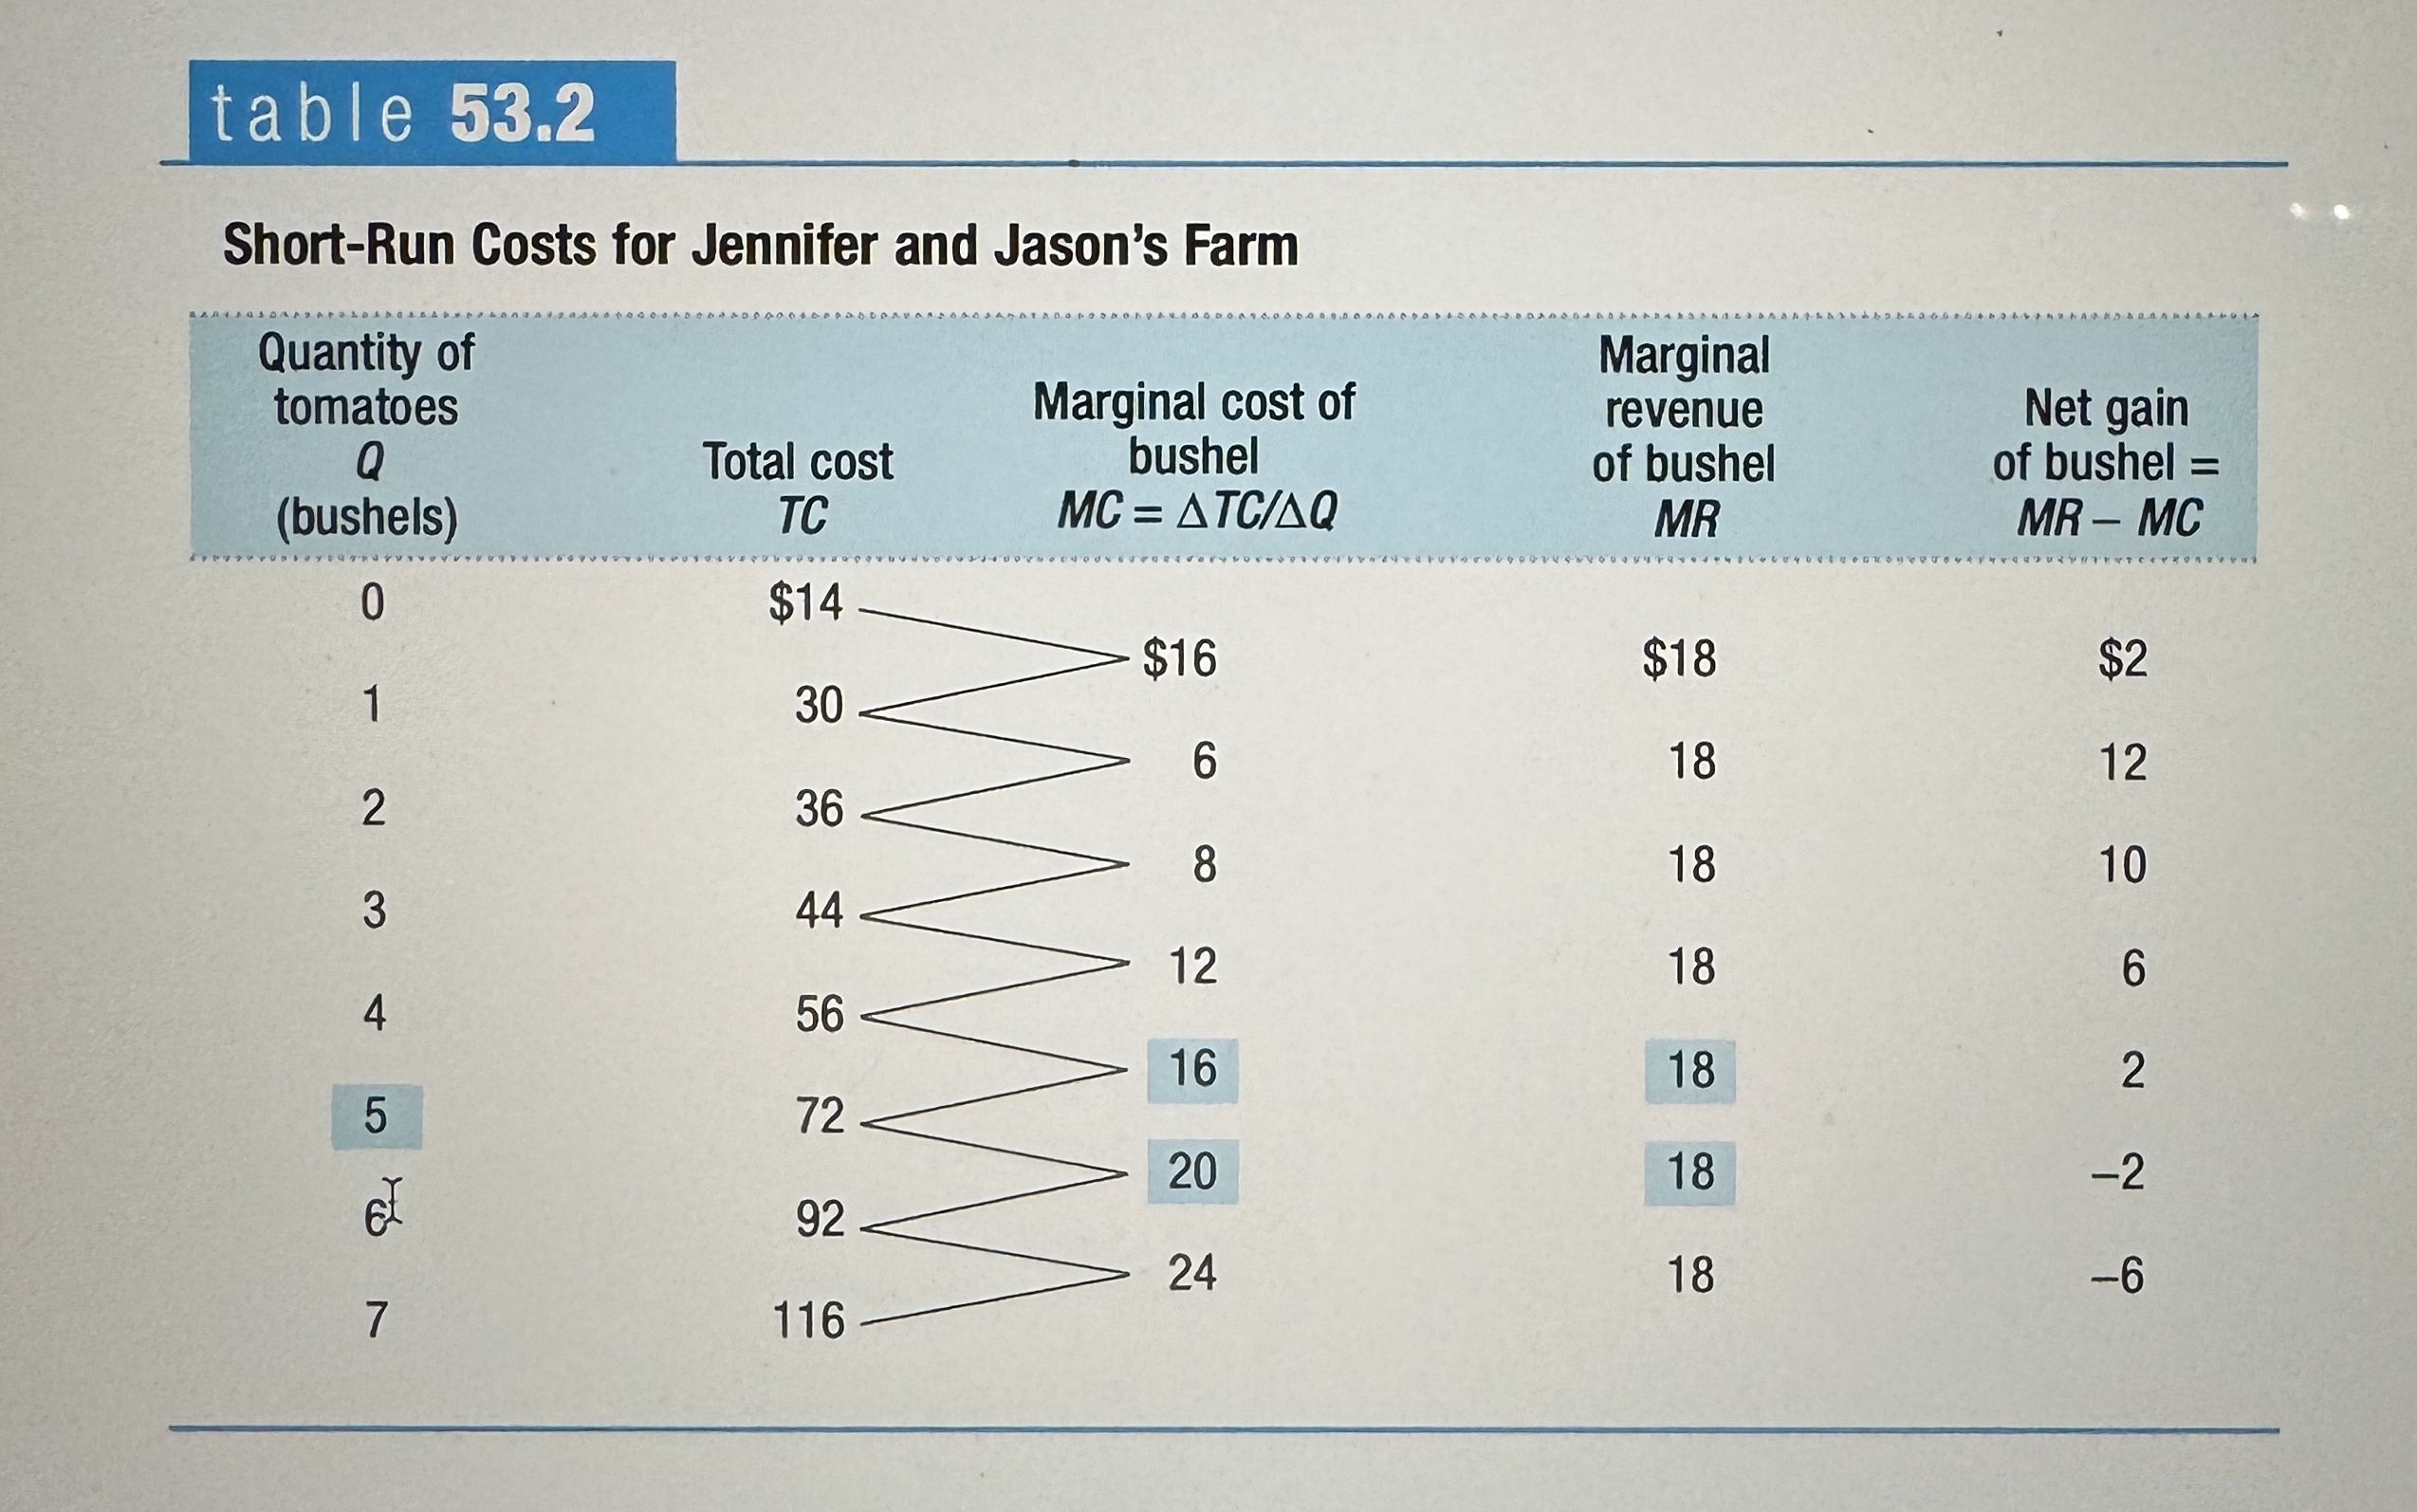
Every activity should continue until marginal benefit equals marginal cost.
Marginal Revenue
The change in total revenue generated by an additional unit of output.

The Optimal Output Rule
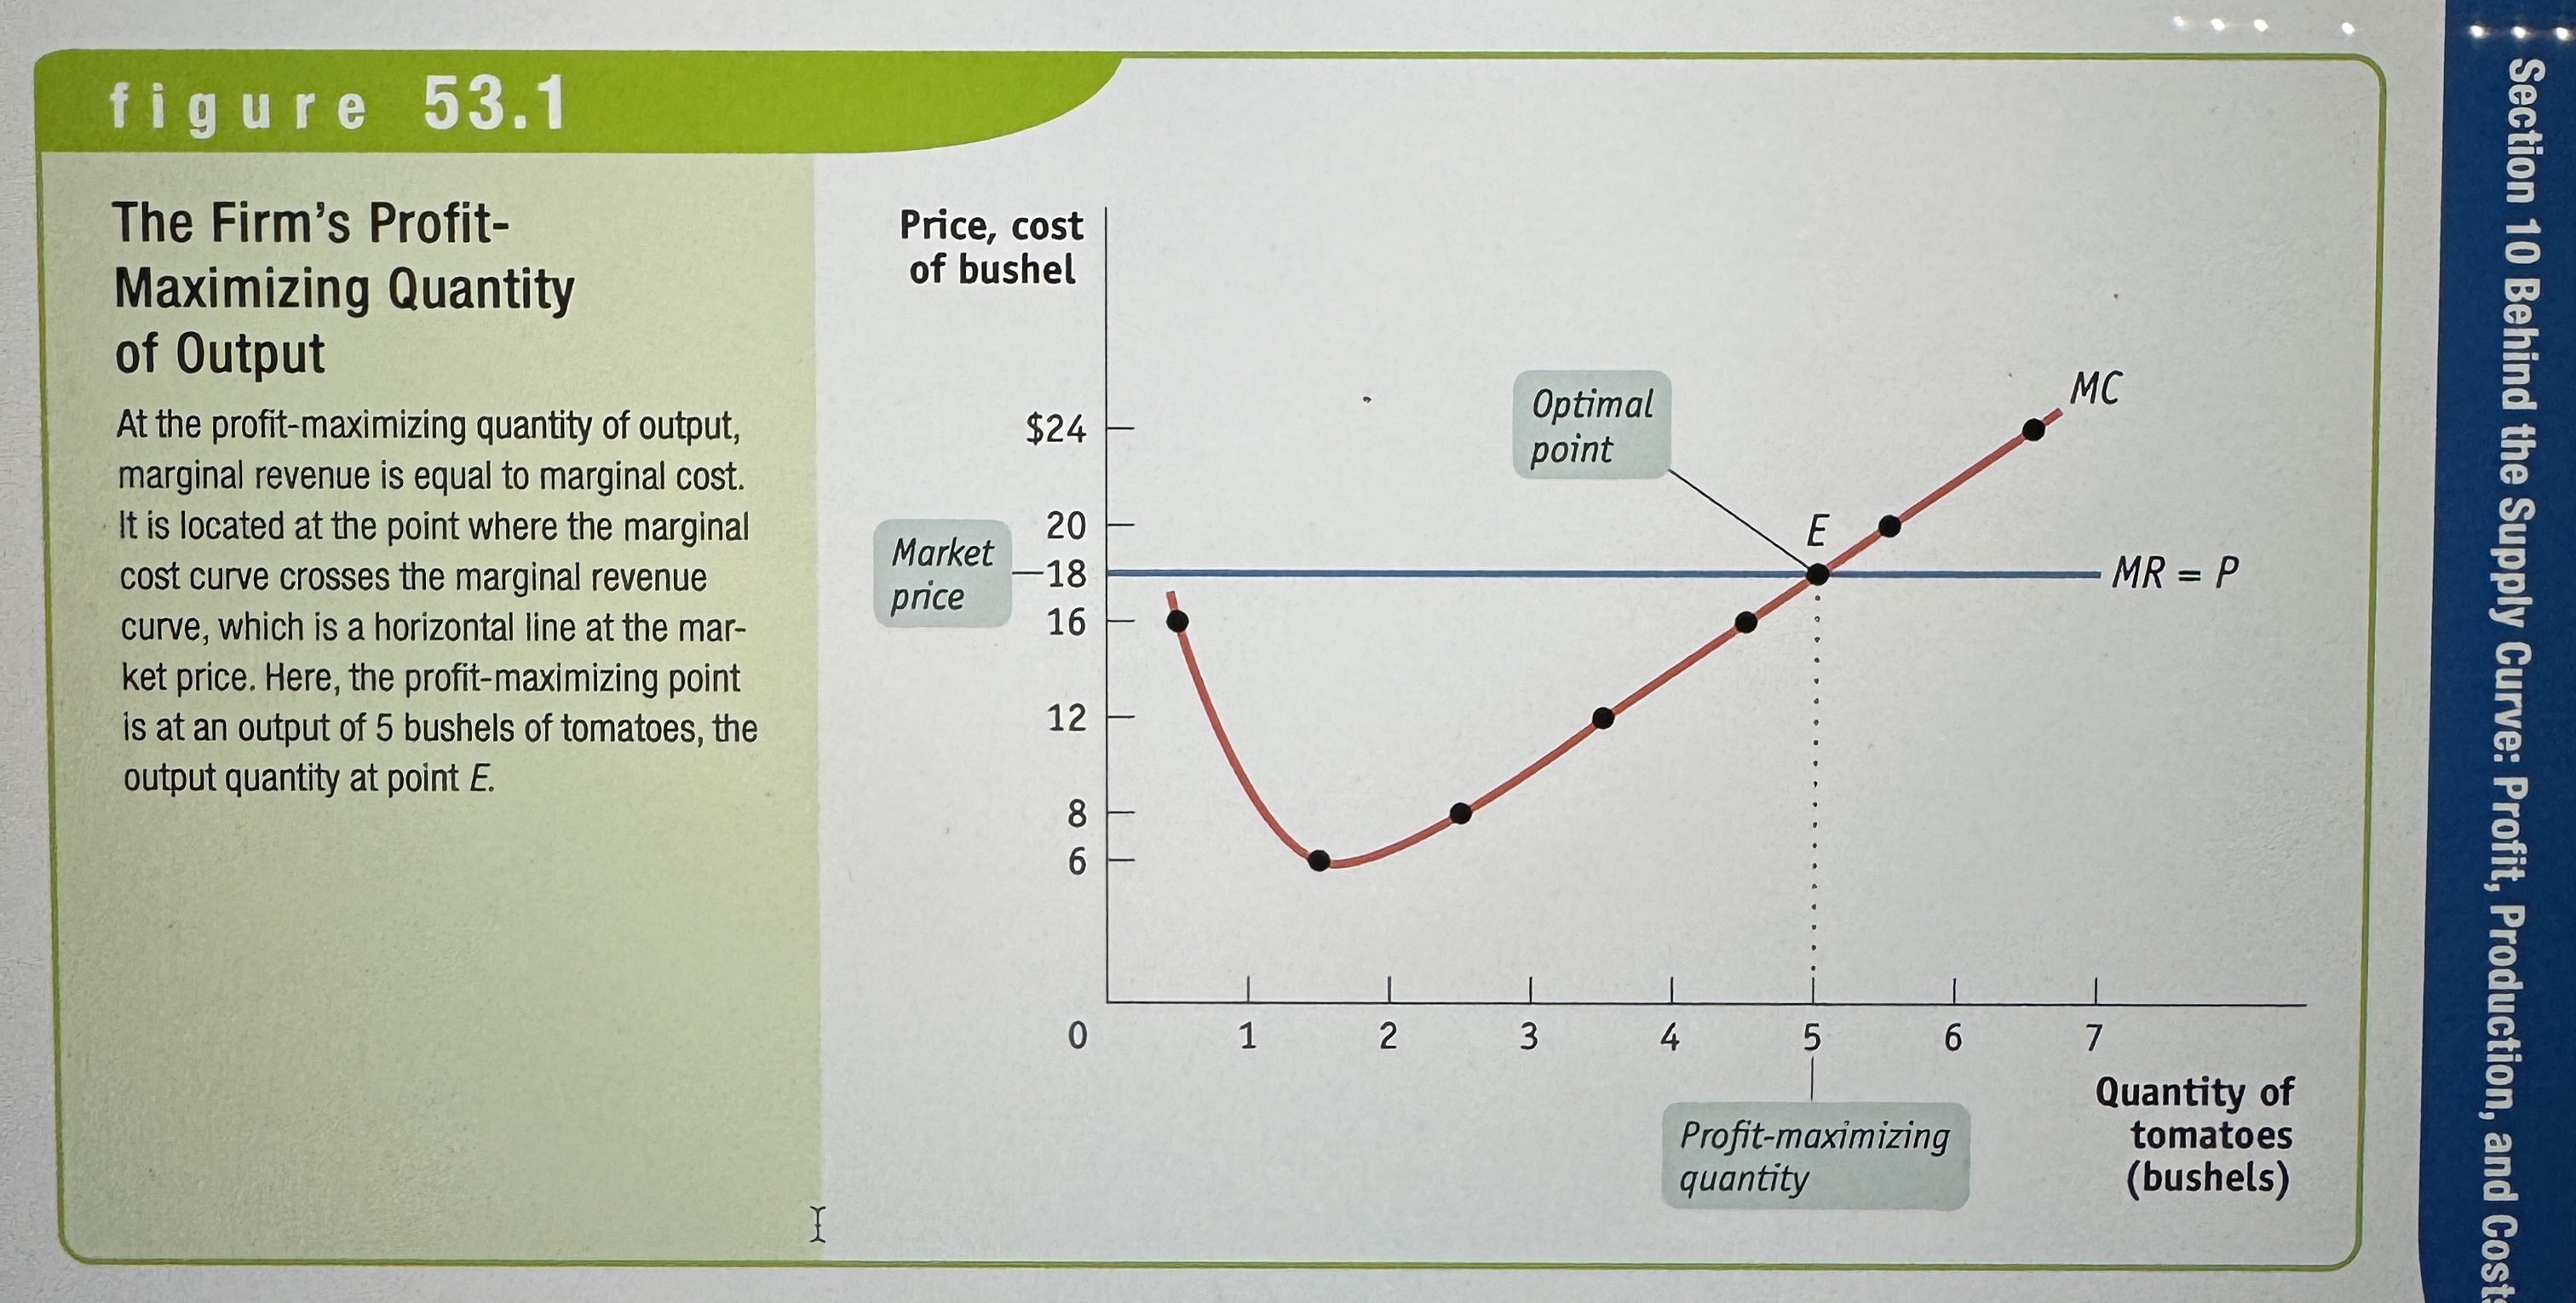
The optimal output rule says that profit is maximized by producing the quantity of output at which the marginal revenue of the last unit produced is equal to its marginal cost.
Short-Run Costs for Jennifer and Jason's Farm
Ex.
Marginal Cost Curve
Shows how the cost of producing one more unit depends on the quantity that has already been produced.
Marginal Revenue Curve
Shows how revenue varies as Output Varies
The Firm's Profit-Maximizing Quantity of Output
Ex.
Production Function
The relationship between the quantity of inputs a firm uses and the quantity of output it produces.
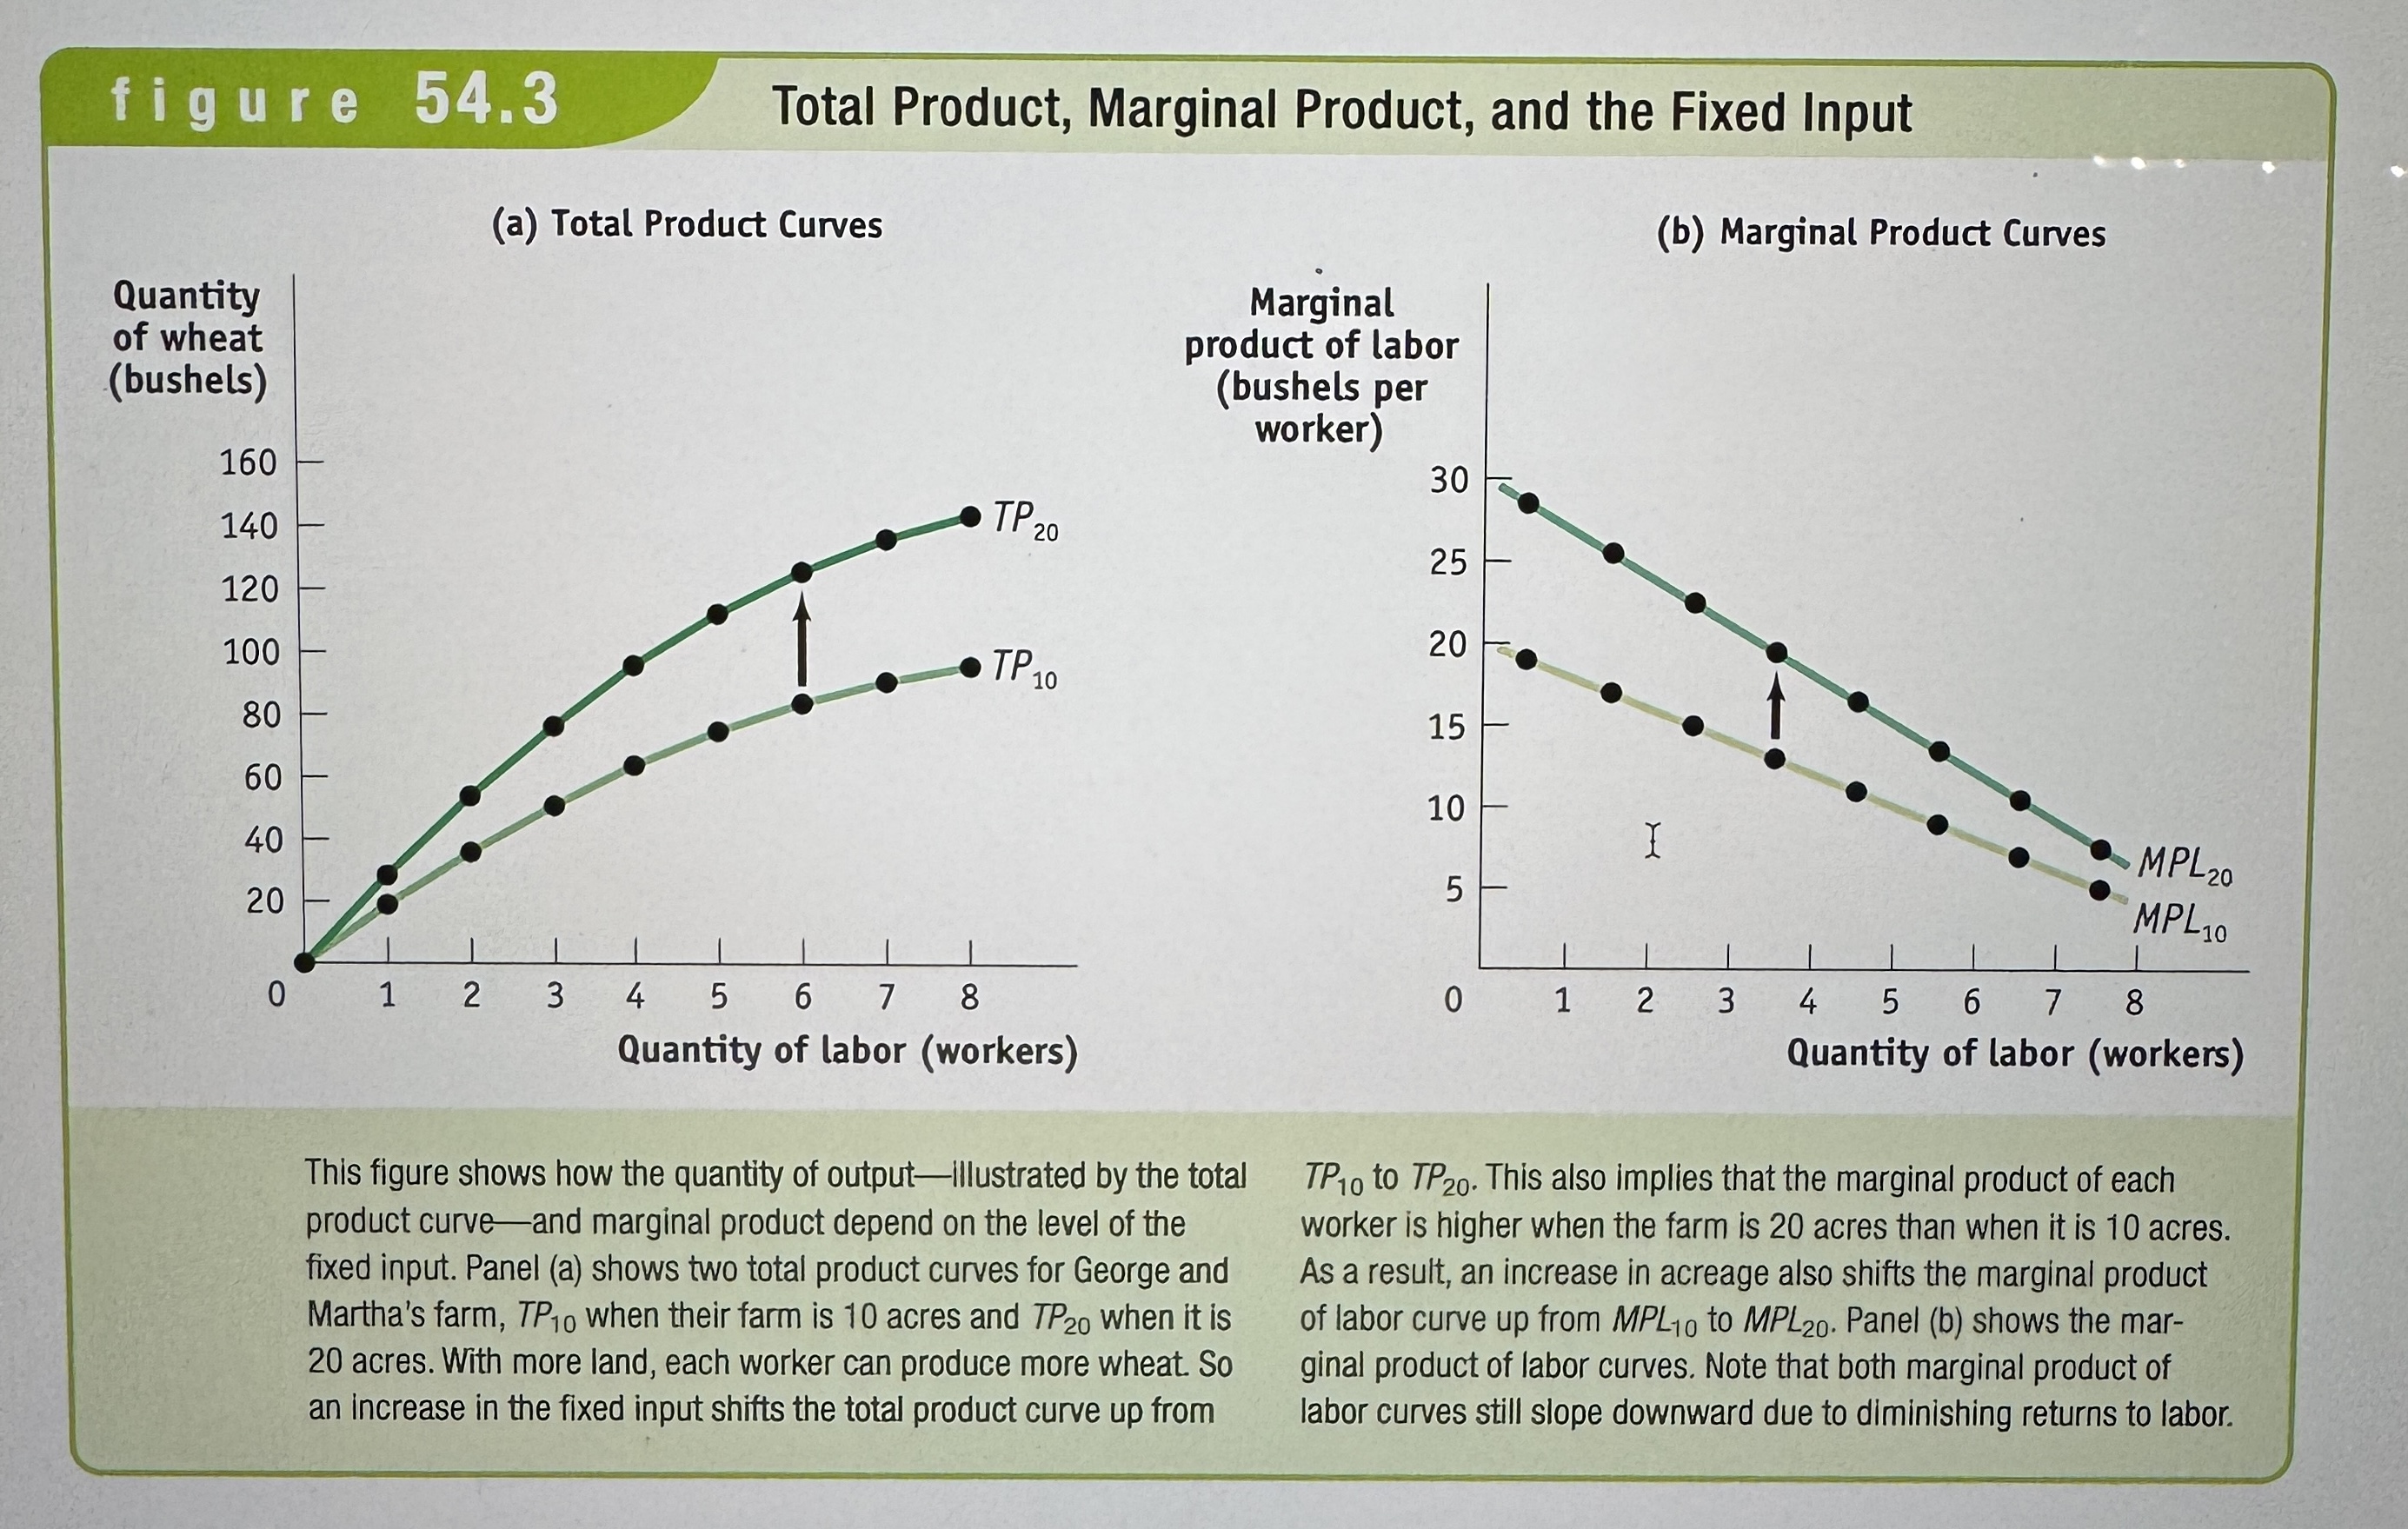
Fixed Input
An input whose quantity is fixed for a period of time and cannot be varied.
Variable Input
An input whose quantity the firm can vary at any time.
Long Run
The time period in which all inputs can be varied.
Short Run
The time period in which at least one input is fixed.
Total Product Curve
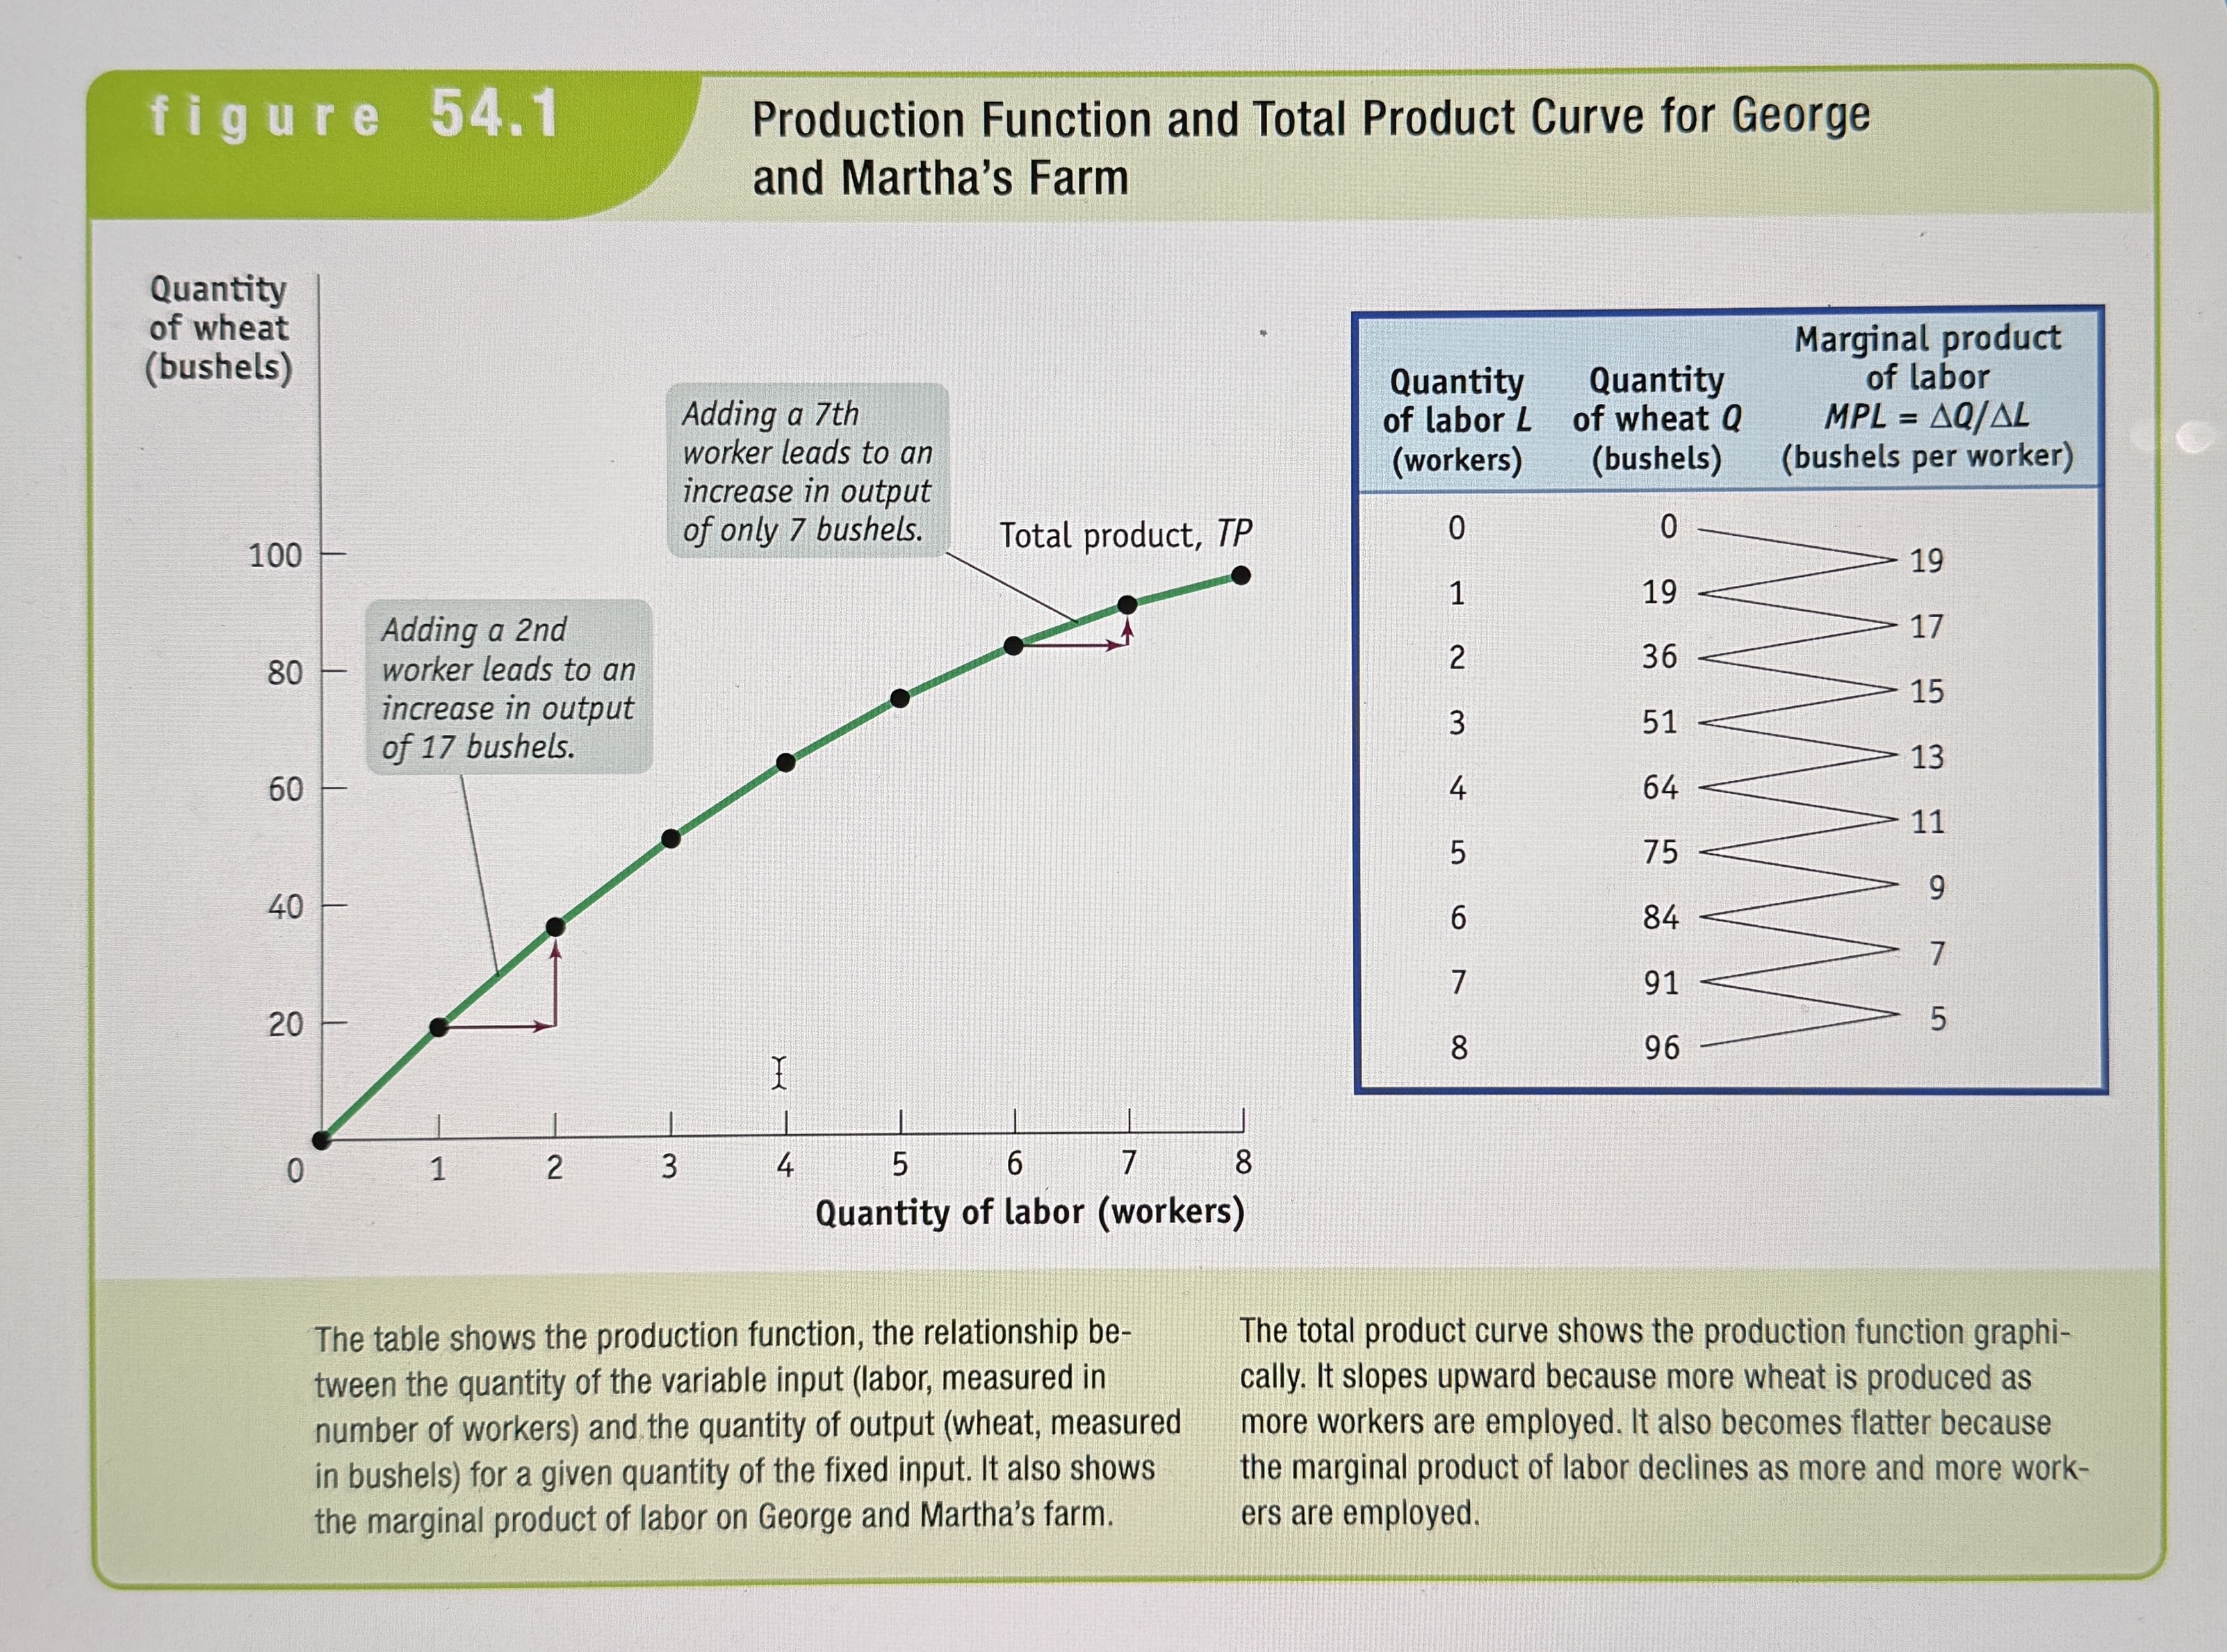
Shows how the quantity of output depends on the quantity of the variable input, for a given quantity of the fixed input.
The Marginal Product
The marginal product of an input is the additional quantity of output produced by using one more unit of that input.
Production Function and Total Product Curve for George and Martha's Farm
Ex.
Marginal Product of Labor Equation
Ex.

Marginal Product of Labor Curve for George and Martha's Farm
Ex.
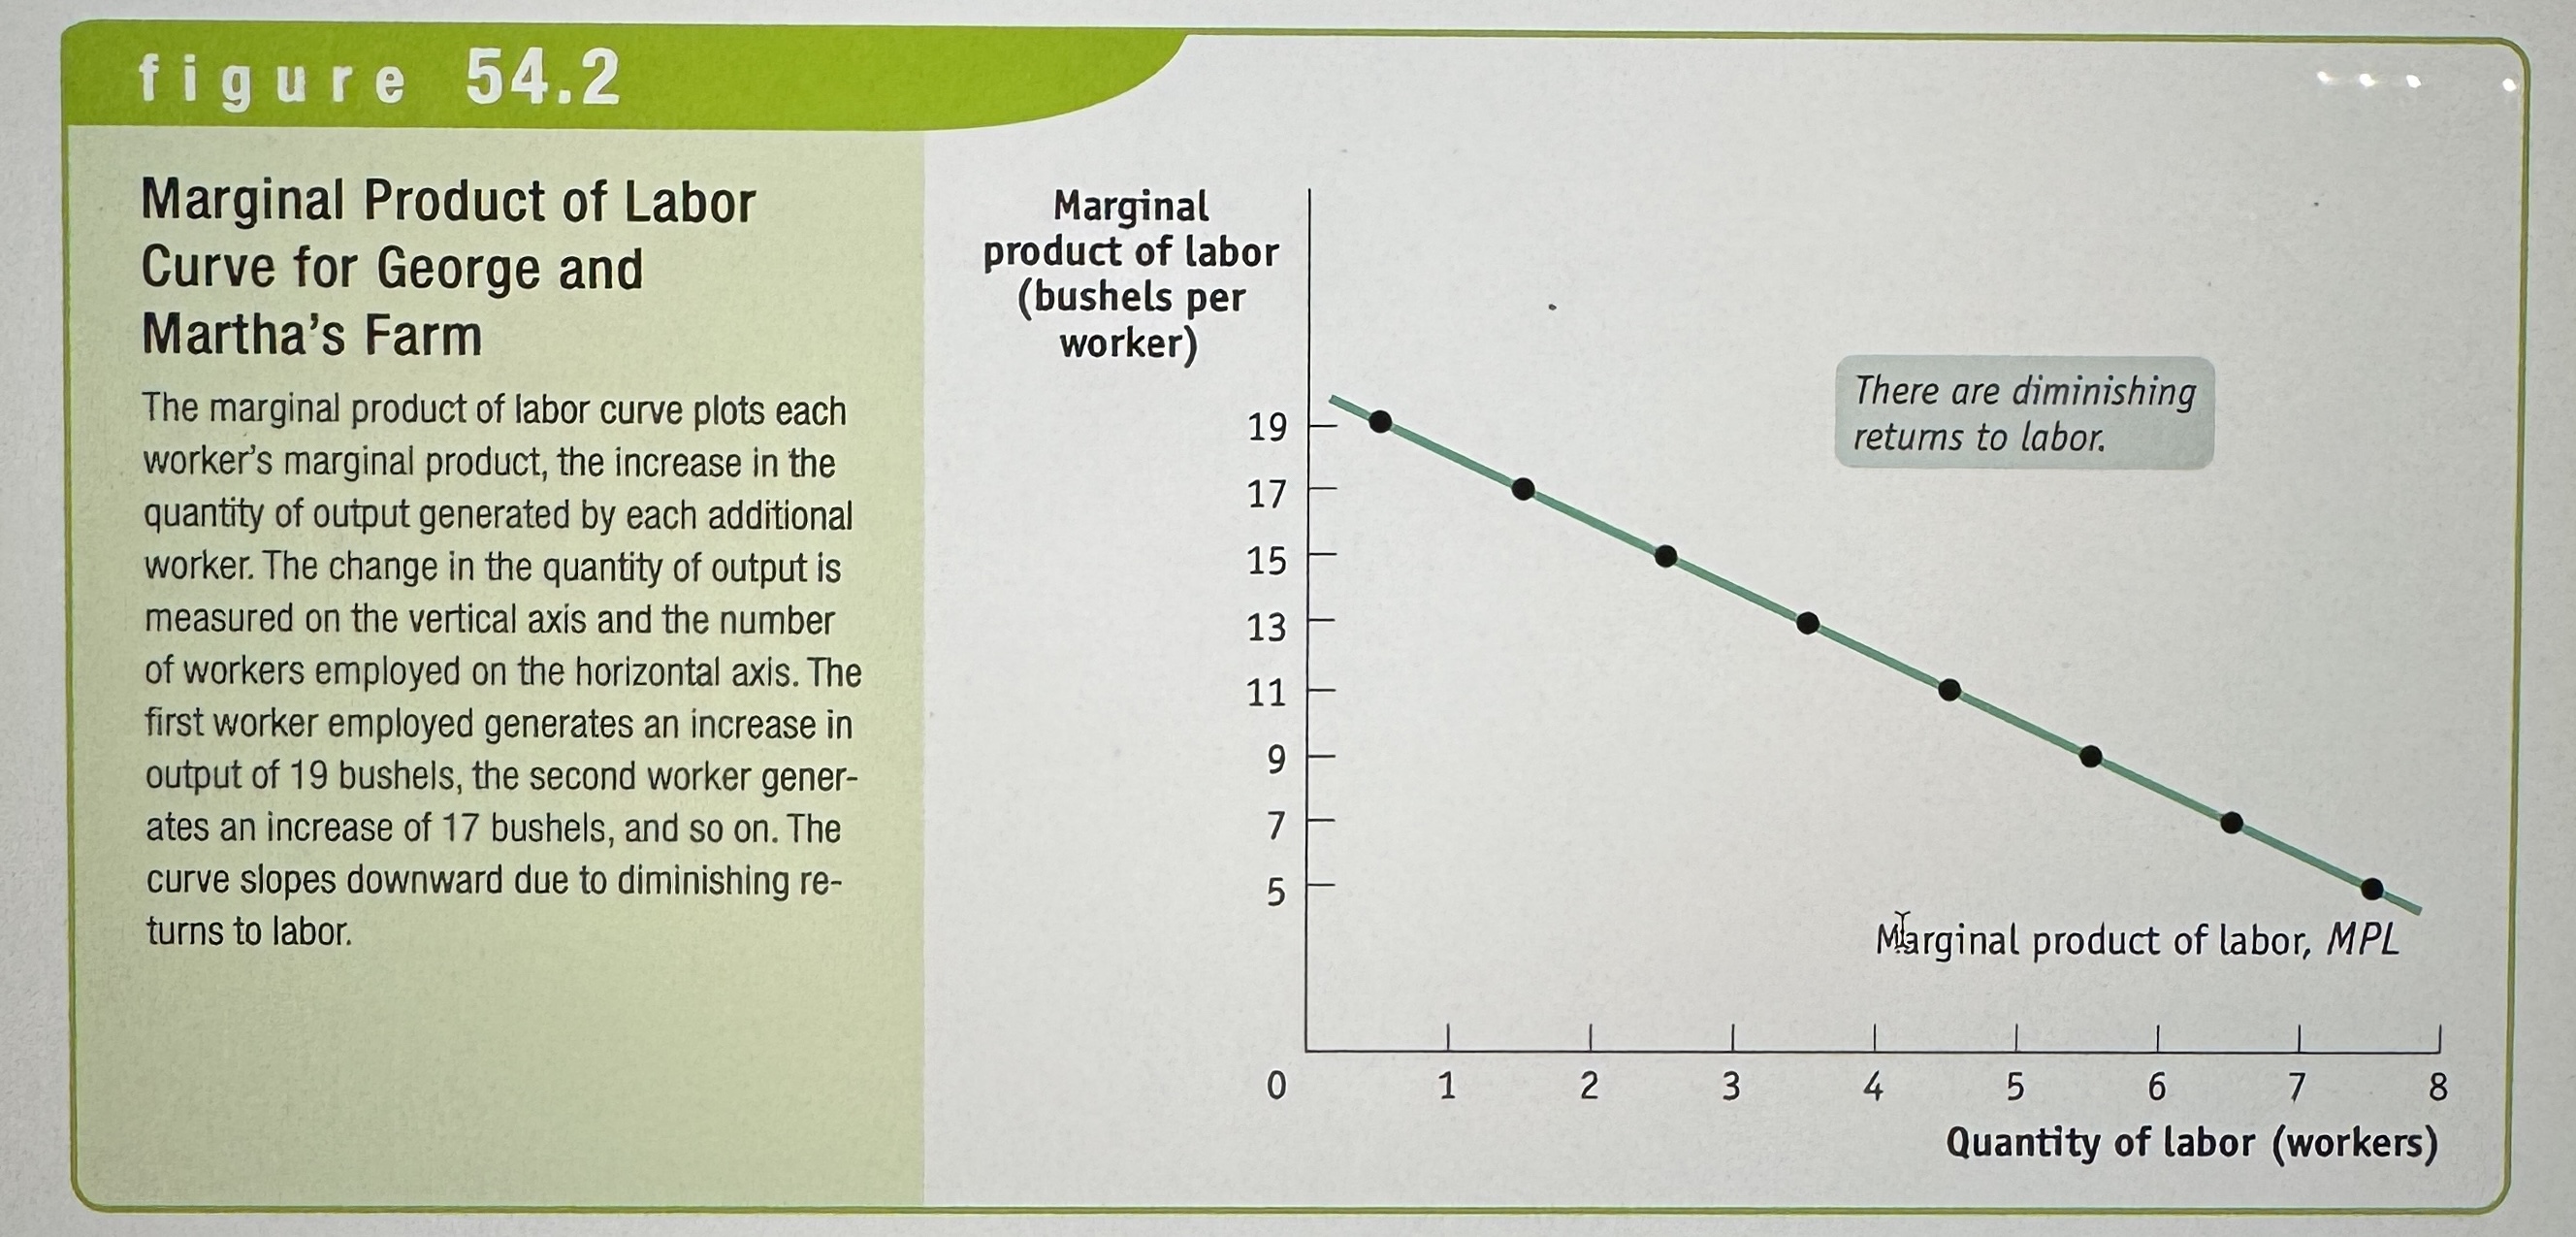
Diminishing Return to an Input
When an increase in the quantity of that input, holding the levels of all other inputs fixed, leads to a decline in the marginal product of that input.
Total Product, Marginal Product, and the Fixed Input
Ex.
Fixed Cost
A fixed cost is a cost that does not depend on the quantity of output produced. It is the cost of the fixed input.
Variable Cost
A variable cost is a cost that depends on the quantity of output produced. It is the cost of the variable input.
Total Cost
The total cost of producing a given quantity of output is the sum of the fixed cost and the variable cost of producing that quantity of output.

The Total Cost Curve
Shows how total cost depends on the quantity of output.
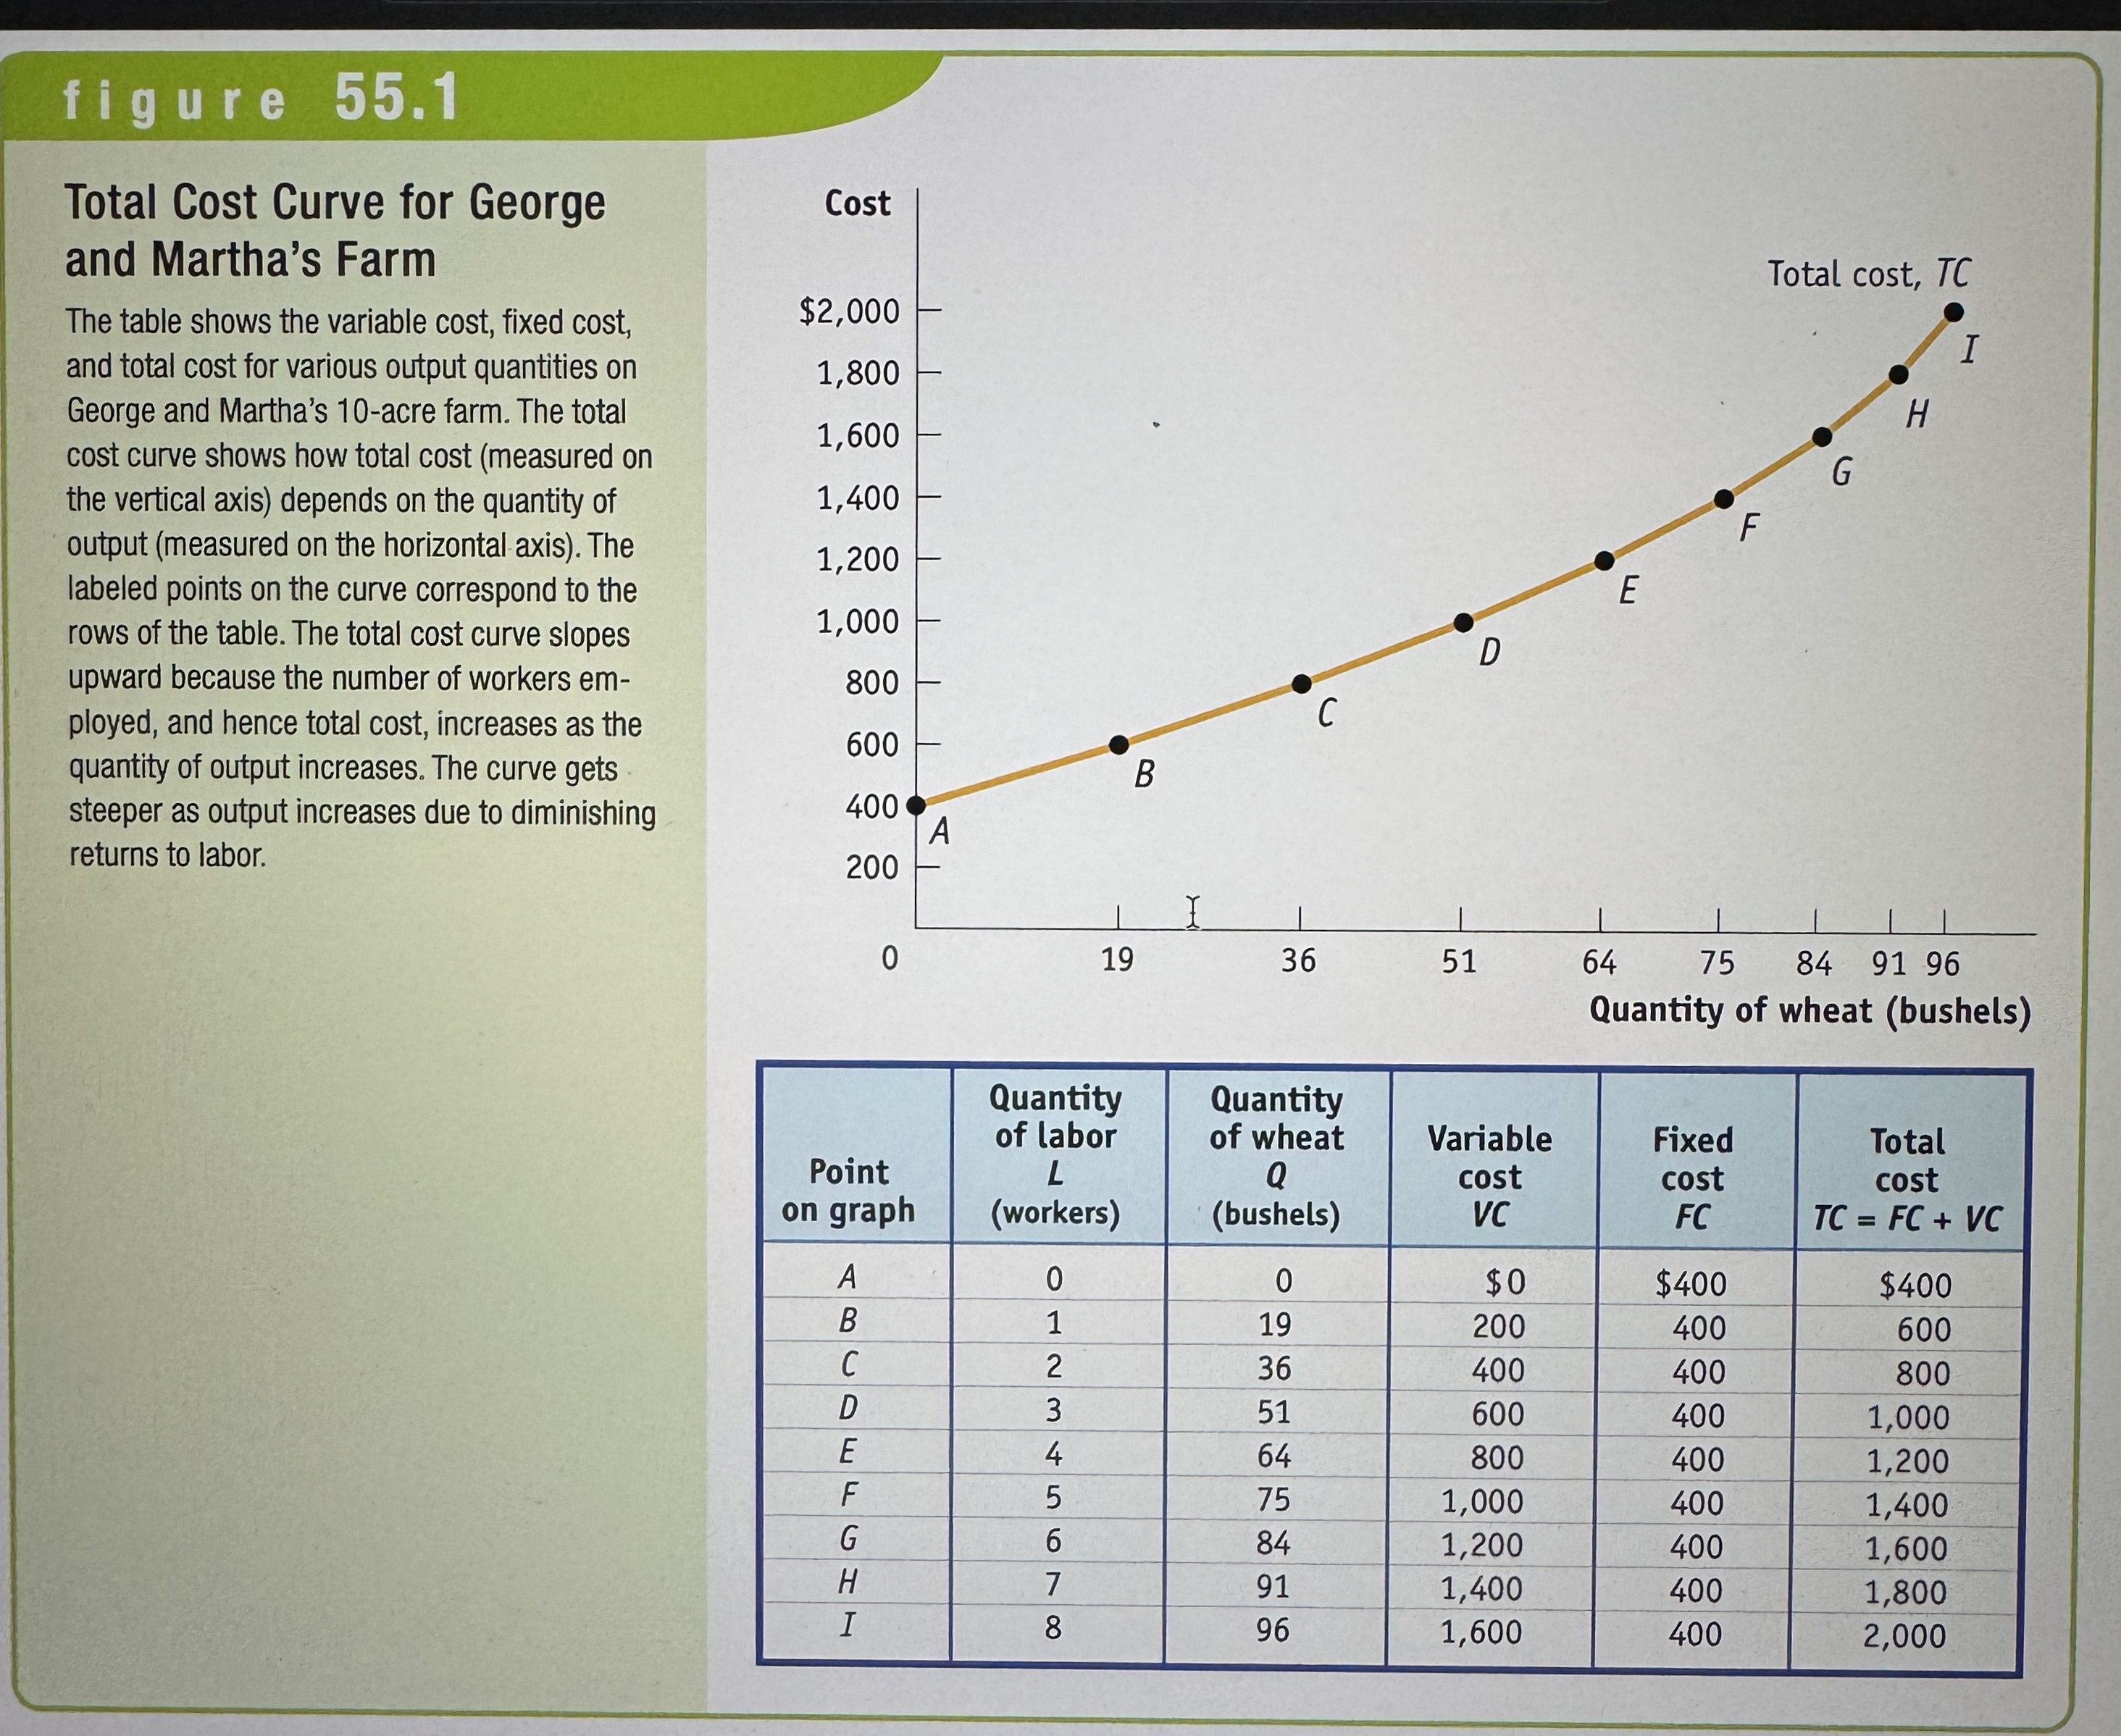
Total Cost Curve for George and Martha's Farm
Ex.
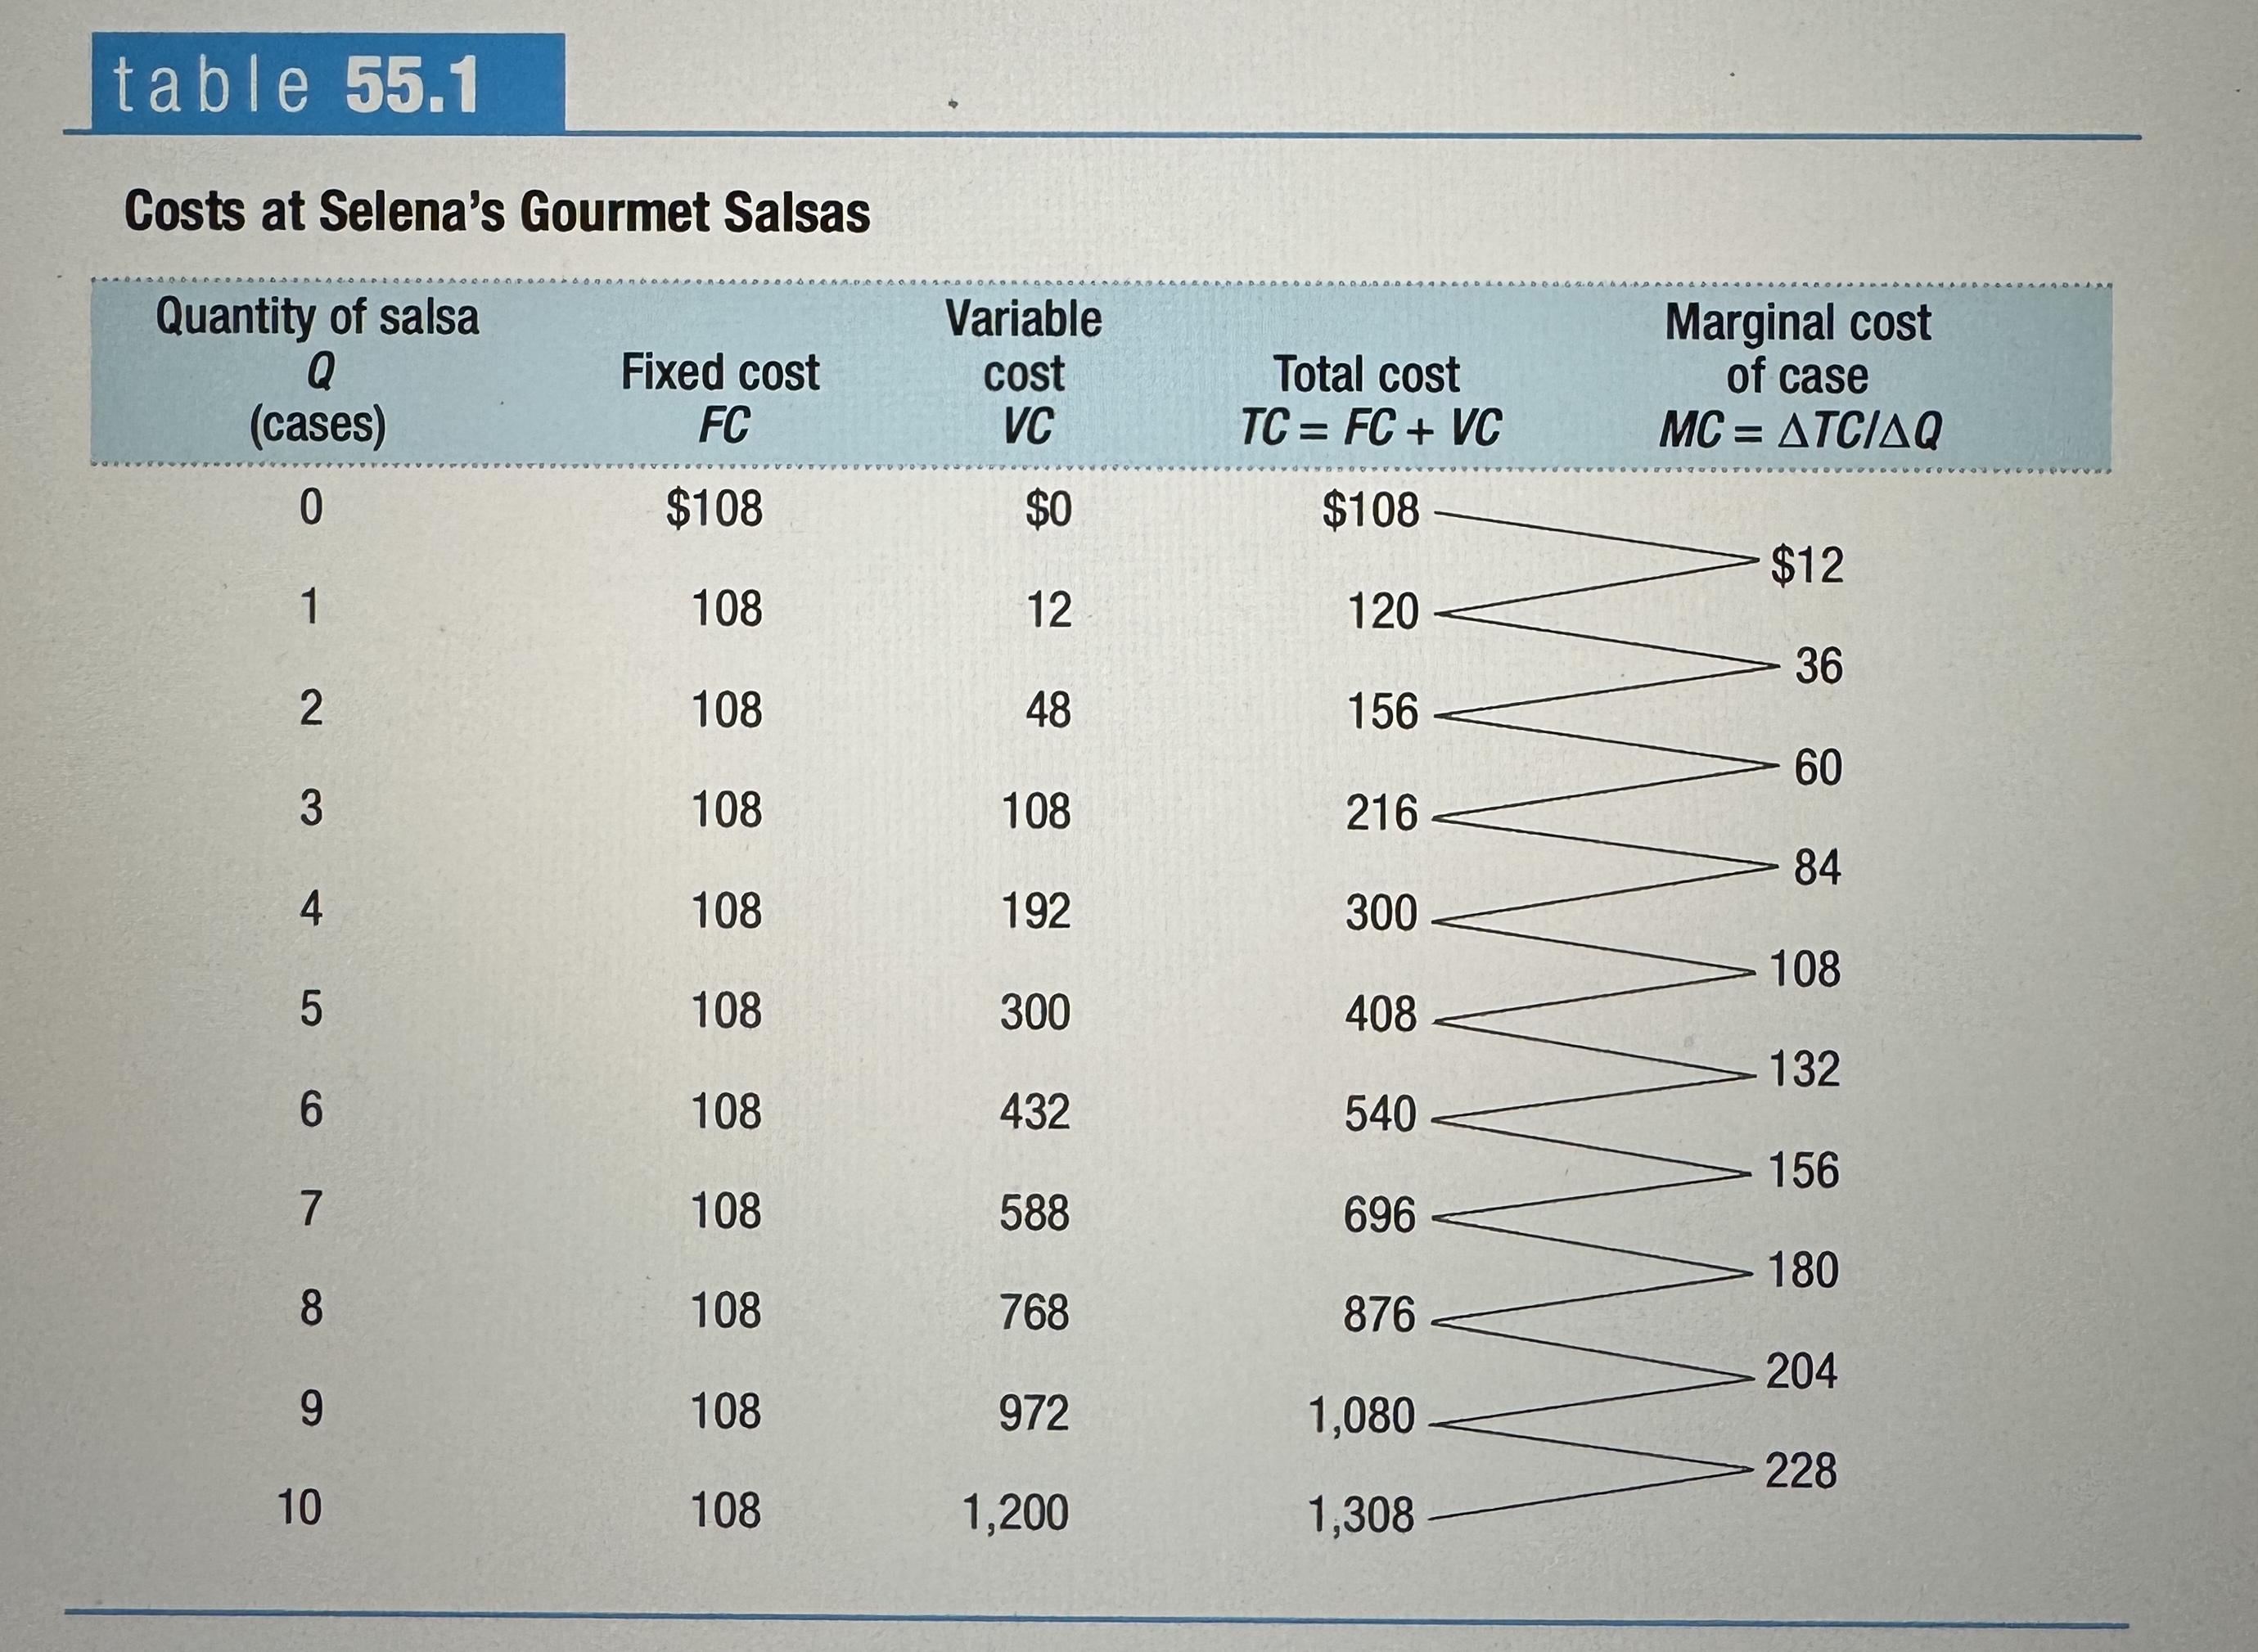
Costs at Selena's Gourmet Salsas
Ex.
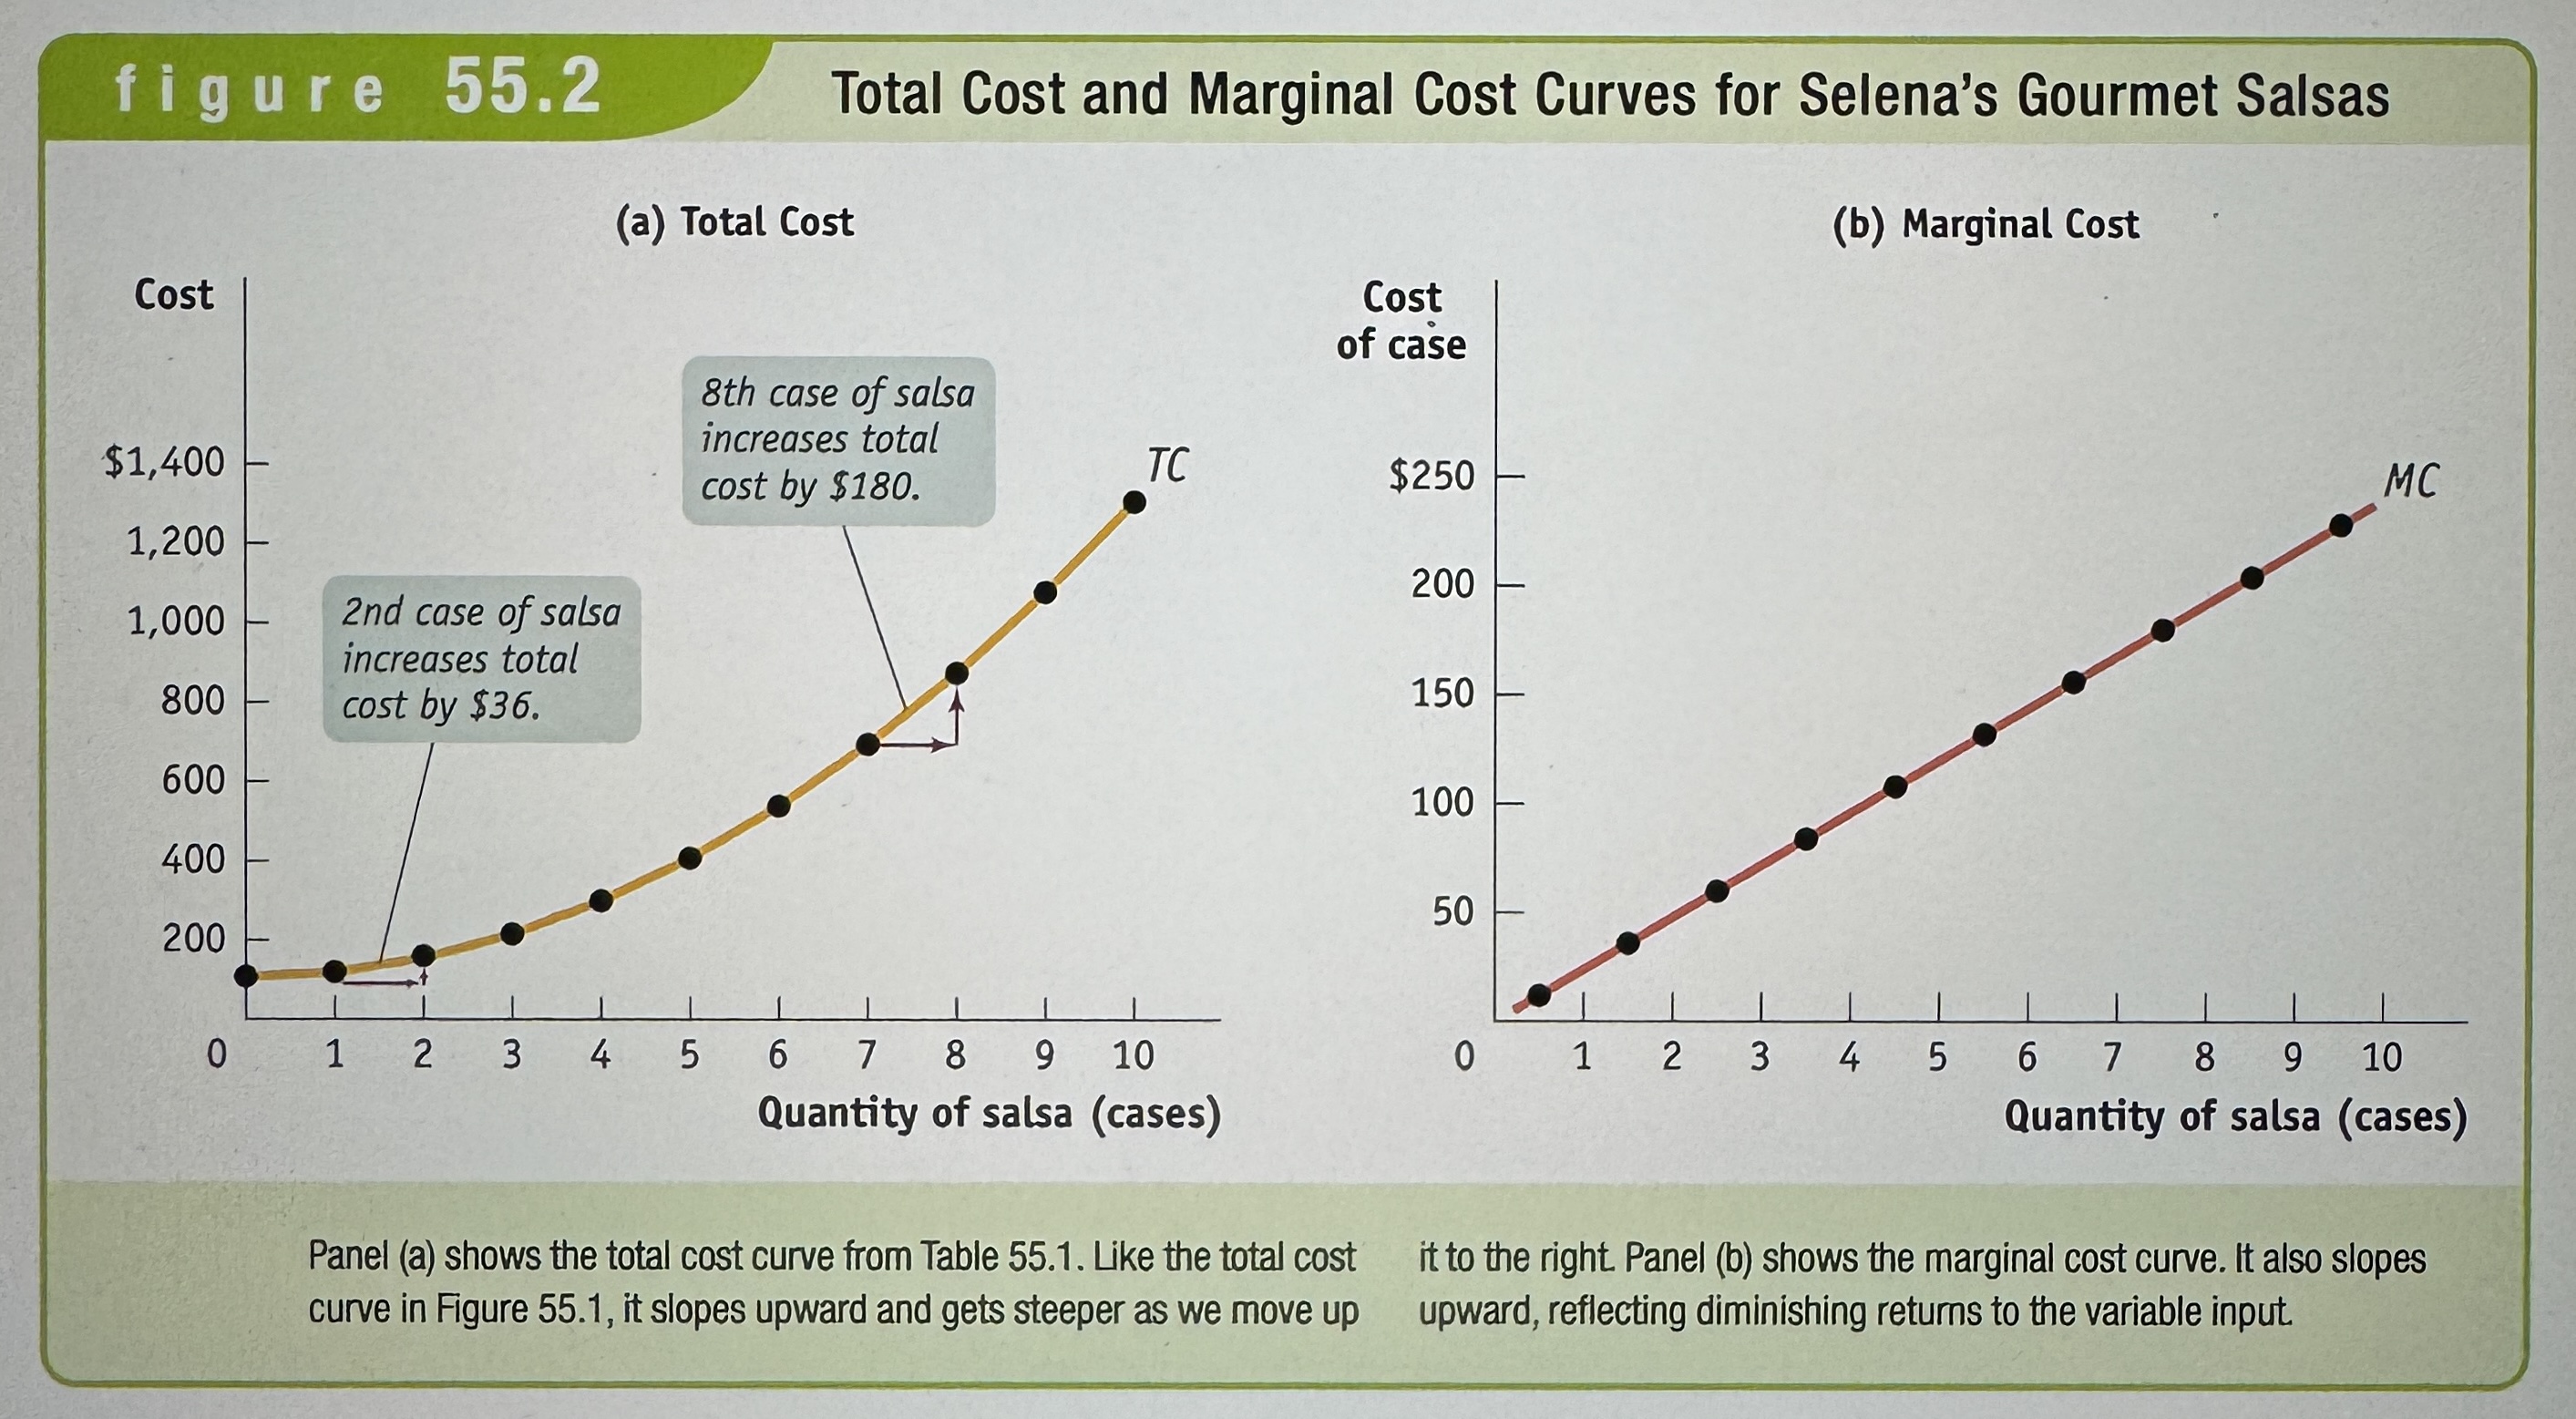
Total Cost and Marginal Cost Curves for Selena's Gourmet Salsas
Ex.
Marginal Cost Equation
Ex.

Average Total Cost/ Average Cost
The total cost divided by the quantity of output produced.

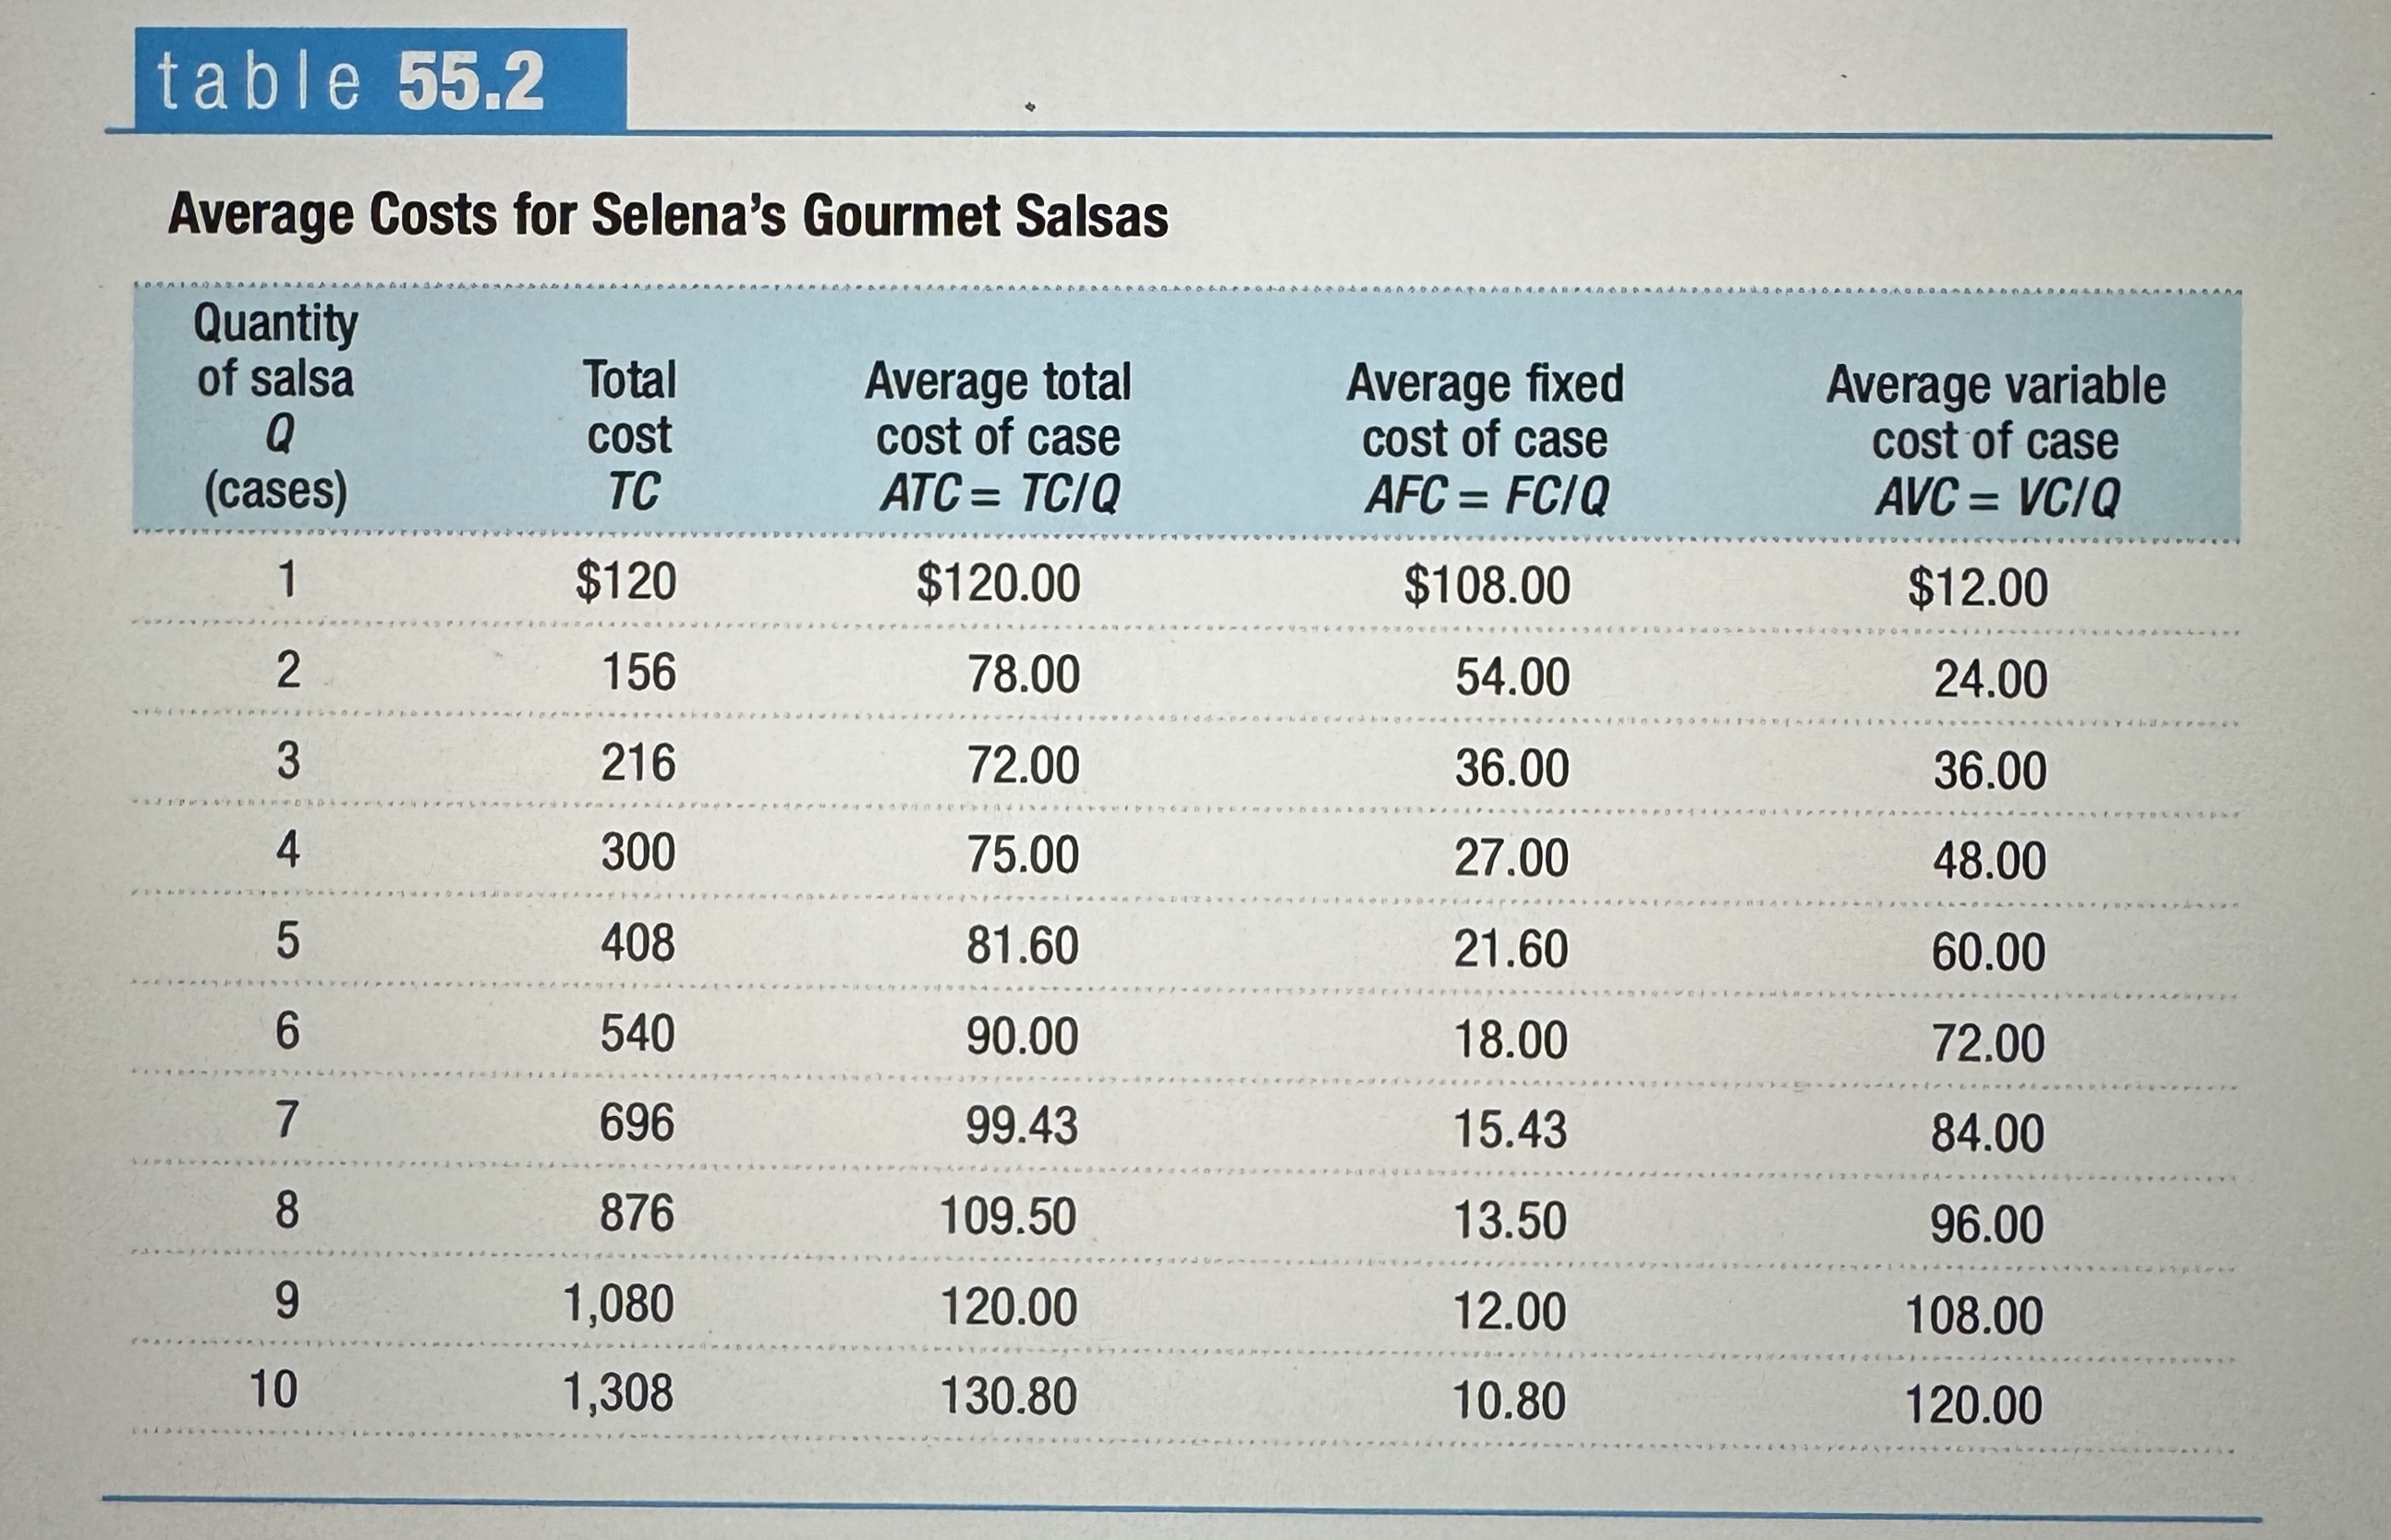
Average Costs for Selena's Gourmet Salsas
Ex.
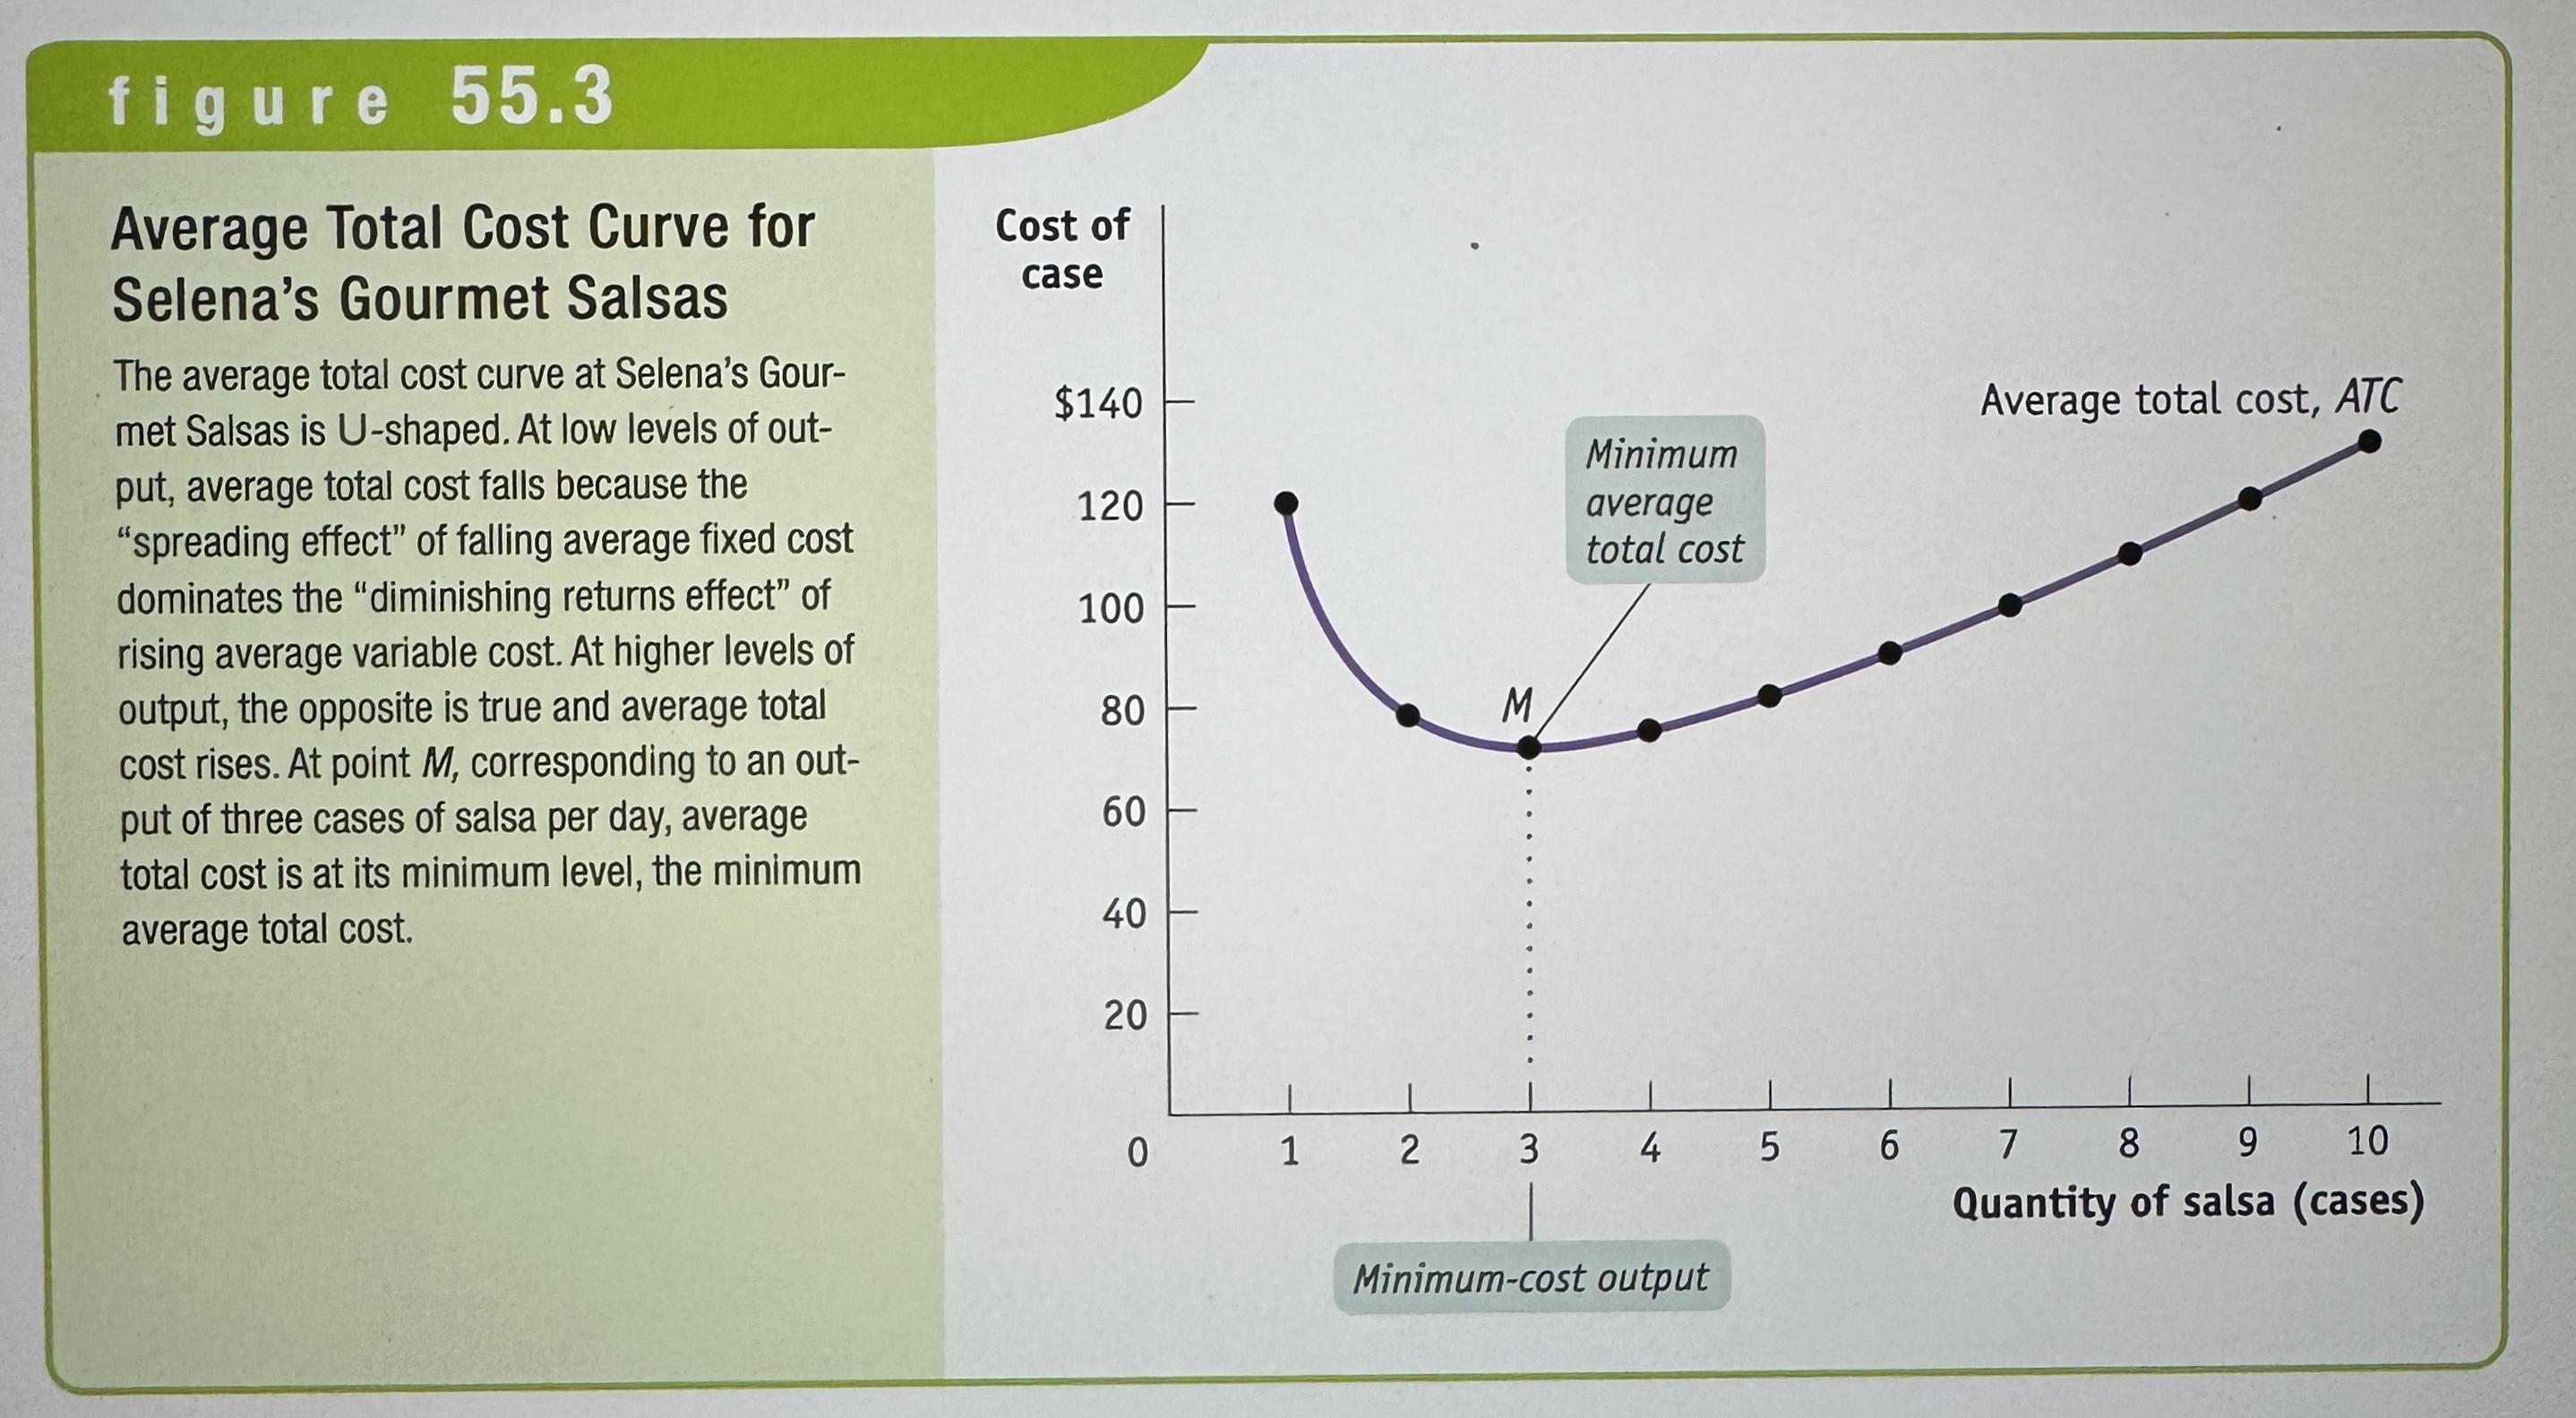
U-shaped average total cost curves
Falls at low levels of output and then rises at higher levels.
Average Total Cost Curve for Selena's Gourmet Salsas
Ex.
Average Fixed and Variable Costs
Average fixed cost is the fixed cost per unit of output.
Average variable cost is the variable cost per unit of output.

Marginal Cost and Average Cost Curves for Selena's Gourmet Salsas
Ex.
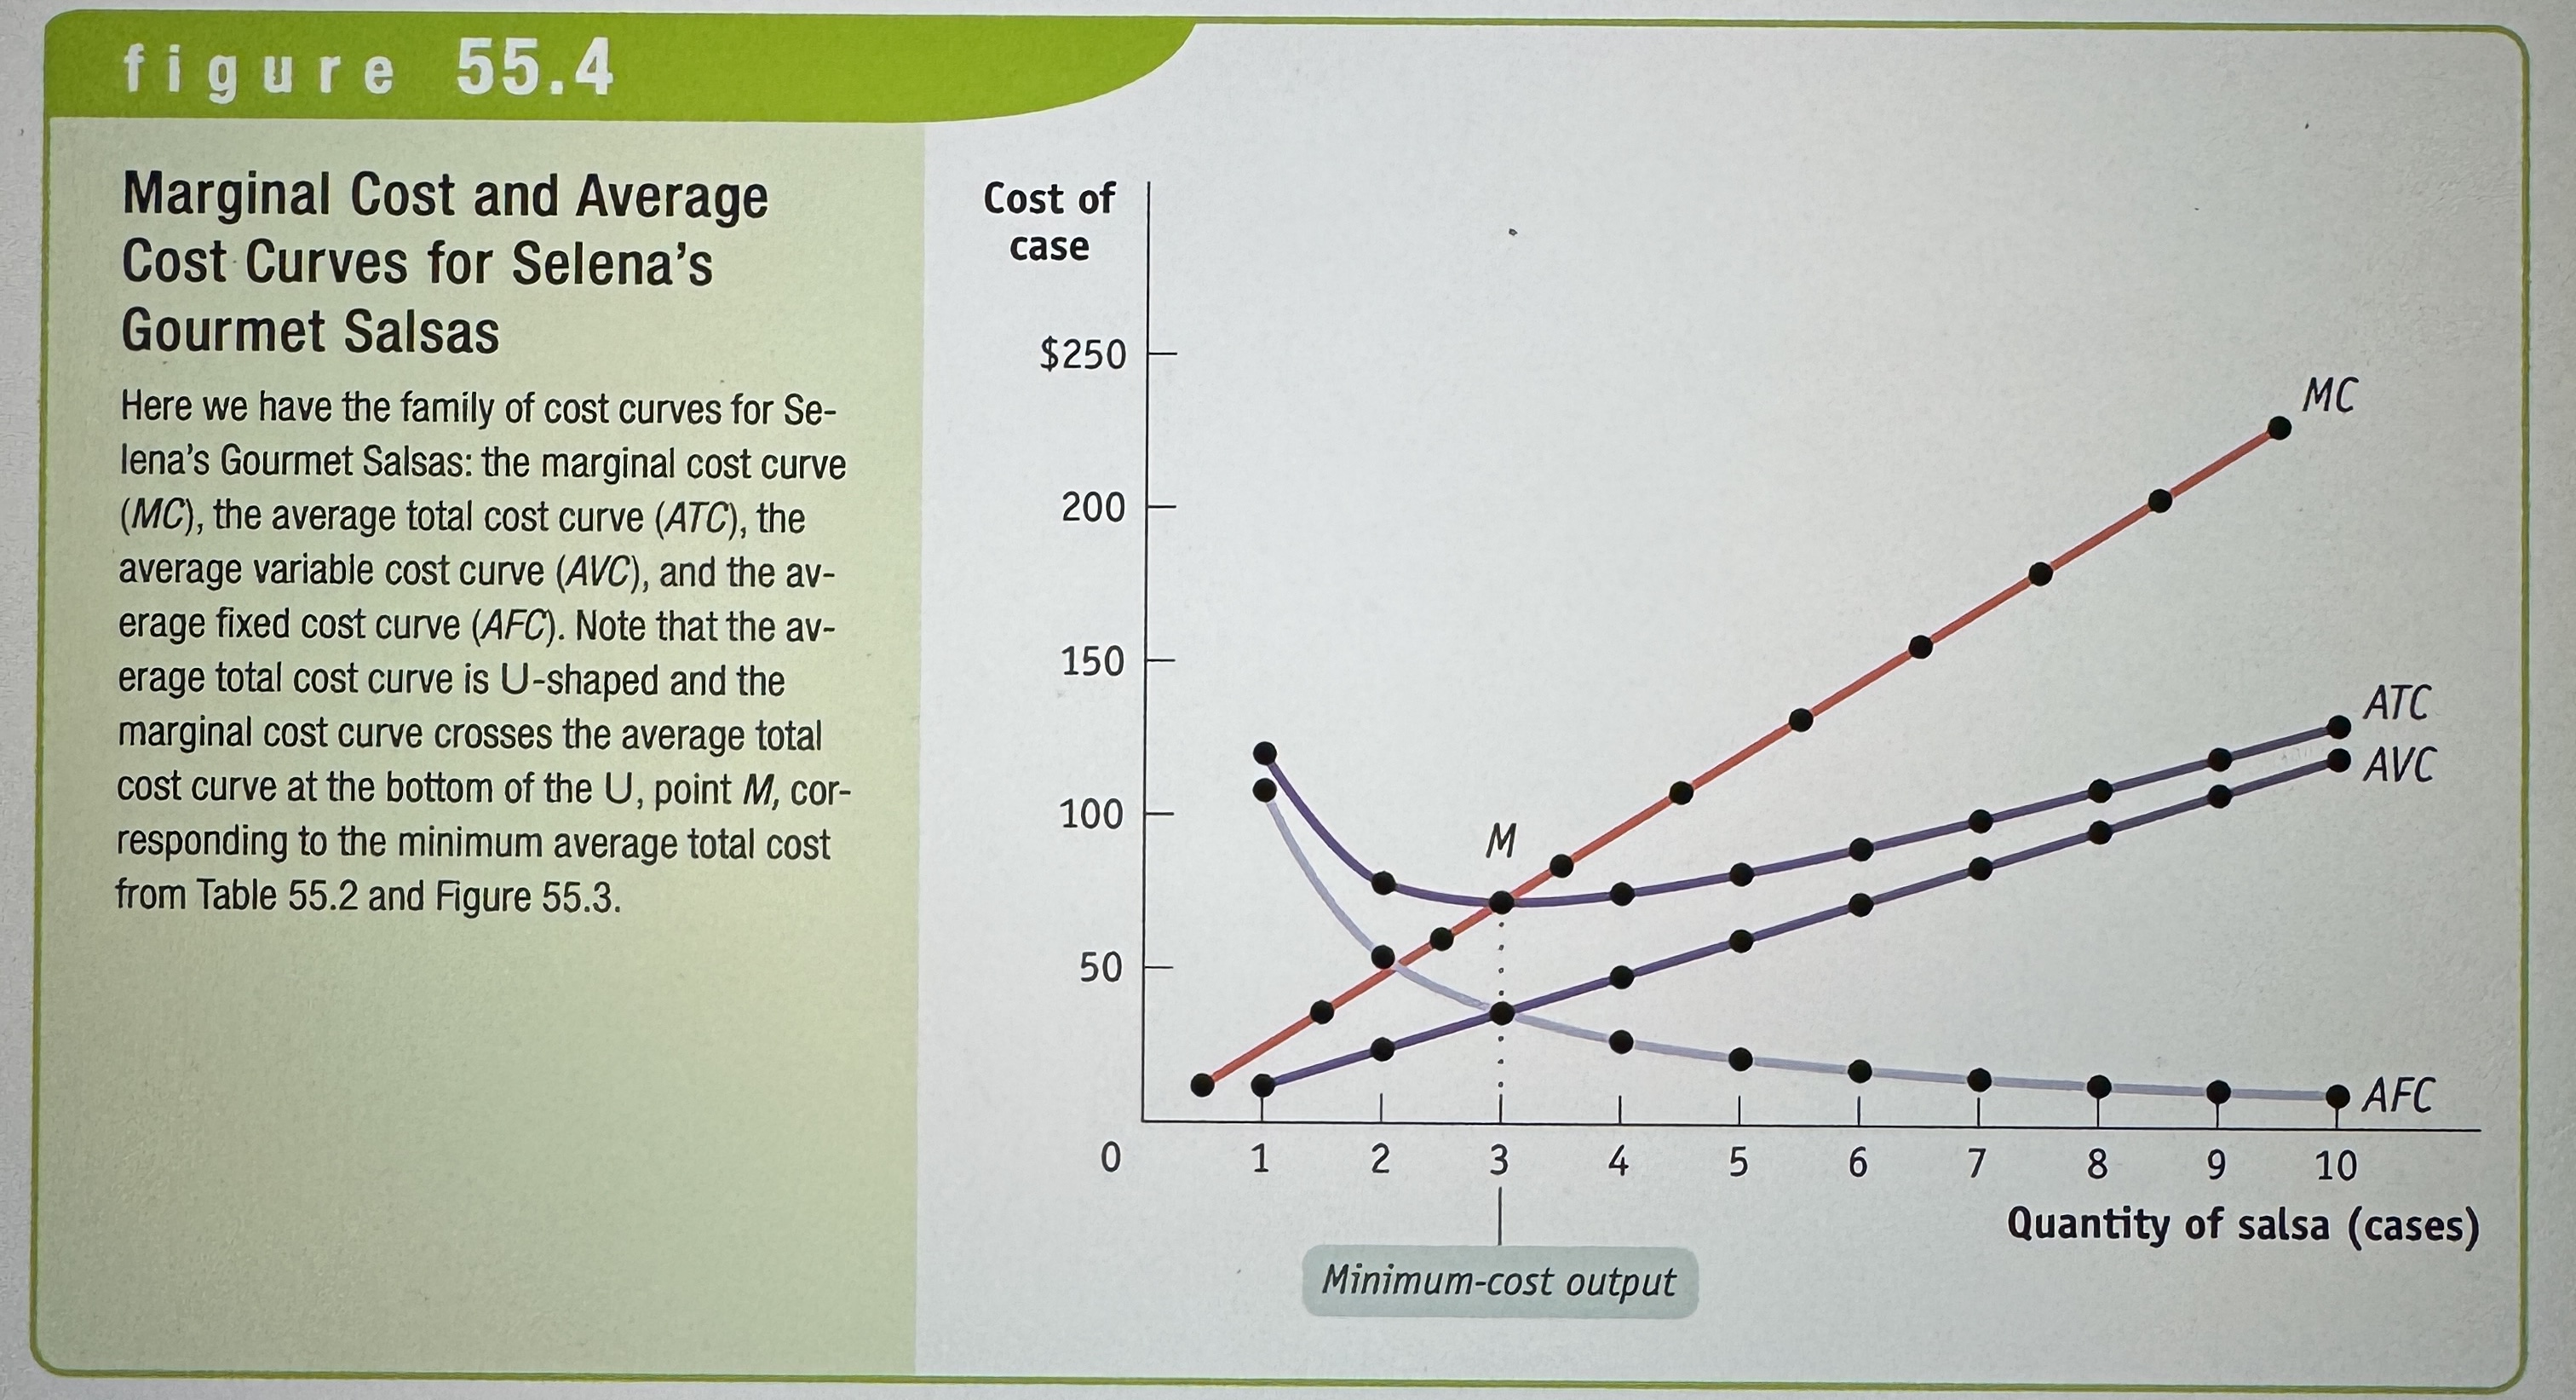
Minimum-Cost Output
The quantity of output at which average total cost is lowest – it corresponds to the bottom of the U-shaped average total cost curve.
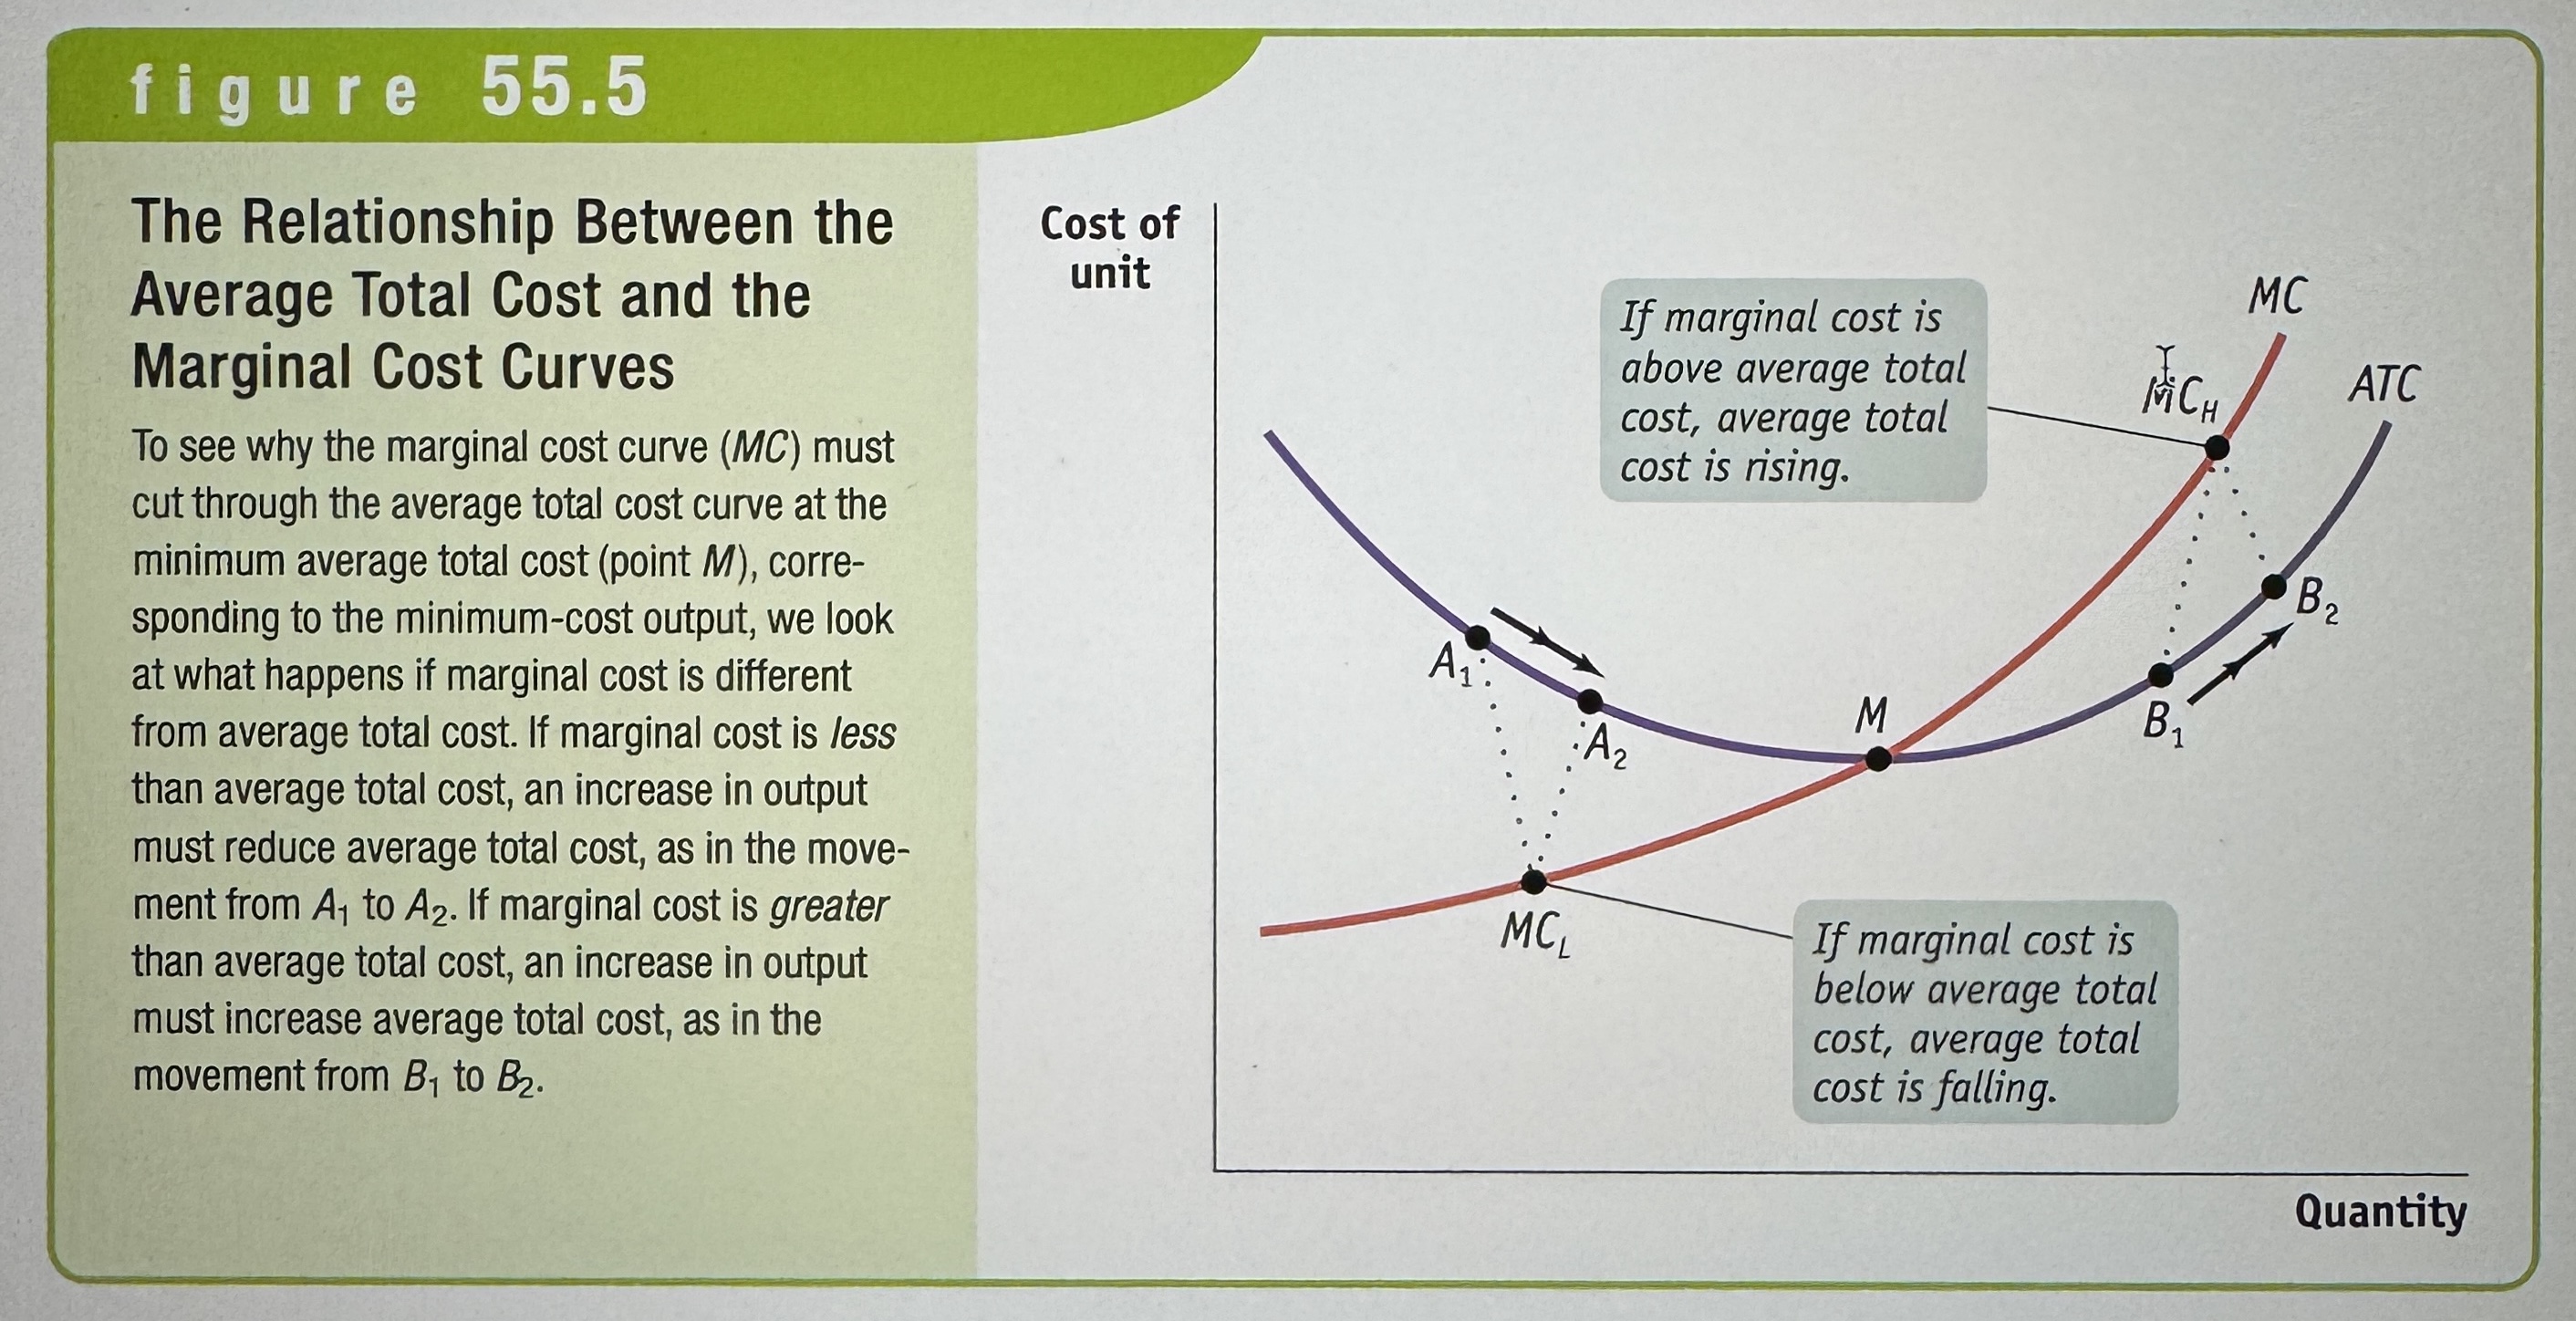
The Relationship Between the Average Total Cost and the Marginal Cost Curves
Ex.
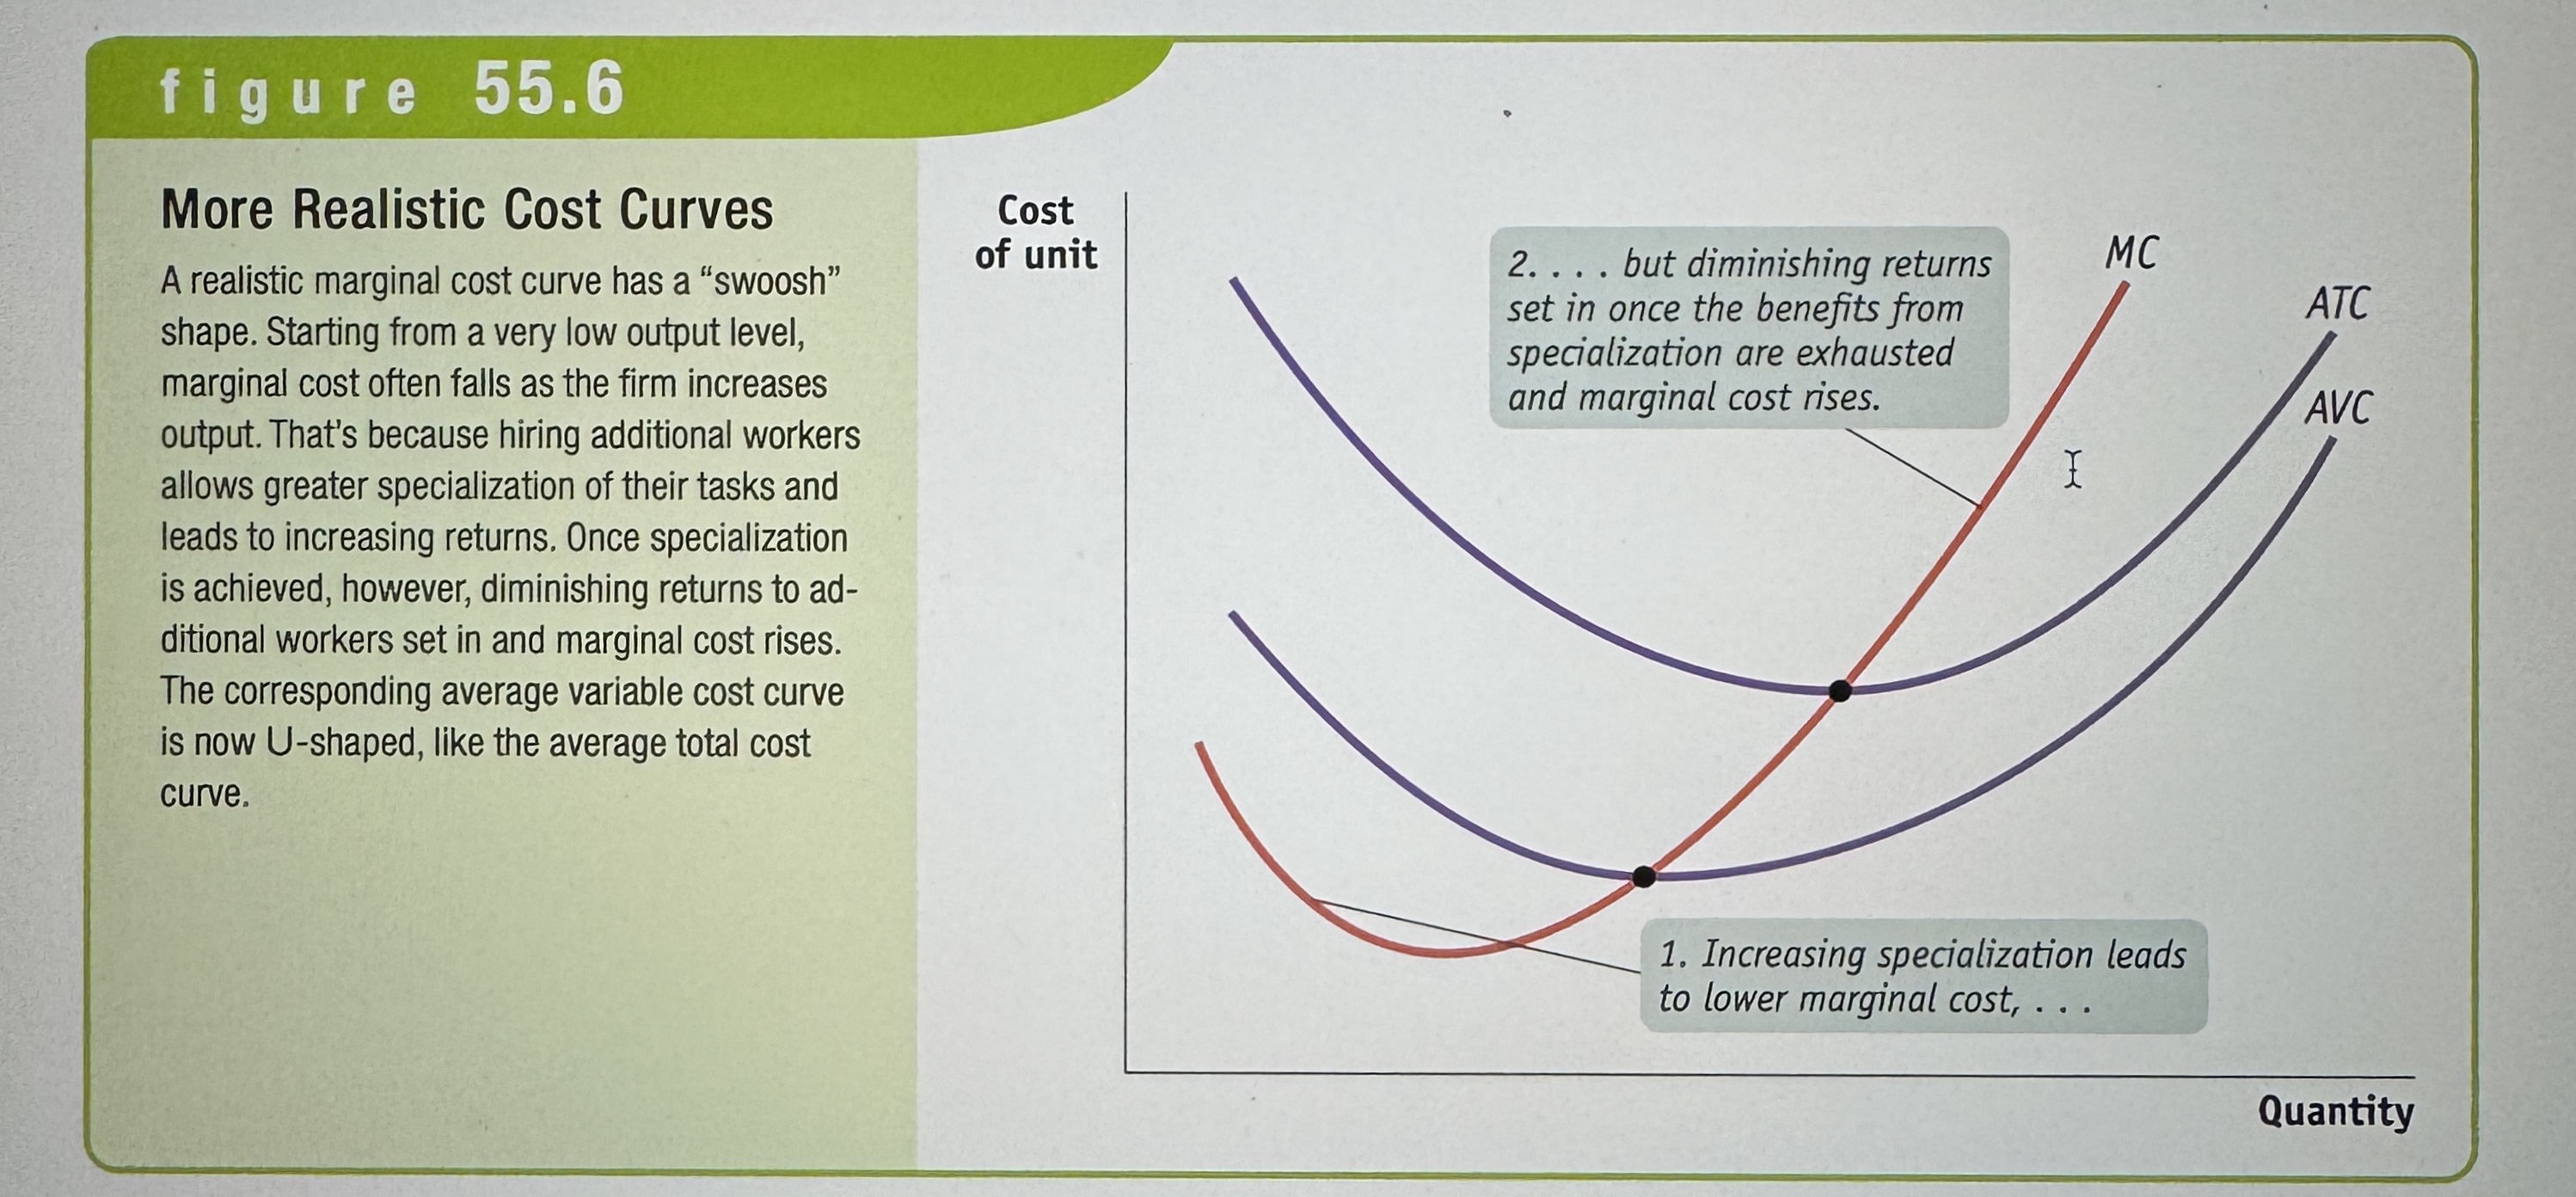
More Realistic Cost Curves
Ex.
Choosing the Level of Fixed Cost for Selena's Gourmet Salsas
Ex.
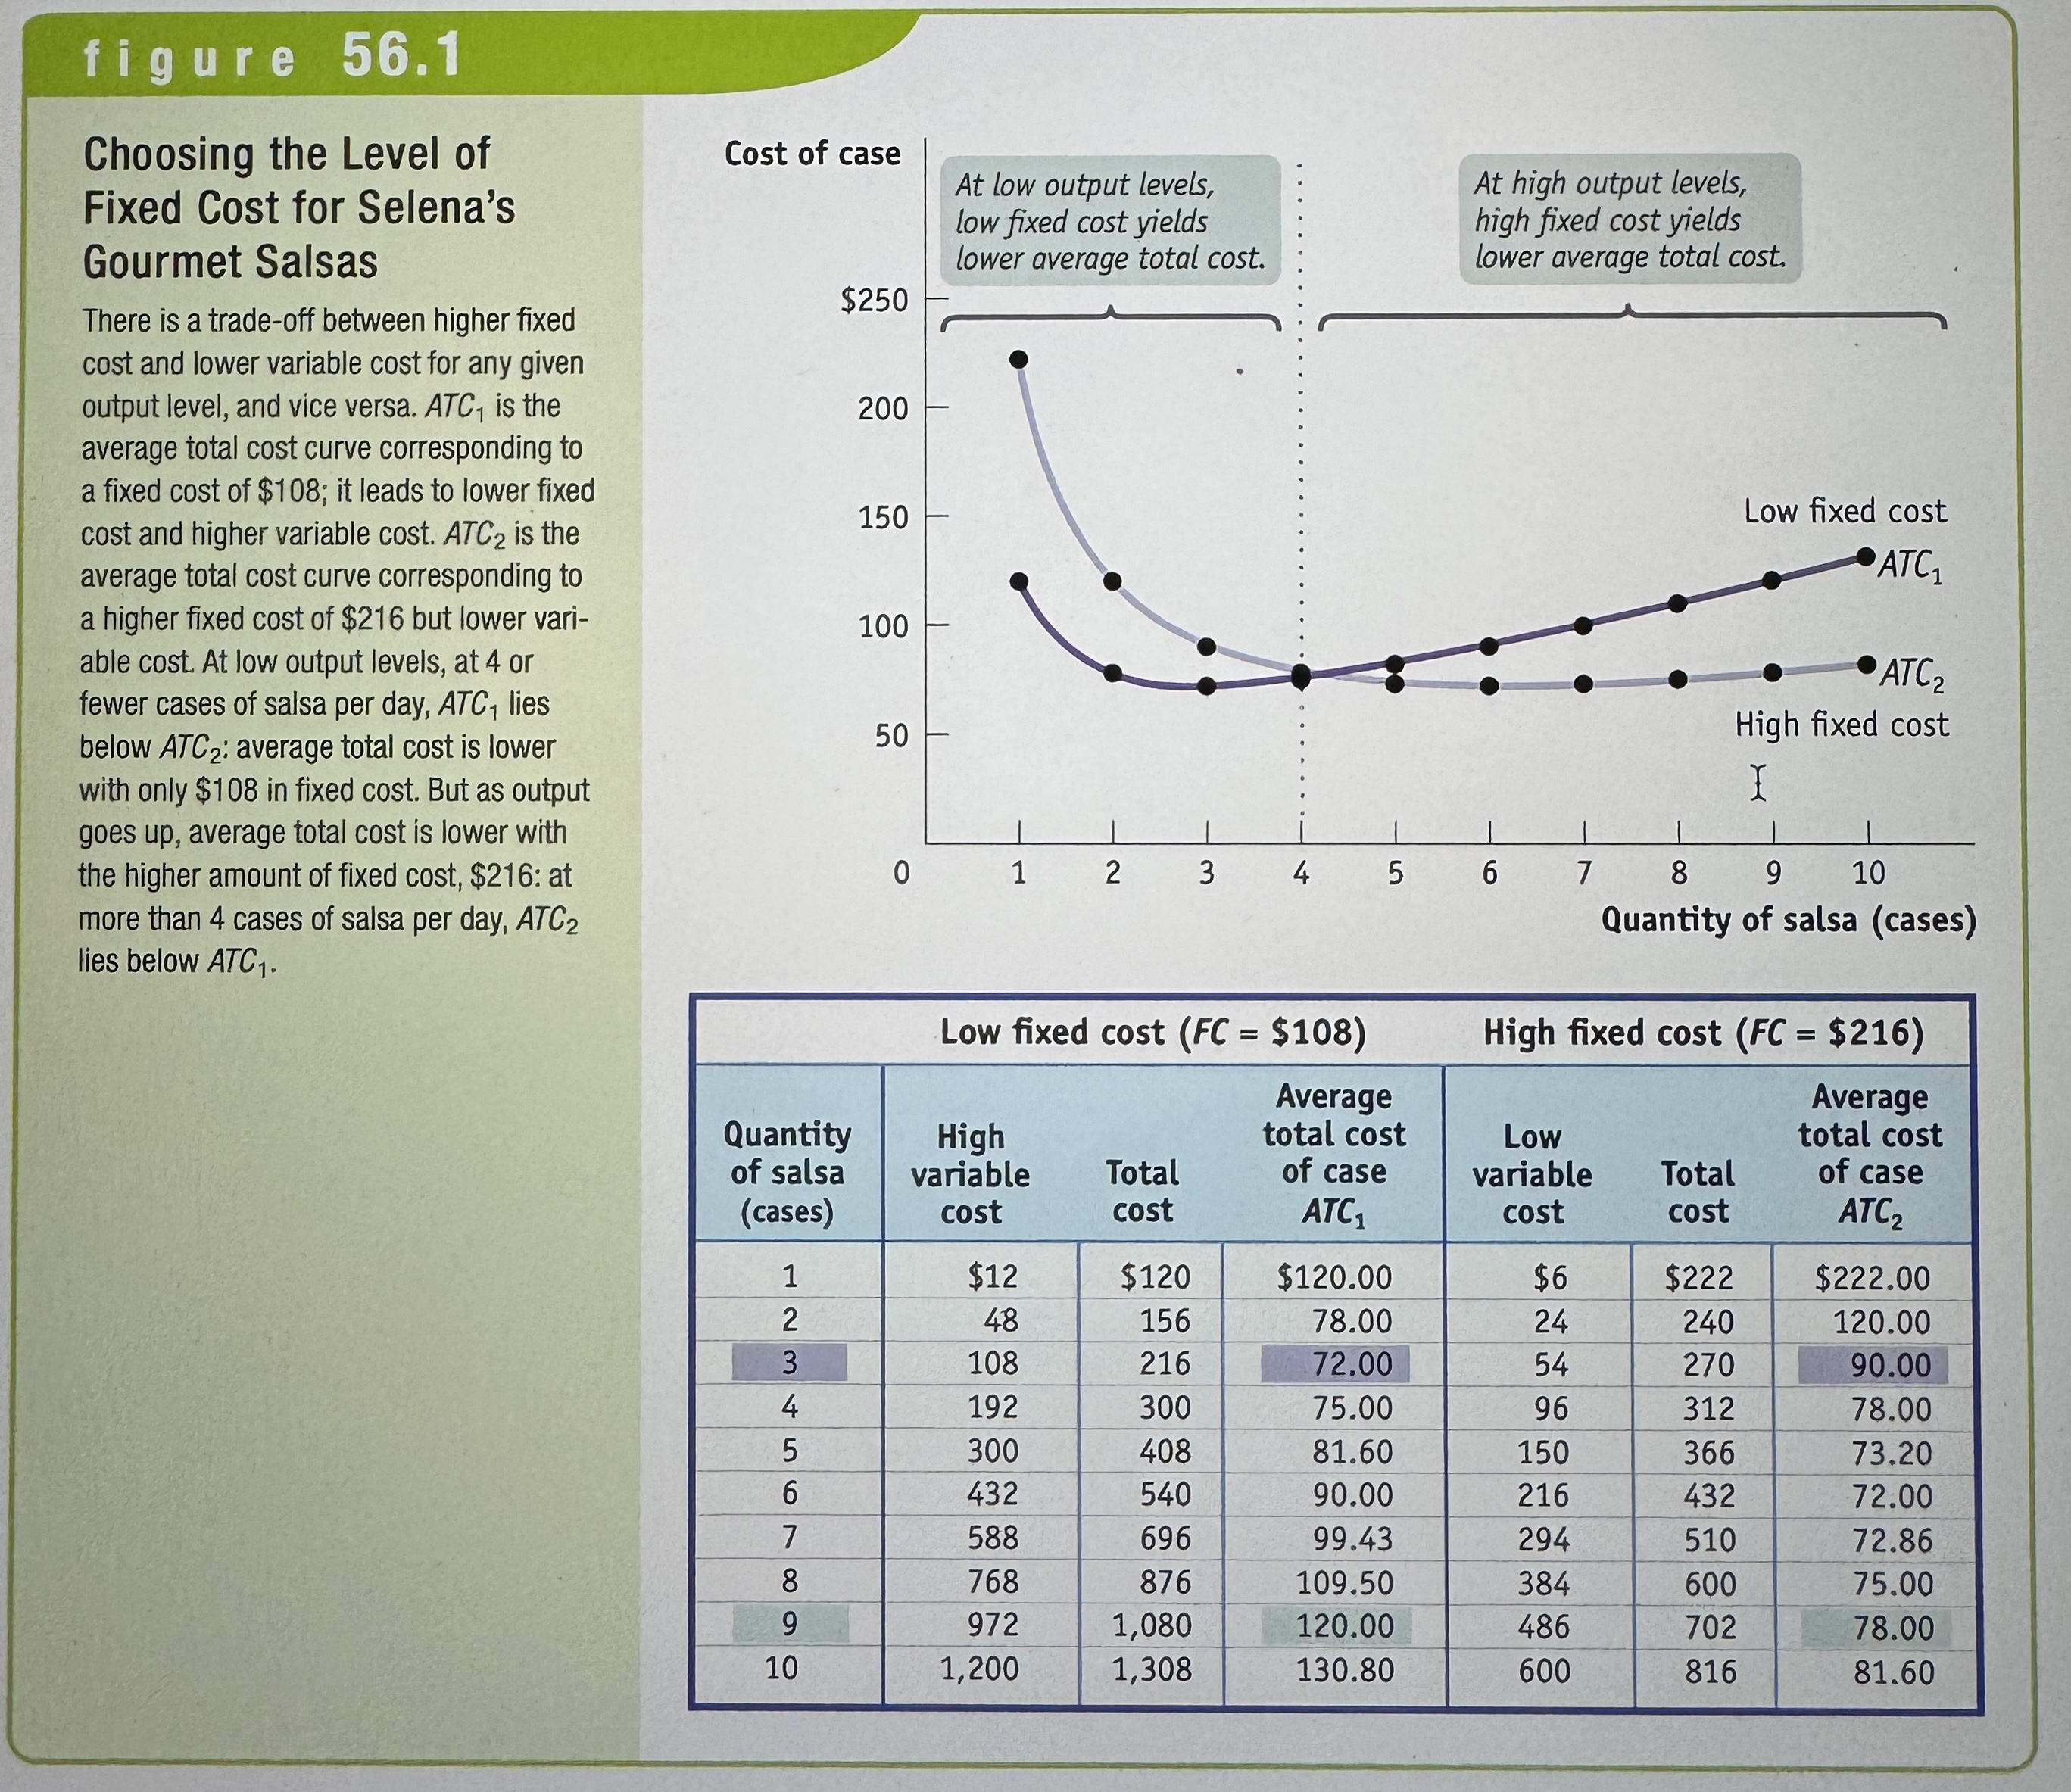
Long-Run Average Total Cost Curve
Shows the relationship between output and average total cost when fixed cost has been chosen to minimize average total cost for each level of output.
Short-Run and Long-Run Average Total Cost Curves
Ex.
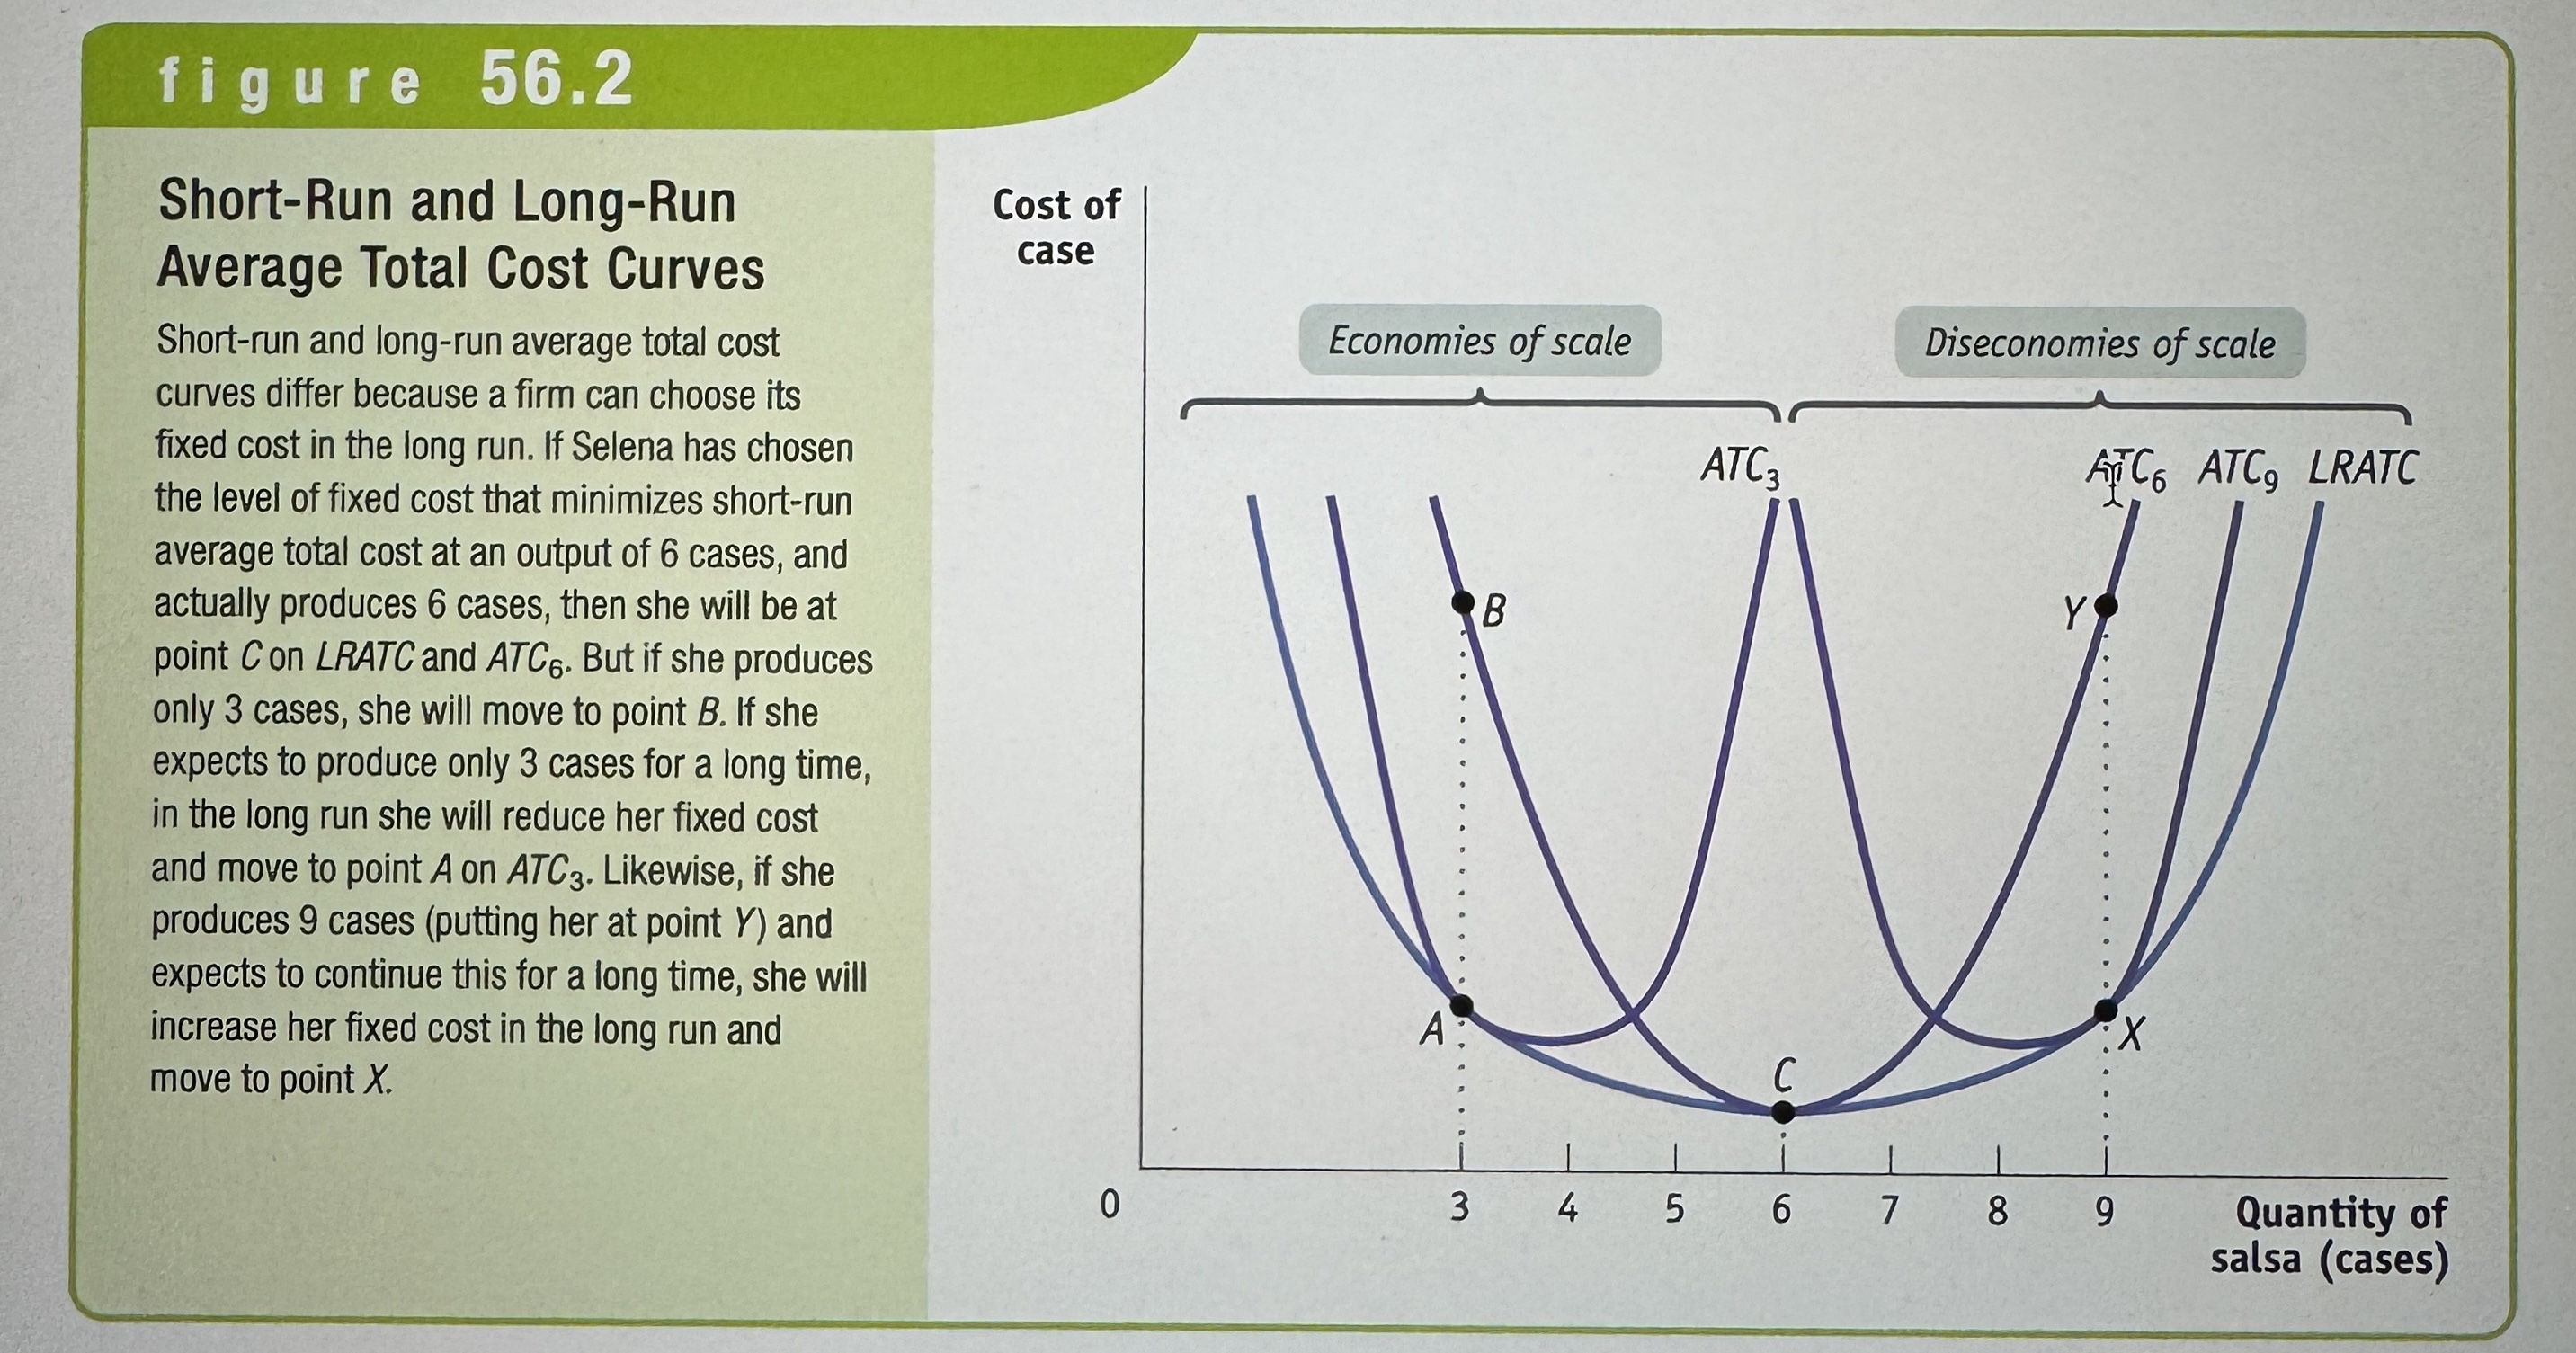
Eonomies of scale
When long-run average total cost declines as output increases.
Increasing returns to scale
When output increases more than in proportion to an increase in all inputs. For example, with increasing returns to scale, doubling all inputs would cause output to more than double.
Diseconomies of scale
There are diseconomies of scale when long-run average total cost increases as output increases.
Decreasing returns to scale
There are decreasing returns to scale when output increases less than in proportion to an increase in all inputs.
Constant returns to scale
There are constant returns to scale when output increases directly in proportion to an increase in all inputs.
Sunk Cost
A sunk cost is a cost that has already been incurred and is nonrecoverable. A sunk cost should be ignored in a decision about future actions.
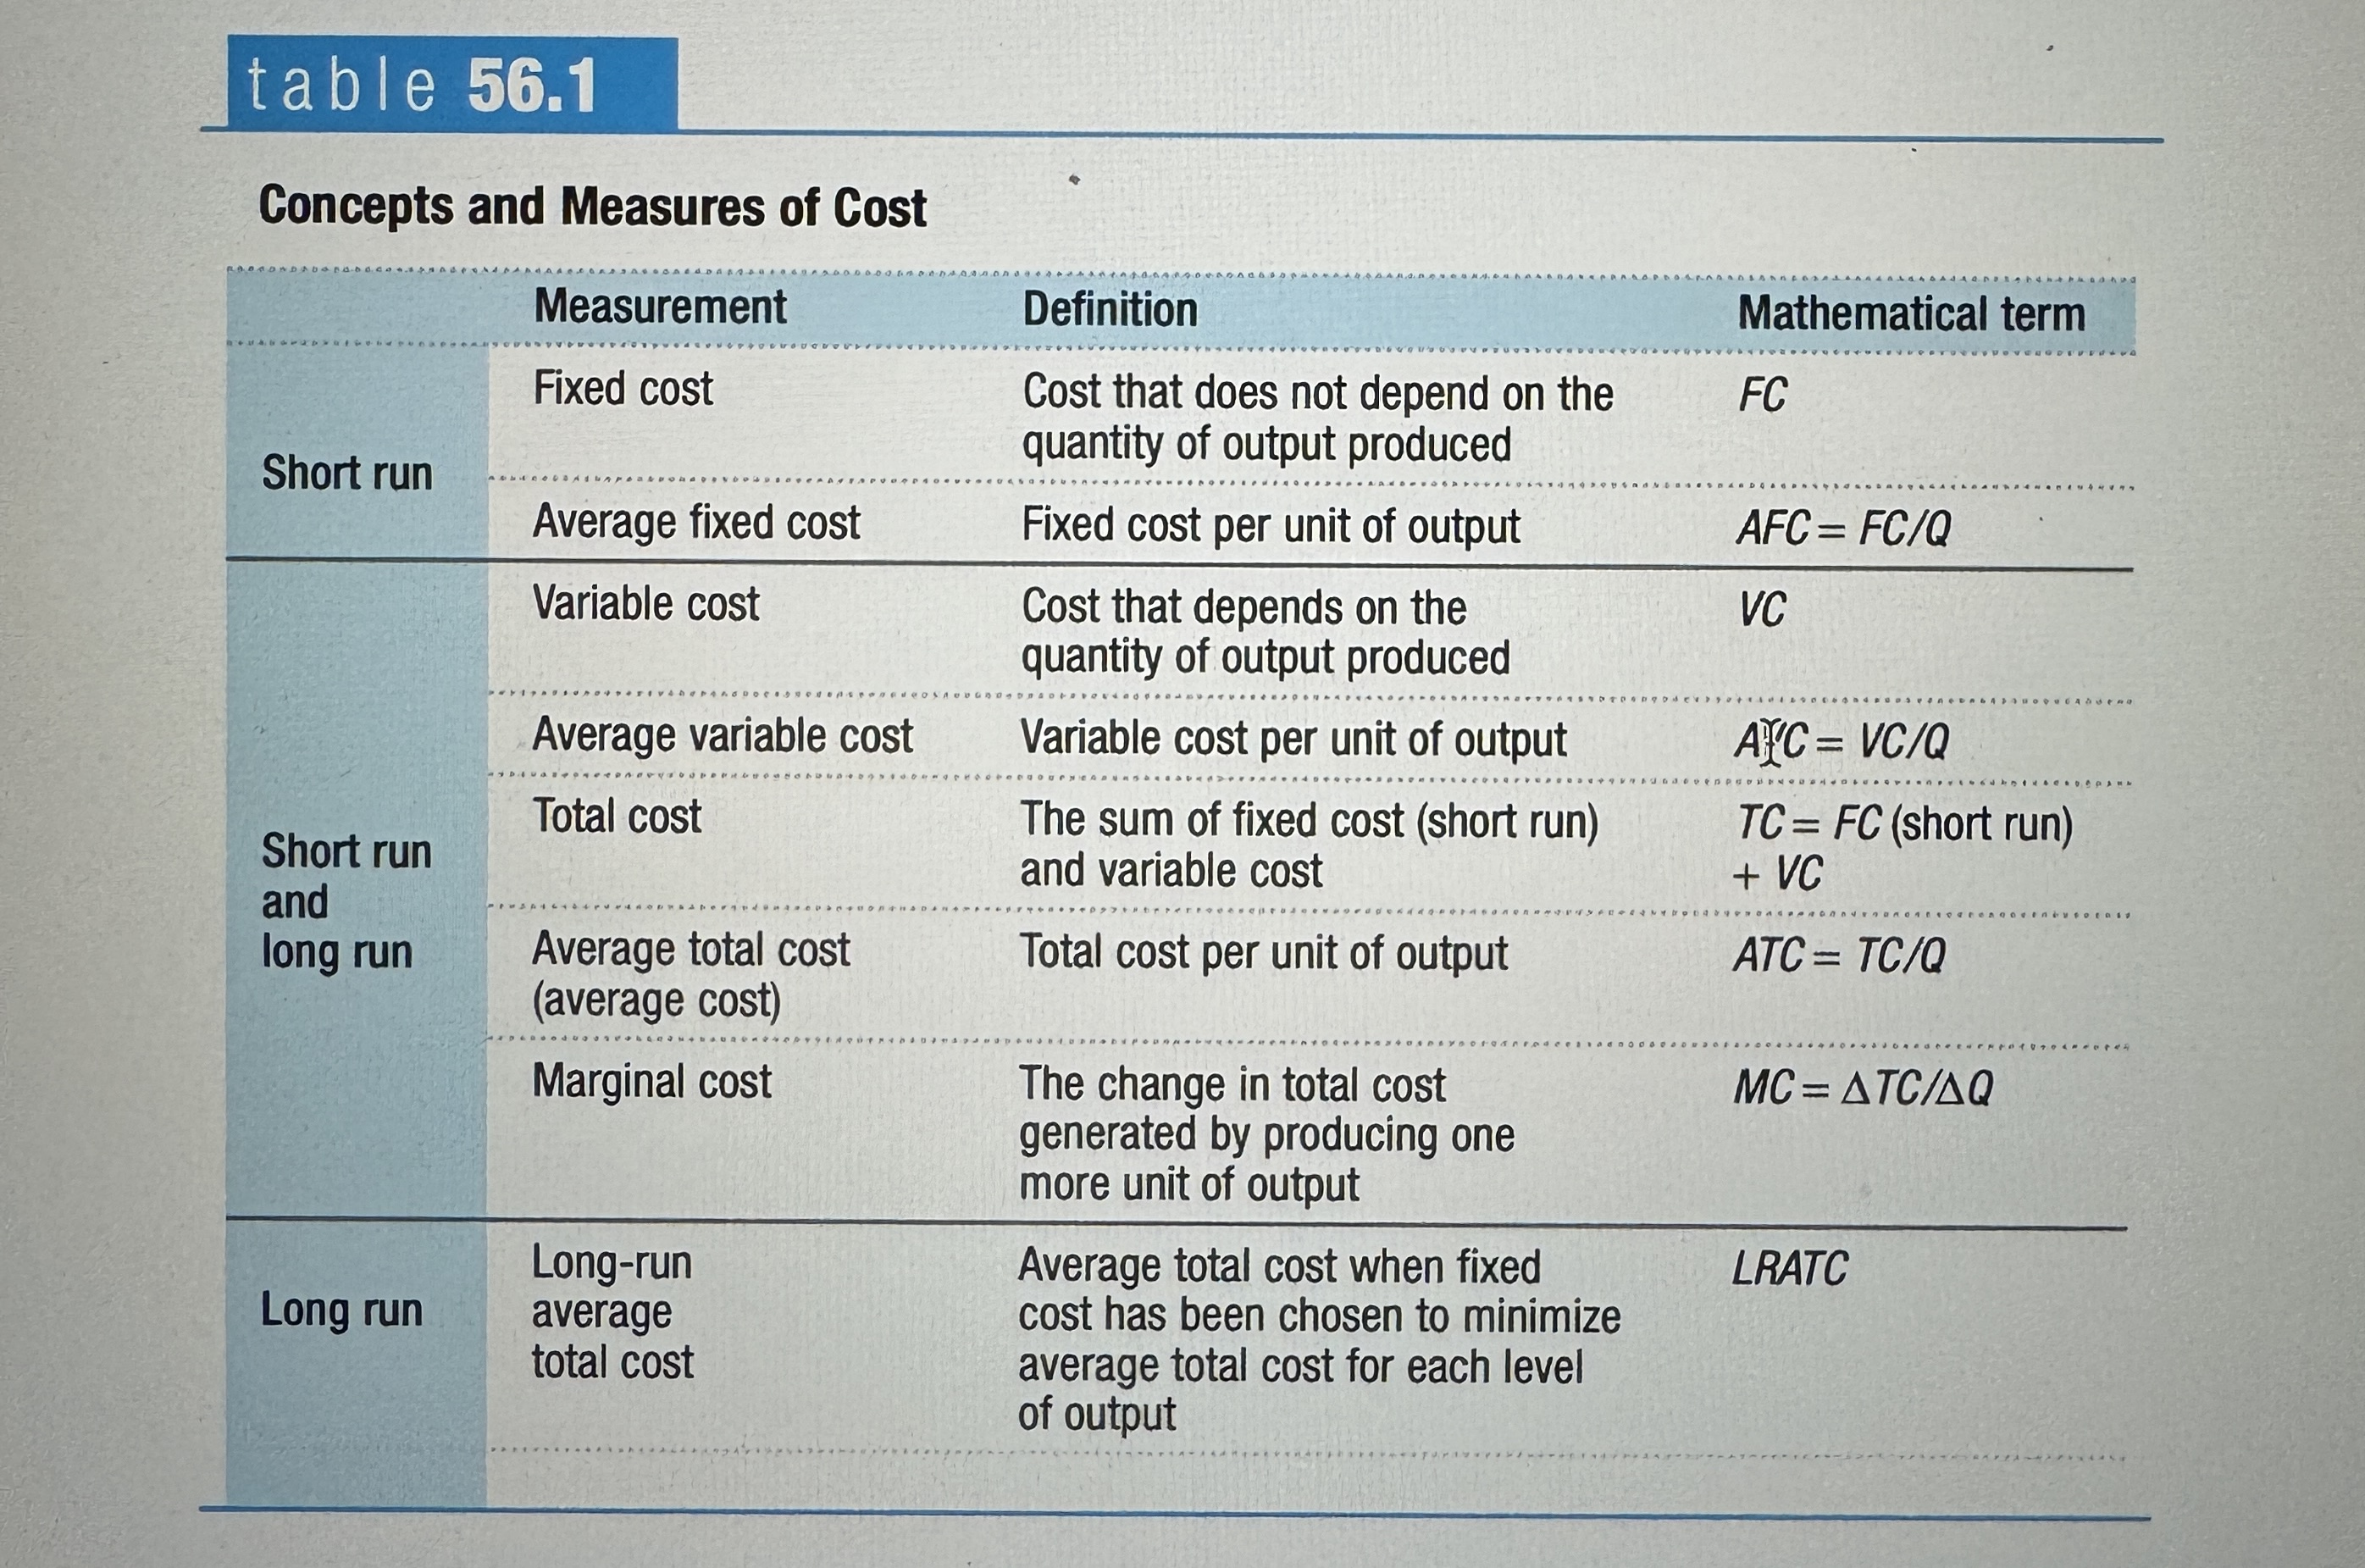
Concepts and Measurements of Cost
Ex.
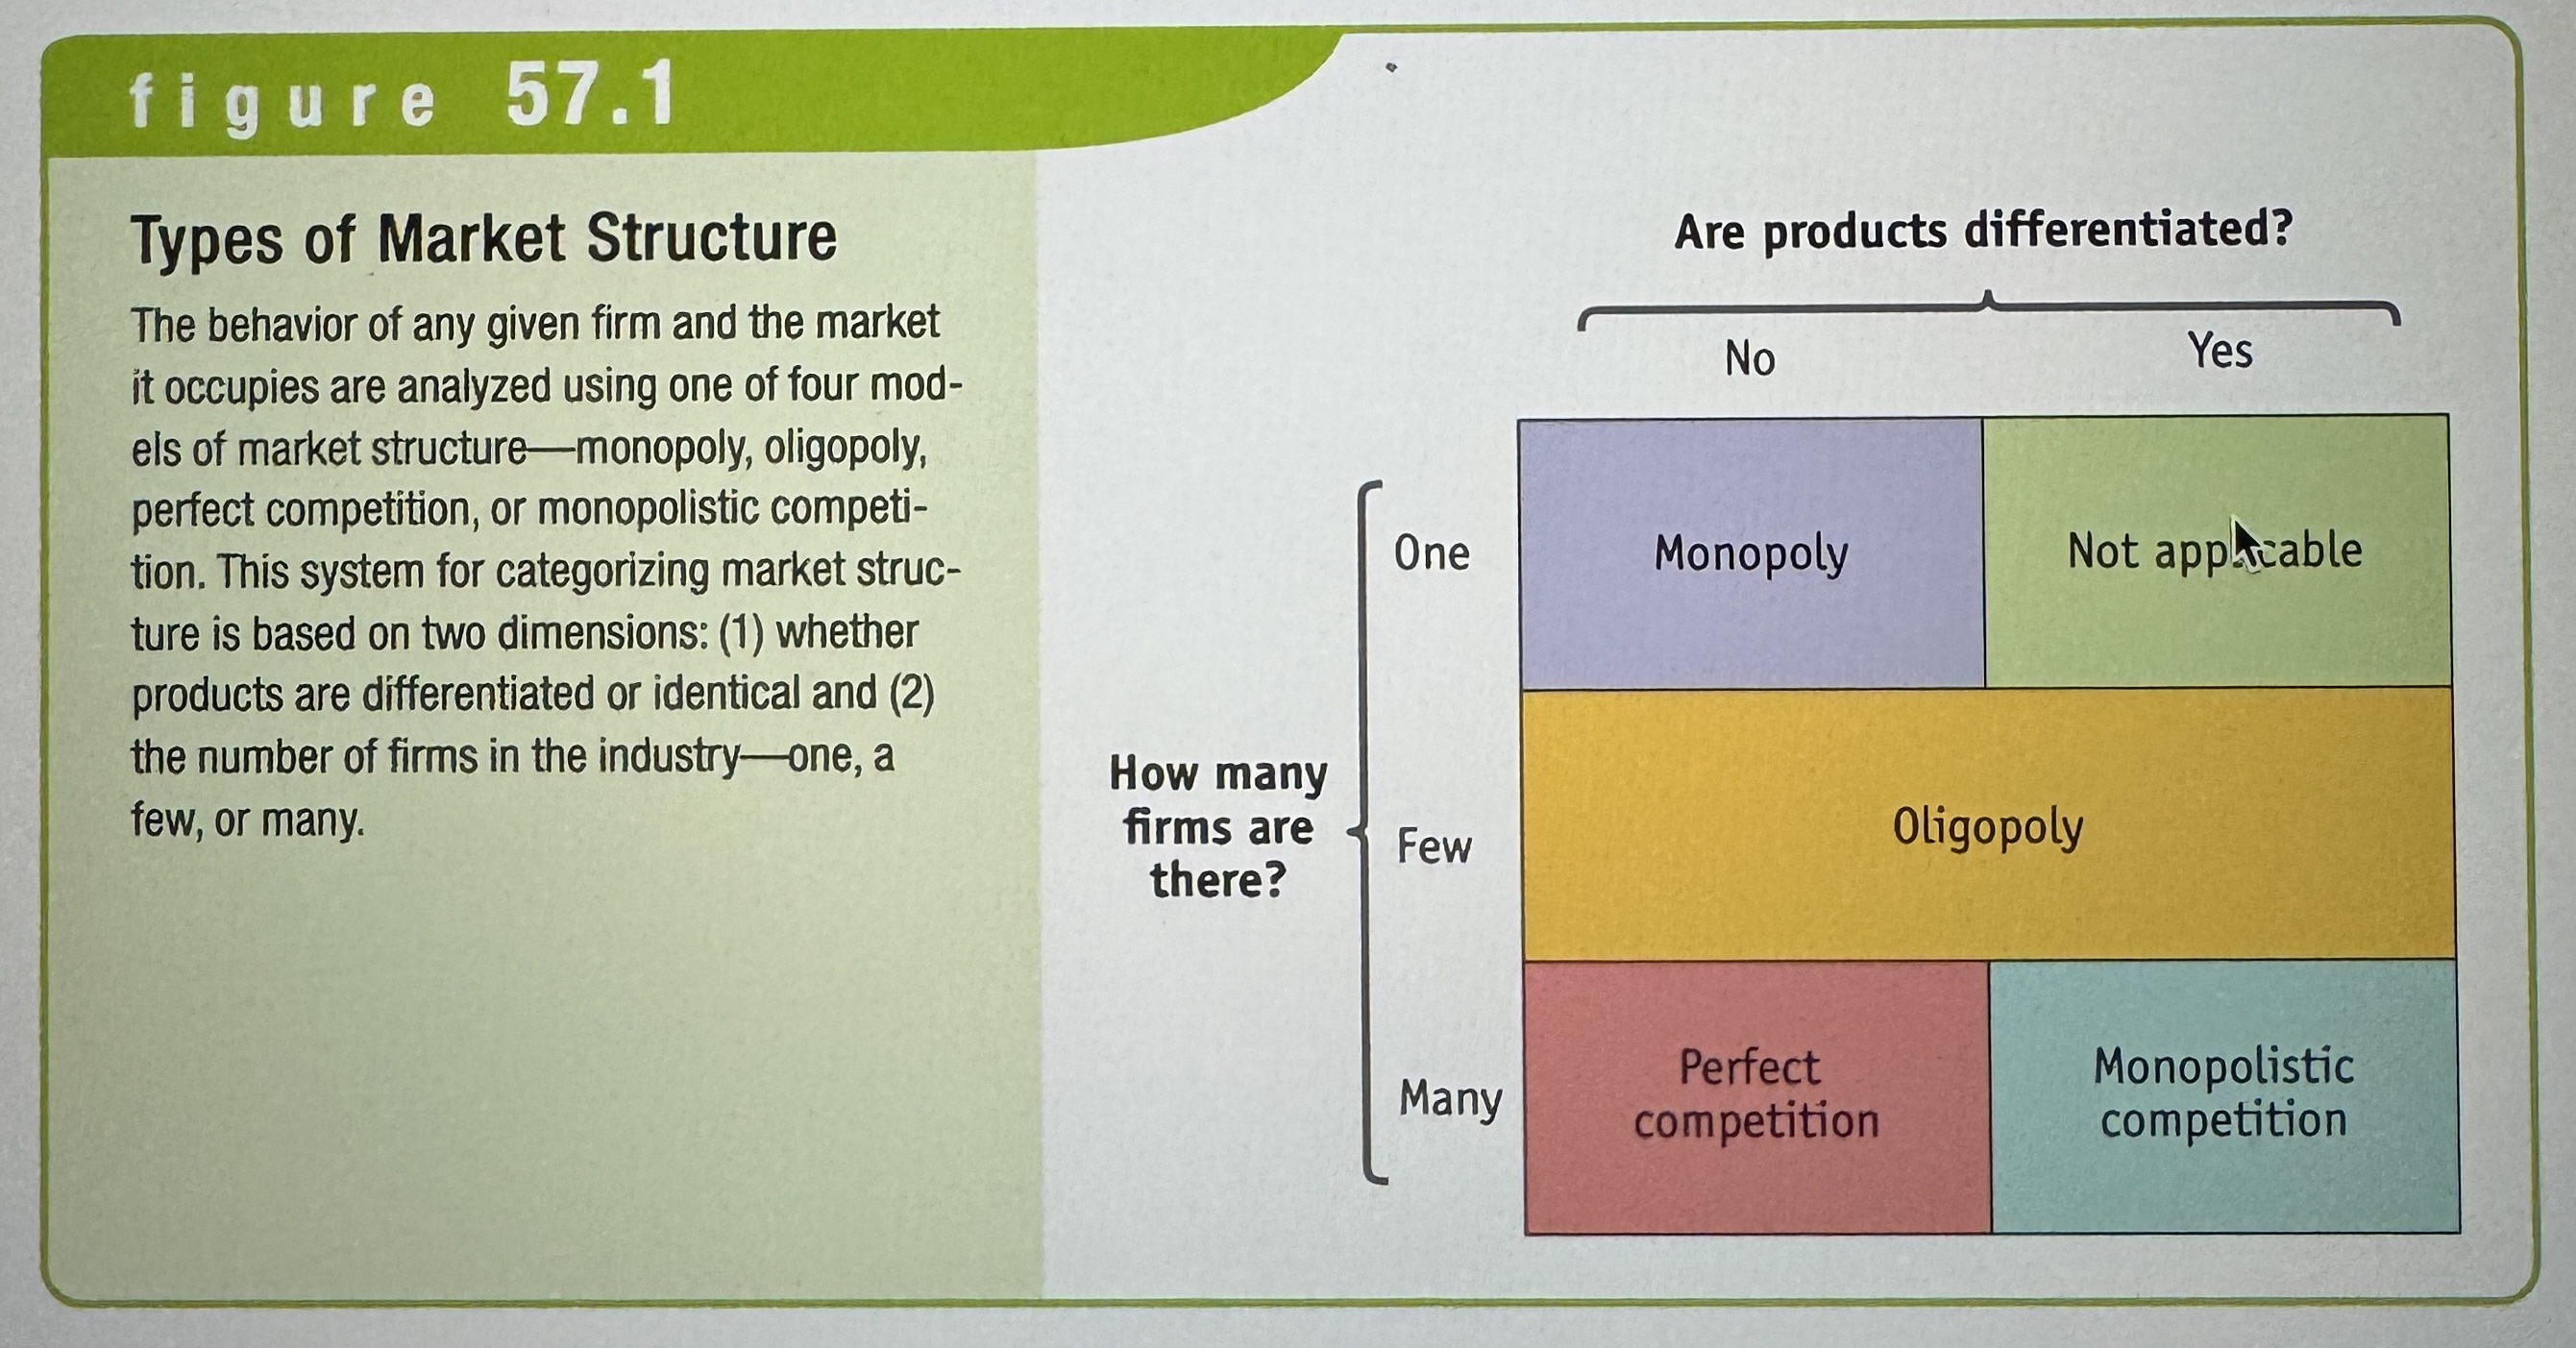
Types of Market Structure
Ex.
Price-Taking Firm
A firm whose actions have no effect on the market price of the good or service it sells.
Price-Taking Consumer
A consumer whose actions have no effect on the market price of the good or service he or she buys.
Perfectly Competitive Market
A market in which all market participants are price-takers.
Perfectly competitive industry
An industry in which firms are price-takers.
Market Share
A firms market share is the fraction of the total industry output accounted for by that firm’s output.
Standardized Product/ Commodity
A good is a standardized product, also known as a commodity, when consumers regard the products of different firms as the same good.
Free entry and exit
An industry has this when new firms can easily enter into the industry and existing firms can easily leave the industry.
Monopolies
A monopolist is the only producer of a good that has no close substitutes. An industry controlled by a monopolist is known as a monopoly.
Barrier to Entry
To earn economic profits monopolies must be protected by a barrier to entry – something that prevents other firms from entering the industry.
What are barriers to entry?
Control of a scarce resource or input
Economies of scale
Technological superiority
Government-created barriers
Natural Monopoly
This exists when economies to scale provide a large cost advantage to a single firm that produces all of an industry’s output.
Patent
Gives an inventor a temporary monopoly in the use or sale of an invention.
Copyright
Gives the creator of a literary or artistic work the soul right to profit from that work.
Oligopolies
An oligopoly is an industry with only a small number of firms. A producer in such an industry is known as an oligopolist.
Imperfect Competition
When no one firm has a monopoly, but producers nonetheless realize that they can affect market prices, an industry is characterized by imperfect competition.
Concentration Ratios
Measure the percentage of industry sales accounted for by the "X" largest firms, for example the four-firm concentration ratio or the eight-firm concentration ratio.
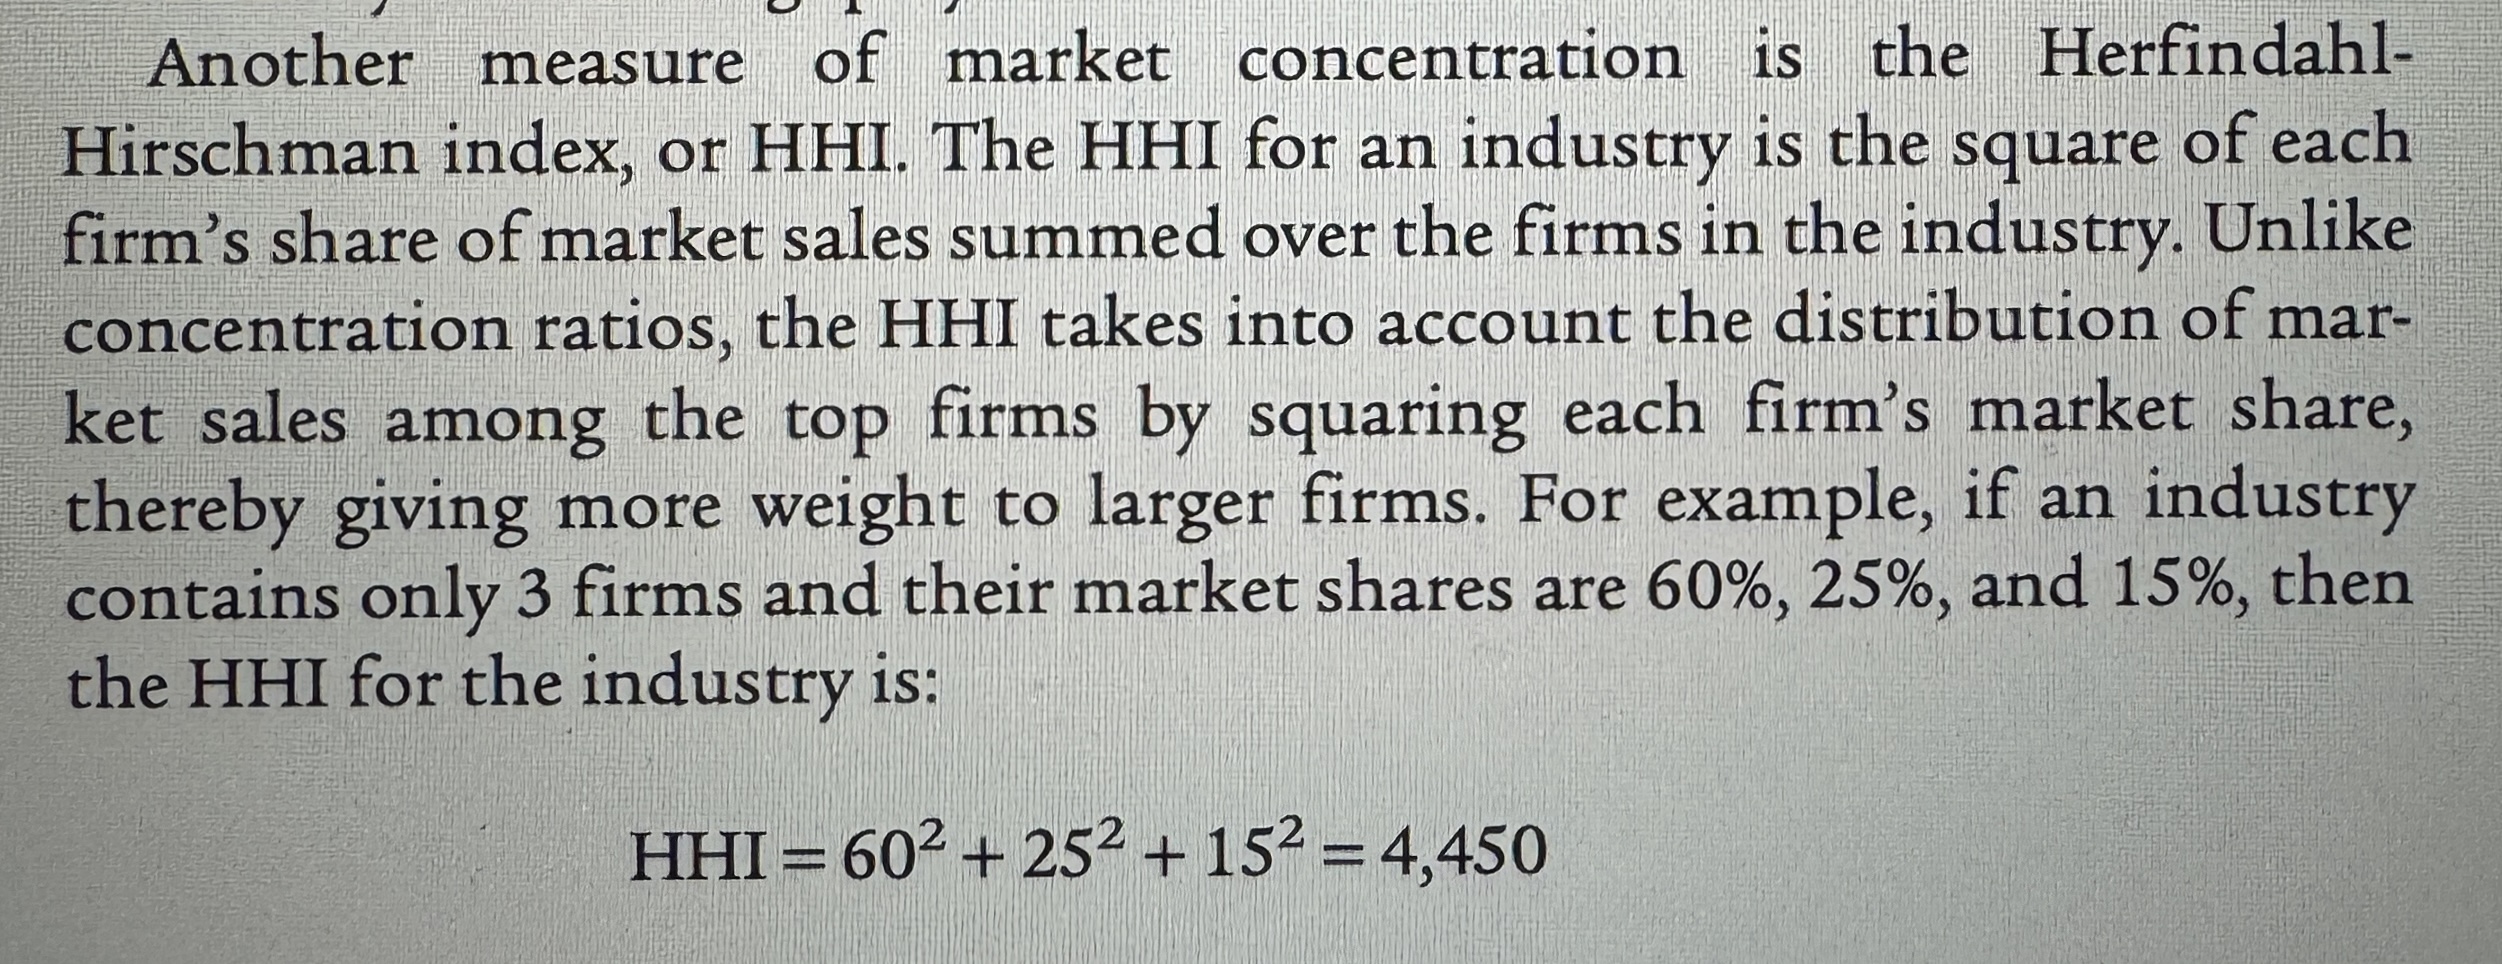
Herfindahl-Hirschman Index
Herfindahl-Hirschman Index, or HHI, is the square of each firm's share of market sales summed over the industry. It gives a picture of the industry market structure.
HHI Example
Ex.
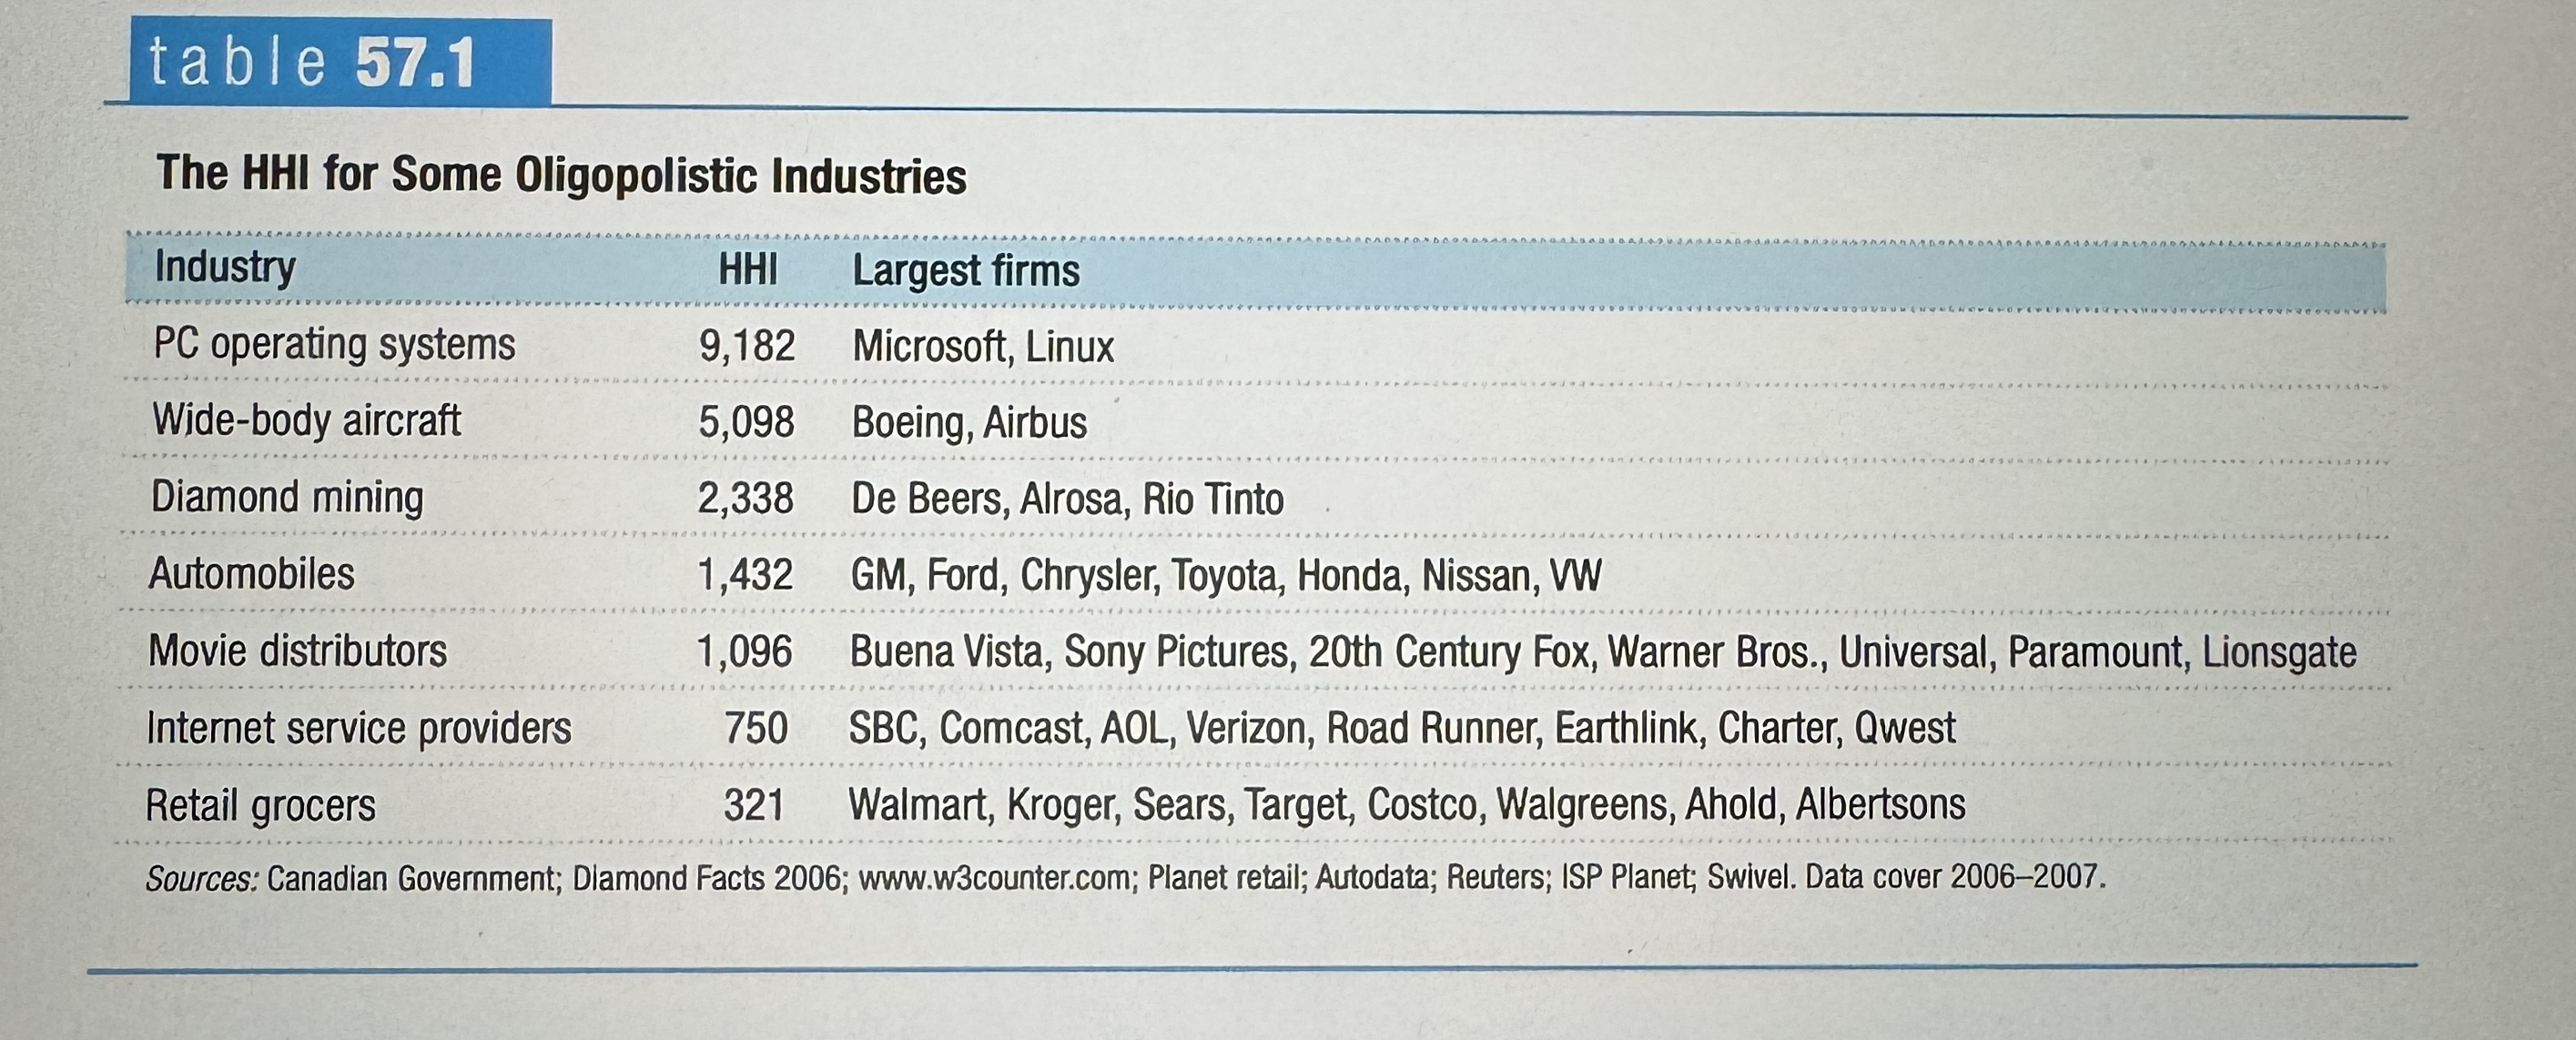
The HHI for Some Oligopolistic Industries
Ex.
Monopolistic Competition
Monopolistic competition is a market structure in which there are many competing firms in an industry, each firm sells a differentiated product, and there is free entry into and exit from the industry in the long run. It happens when a large number of competing firms exist, products are differentiated, and there is free entry and exit in the long run.