Bio 181 Key terms and questions for Module 1&2
1/145
There's no tags or description
Looks like no tags are added yet.
Name | Mastery | Learn | Test | Matching | Spaced |
|---|
No study sessions yet.
146 Terms
claim
an assertion about truth
dependent variable
a variable whose expected value depends on the value of another variable
evidence
information related to the accuracy of a claim
evolutionary theory
all organisms on Earth descended from a common ancestor
frequency
the number of times that a value within a range has been observed
intercept
a parameter that defines the value of the dependent variable when the value of the independent variable equals zero
median
the central value in an ordered set of numbers
minimum
the lowest value in a set of numbers
reasoning
the process of logically relating evidence to a claim
relationship
an association between the values of two variables, such that the expected value of one variable depends on the observed value of the other variable
relative frequency
the proportion or percentage of times that a value within a range was observed
residual
the quantity remaining after some value has been subtracted
residual sum of squares
a measure of the deviations between observed values of a dependent variable and the expected values determined by a linear model
scientific argument
a chain of reasoning that connects evidence to a claim
slope
a parameter that defines how a change in the value of the independent variable affects the expected value of the dependent variable
standard deviations
a parameter that represents the uncertainty in the value of a variable
sum of squares
a measure of the deviations between observed values of a variable and the mean
system
a set of components that interact as a network; the structure of a system determines its function
variable
a characteristic or quantity that changes according to the situation
variance
changes according to the situation
frequency distribution
enables one to predict the probability of observing specific values of a variable
independent variable
a variable whose expected value remains independent of the values of other variables
linear relationship
an association between the values of two variables that produces a straight line when graphed
maximum
the highest value in a set of numbers
mean
a parameter that defines the most likely value of a variable
Quantitative Data
Numerical information that can be measured. Can be:
Discrete (counted, e.g., number of fruits)
Continuous (measured, e.g., height)
Qualitative Data
Descriptive information based on observations using the five senses.
Constant
A value that remains unchanged (e.g., speed of light).
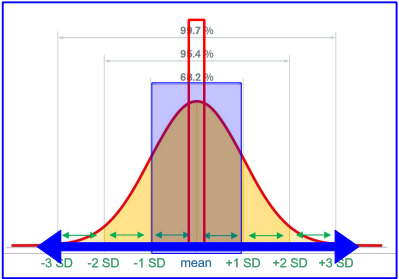
Normal Probability Distribution
Bell-Shaped Curve: Represents distribution of data points; most values are near the mean. Empirical Rule (68-95-99.7):
68% of data within 1 SD of the mean.
95% within 2 SDs of the mean.
99.7% within 3 SDs of the mean.
Inductive Reasoning
Starts with observations to form general conclusions (specific to general).
Deductive Reasoning
Applies general principles to predict specific outcomes (general to specific).
Bivariate Scatter Plot
Visualizes two variable relationships, e.g., body fat percentage vs. heart rate.
Positive Correlation
As x increases, y increases.
Negative Correlation
As x increases, y decreases.
Sigma (Σ)
Used to denote a sum of a series of values.
When evaluating an argument, we should ask a series of questions.
Is the claim clear and testable?
Is the evidence relevant and sufficient?
And finally, does the reasoning logically connect the claim to the evidence?
Read the argument below and identify whether each of the three highlighted sections represents A) the claim, B) evidence, or C) reasoning.
A species of non-poisonous frogs has evolved to look like a much more poisonous species that occurs in the same environment.
A) Claim: An assertion about truth
Read the argument below and identify whether each of the three highlighted sections represents A) the claim, B) evidence, or C) reasoning.
Biologists have identified numerous non-poisonous animals that have traits (e.g. coloration, body structure, etc.) resembling those of poisonous animals. It is thought that this resemblance improves the survival of the non-poisonous animals, because a predator that has tasted a poisonous animal has learned to avoid any animal that resembles that animal.
C) Reasoning: the process of logically relating evidence to a claim
Read the argument below and identify whether each of the three highlighted sections represents A) the claim, B) evidence, or C) reasoning.
Using a technology that produces an image of a frog as seen by a bird's eyes, the scientists showed that non-poisonous frogs more closely resembled their poisonous neighbors much more than they resembled their non-poisonous relatives in other regions.
Evidence: information related to the accuracy of a claim
Read the argument below and identify whether each of the three highlighted sections represents A) the claim, B) evidence, or C) reasoning.
In years when the temperature was higher than the previous year, the birds' prey, caterpillars, emerged earlier than usual. In response, the birds laid their eggs about 5 days earlier in the year.
Evidence: information related to the accuracy of a claim
Read the argument below and identify whether each of the three highlighted sections represents A) the claim, B) evidence, or C) reasoning.
This shift in the timing of reproduction ensured that baby birds hatched when the most food was available. The birds appeared to be changing their behavior in response to climate change, increasing the chance that their offspring would survive. If the birds had not responded to climate change, they would have continued to reproduce at the same time of year, regardless of when food was available.
Reasoning: the process of logically relating evidence to a claim
Read the argument below and identify whether each of the three highlighted sections represents A) the claim, B) evidence, or C) reasoning.
birds appear to have shifted their reproductive behavior in response to climate change.
A) Claim: An assertion about truth
True or false? The number of centimeters in a meter is a variable.
False
True or false? The number of grams in a kilogram is a variable.
False
True or false? The number of fish in a pond is a variable.
True
True or false? The number of flowers on a tree is a variable.
True
To design a new health supplement, a drug company needed to know the typical amount of testosterone circulating in the blood of potential users. Blood was sampled from 725 individuals to measure the concentration of testosterone. Use this sample to answer the question.
The following set of numbers represents a sample of the data:
[9.8, 10.1, 10.1, 10.1, 11.8, 11.8, 12.1, 12.9, 13.0, 13.7, 14.4]
11.8
The following set of numbers represents a sample of the data: [9.8, 10.1, 10.1, 10.1, 11.8, 11.8, 12.1, 12.9, 13.0, 13.7, 14.4] Which value equals the minimum?
9.8
The following set of numbers represents a sample of the data:
[9.8, 10.1, 10.1, 10.1, 11.8, 11.8, 12.1, 12.9, 13.0, 13.7, 14.4]
Which value equals the maximum?
14.4
The following set of numbers represents a sample of the data:
[2, 3, 3, 3, 4, 4, 5, 5, 6, 6, 7]
What is the frequency of the value 2?
1
The following set of numbers represents a sample of the data:
[2, 3, 3, 3, 4, 4, 5, 5, 6, 6, 7]
What is the frequency of the value 3?
3
The following set of numbers represents a sample of the data:
[2, 3, 3, 3, 4, 4, 5, 5, 6, 6, 7]
What is the relative frequency of the value 5?
0.18
The following set of numbers represents a sample of the data:
[2, 3, 3, 3, 4, 4, 5, 5, 6, 6, 7]
What is the relative frequency of the value 7?
0.09

Which value is closest to the maximal number of mistakes?
17

Which value is closest to the median number of mistakes?
5
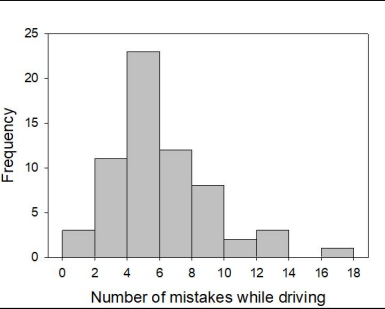
Assume that an error in the data was discovered. One value in the range of 6 to 8 was actually in the range of 12 to 14.
Complete the following sentence. If the error were corrected, the probability of observing a value less than 10 would ______.
decrease

Assume that an error in the data was discovered. One value in the range of 16 to 18 was actually in the range of 12 to 14.
Complete the following sentence. If the error were corrected, the probability of observing a value greater than 10 would ______.
remain the same

Assume that an error in the data was discovered. One value in the range of 2 to 4 was actually in the range of 10 to 12.
Complete the following sentence. If the error were corrected, the probability of observing a value greater than 10 would ______.
increase
Which statement best defines a probability?
a mathematical function that enables one to calculate the probability of observing a value within any range
Which statement best defines a parameter?
a constant in a mathematical function
Which statement best defines the mean of a normal probability distribution?
a parameter that represents the expected value of a variable

Which of the following test score values is most likely to be observed?
220

Which of the following values would be closest to the mean number of test scores?
210

Which of the following values would likely be more than one standard deviation greater than the mean number of test scores?
255
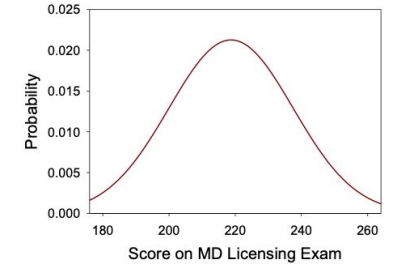
Which of the following values would likely be more than one standard deviation less than the mean number of test scores?
175
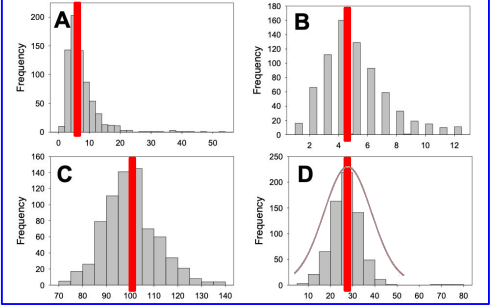
Use the frequency distributions below, labeled A-D, to answer the question. Which frequency distribution would be best modeled by a normal probability distribution with a mean of 30?
Plot D

Use the frequency distributions below, labeled A-D, to answer the question. Which frequency distribution would be best modeled by a normal probability distribution with a mean of 100?
Plot C

Use the frequency distributions below, labeled A-D, to answer the question. Which frequency distribution would be best modeled by a normal probability distribution with the largest standard deviation?
Plot C

Use the frequency distributions below, labeled A-D, to answer the question. True or False? Compared to the frequency distribution in plot A, the frequency distribution in plot C better matches the shape of a normal probability distribution.
true
The mean and standard deviation of height for a person equals 78 inches and 5 inches, respectively. Consider the following lists of values. Which list is ordered from the most likely to the least likely values?
78, 81, 74, 85, 42

The mean and standard deviation of weight for a smartphone equals 130 grams and 2 grams, respectively. Consider the following lists of values.
Which list is ordered from the least likely to the most likely values?
120, 134, 128, 131, 130

The mean and standard deviation of weight for beagles, a type of dog, equals 25 pounds and 5 pounds, respectively. Which of the following values is most likely to be observed?
27

The mean and standard deviation of length of Great White Shark females is 18 feet and 3 feet respectively. What is the probability that one would find a shark that is 20 feet or less in length?
0.75
Which condition must hold for a normal probability distribution to accurately describe a frequency distribution?
Intermediate values occur more frequently than extreme values.
True or False? A normal probability distribution predicts the probability of observing any value in a continuous range.
True
True or False? A normal probability distribution can have a shape with two peaks.
False
True or False? A normal probability distribution can have an asymmetrical shape.
False
True or False? For a normal probability distribution, a value that is one standard deviation above the mean is equally likely as a value that is one standard deviation below the mean.
True
True or False? For a normal probability distribution, the value of the mean depends on the standard deviation.
False
True or False? For a normal probability distribution, the value of the standard deviation depends on the mean.
True
True or False? For a normal probability distribution, the likelihood of observing a value equal to the mean depends on the standard deviation.
True
True or false? To estimate the best value of the mean, one must know the standard deviation.
False
True or false? To estimate the best value of the mean, one must know the sample size.
True
True or false? The best value of the mean will minimize the sum of squares.
True
True or false? The best value of the mean will minimize the standard deviation.
True
True or false? The standard deviation is typically smaller than the sum of squares.
True
True or false? The standard deviation increases as the range of observed values increases.
True
True or false? For a given number of observations, the standard deviation increases as the sum of squares increases.
True
True or false? The standard deviation increases as the probability of observing the mean value increases.
False
![<p>Researchers observed the following values of a variable:</p><p>[10.6, 18.2, 18.7, 18.8, 20.1, 20.5,20.8, 21.6, 21.8, 22.2, 24.0, 26.6, 26.9, 28.7, 29.6, 30.3, 34.3, 37.3, 39.0, 40.3]</p><p>Evaluate the fit of a normal probability function and values of a variable</p><p>Each of the plots shows a normal probability. Rank these plots from the most likely fit to the least likely fit to the data.</p>](https://knowt-user-attachments.s3.amazonaws.com/9720c284-2324-47a3-b864-1057a1673f40.png)
Researchers observed the following values of a variable:
[10.6, 18.2, 18.7, 18.8, 20.1, 20.5,20.8, 21.6, 21.8, 22.2, 24.0, 26.6, 26.9, 28.7, 29.6, 30.3, 34.3, 37.3, 39.0, 40.3]
Evaluate the fit of a normal probability function and values of a variable
Each of the plots shows a normal probability. Rank these plots from the most likely fit to the least likely fit to the data.
B. D, C, A, B
Researchers collected the following set of data: 1, 4, 6, 7, 9, 11. Which value equals the mean?
6.3
Researchers collected the following set of data: 15, 18, 20, 21, 24. Which value equals the mean?
19.6
Researchers estimated the mean of a set of data to be 98. Which set of data was used to calculate this mean?
61, 67, 85, 87, 90, 104, 105, 107, 109, 122, 139
Researchers estimated the mean of a set of data to be 68. Which set of data was used to calculate this mean?
31, 48, 52, 55, 61, 78, 82, 98, 104
Researchers collected the following set of data: 1.0, 4.0, 6.0, 7.0, 9.0, 11.0.
If the mean of the data equals 6.3, which value equals the sum of squares?
63.3
Researchers collected the following set of data: 15, 18, 20, 21, 24. If the sum of squares equals 45.2, which quantity equals the standard deviation?
3.4
Researchers estimated the standard deviation of a set of data to be 22.9. Which set of data was used to calculate this standard deviation?
A. 31, 48, 52, 54, 55, 61, 68, 78, 82, 98, 104
B. 3, 10, 14, 27, 29, 33, 39, 41, 46, 51, 67
C. 41, 55, 62, 65, 71, 83, 89, 90, 91, 93, 98
D. 61, 67, 85, 87, 90, 104, 105, 107, 109, 122, 139
D. 61, 67, 85, 87, 90, 104, 105, 107, 109, 122, 139
Researchers estimated the standard deviation of a set of data to be 13.4. Which set of data was used to calculate this standard deviation?
A. 3, 5, 8, 9, 9, 10, 12, 15, 17
B. 31, 48, 52, 55, 61, 78, 82, 98, 104
C. 57, 62, 65, 71, 74, 83, 89, 91, 93
D. 72, 76, 79, 83, 90, 91, 94, 97, 99
C. 57, 62, 65, 71, 74, 83, 89, 91, 93
Consider a linear function expressed as y = ax + b.
Which of the following elements is represented by y?
dependent variable
Consider a linear function expressed as y = ax + b.
Which of the following elements is represented by x?
independent variable