Biostatistics exam 3 - Linear Regression
1/32
There's no tags or description
Looks like no tags are added yet.
Name | Mastery | Learn | Test | Matching | Spaced | Call with Kai |
|---|
No analytics yet
Send a link to your students to track their progress
33 Terms
Regression
regression is a method that predicts values of one numerical variable from values of another numerical variable
• Fits a line through the data
- used for prediction
- measures how steeply one variable changes with another
Correlation versus regression
• correlation measures the aspects of the linear relationship between two numerical variables
- measures the association between X and Y
• regression predicts values of Y given X
Linear regression
• the most common type of regression ( there are nonlinear models)
• draws a straight line through the data to predict the response variable (Y) from the explanatory variable (X)
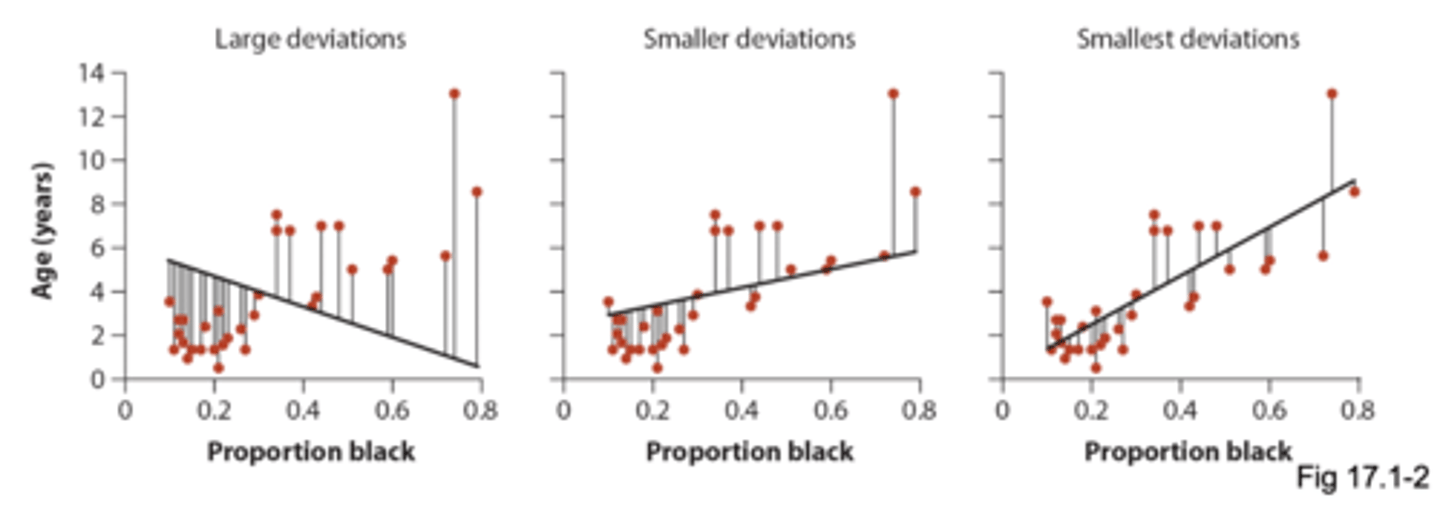
least squares regression
Line for which the sum of all the squared deviations in y is smallest
• deviations: distance between data point and the line
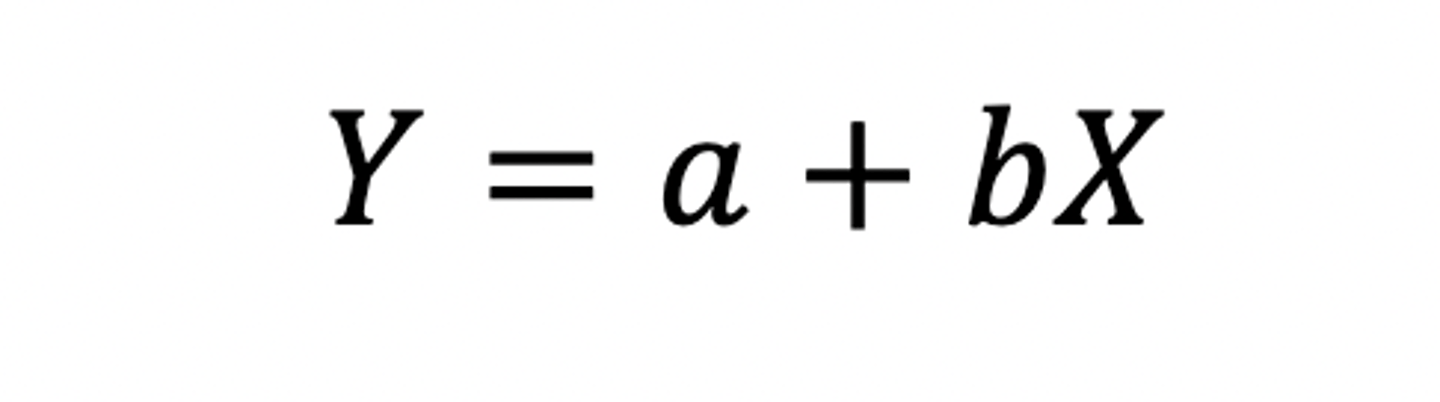
Formula for the linear regression
• a = y-intercept, b is the slope
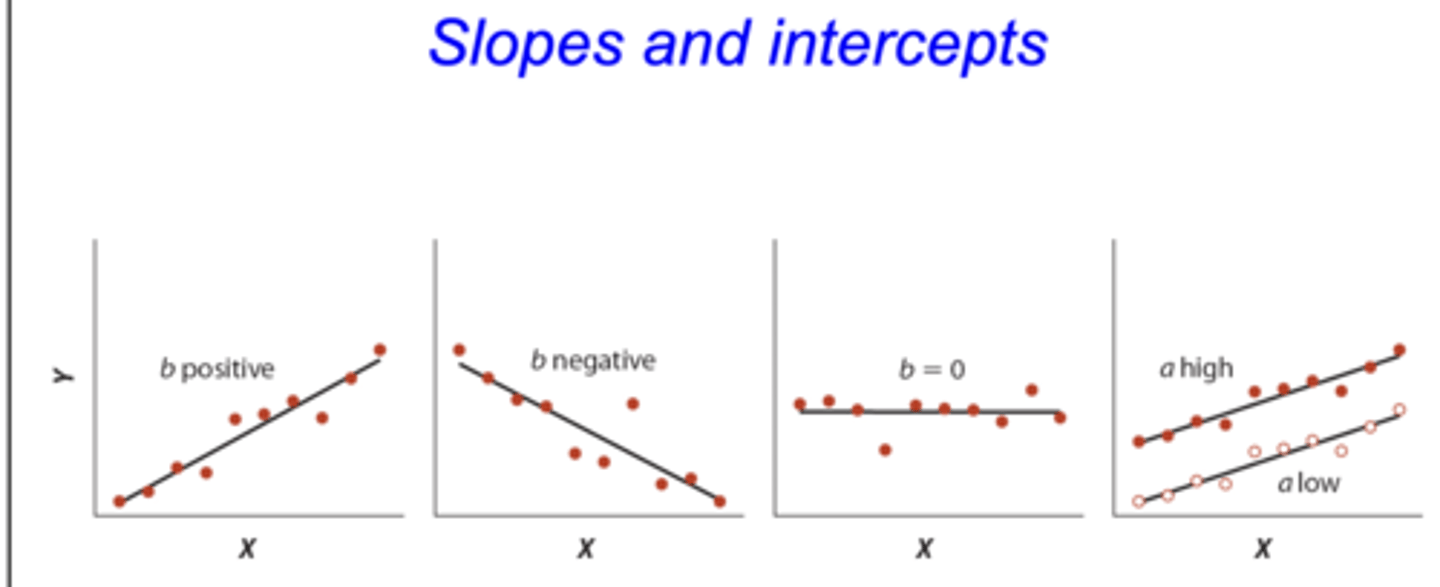
Slope of a linear regression
• the slope of a linear regression is the rate of change in y per unit X (rise of a run)
• also measures direction of prediction
- positive: as X increases y increases
- negative: as X increases y decreases
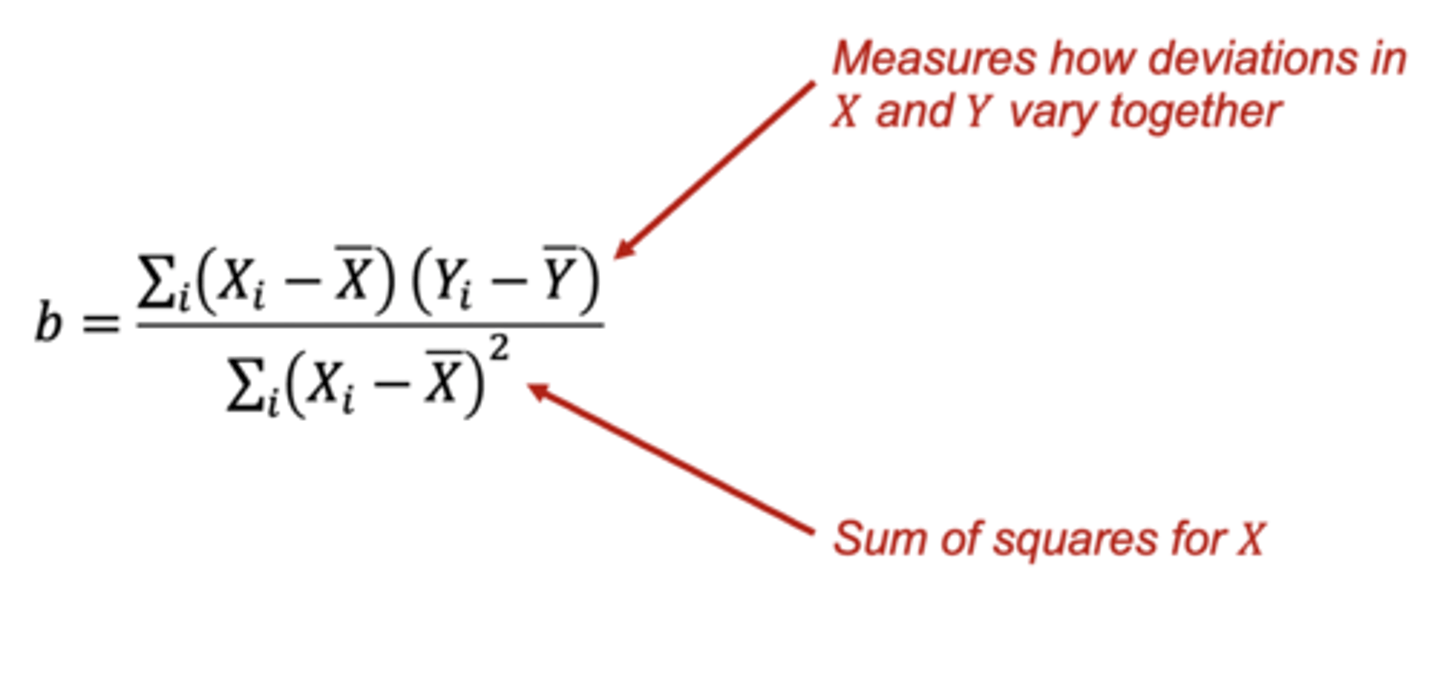
How to calculate the slope (linear regression) - equation
• numerator measures how deviations and X and Y vary together (can be pos or neg)
• denominator is the sum of squares for x
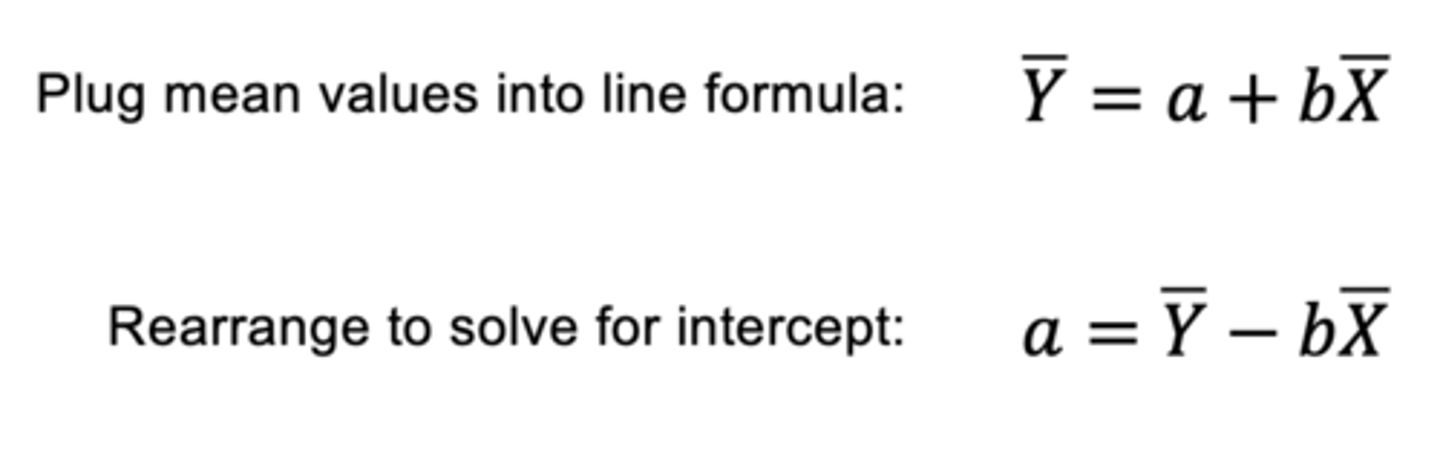
How to calculate the intercept (linear regression)
• one slope is calculated, getting intercept is straightforward because the least squares regression always goes through (Xbar, Ybar)
• plug mean values into line formula → rearrange to solve for intercept
estimates / statistics and parameters for a linear regression
• estimates/statistics: (b) slope and intercept (a)
- estimated from a sample of measurements
• Parameters: slope (β) and intercept (α)
- from the true population
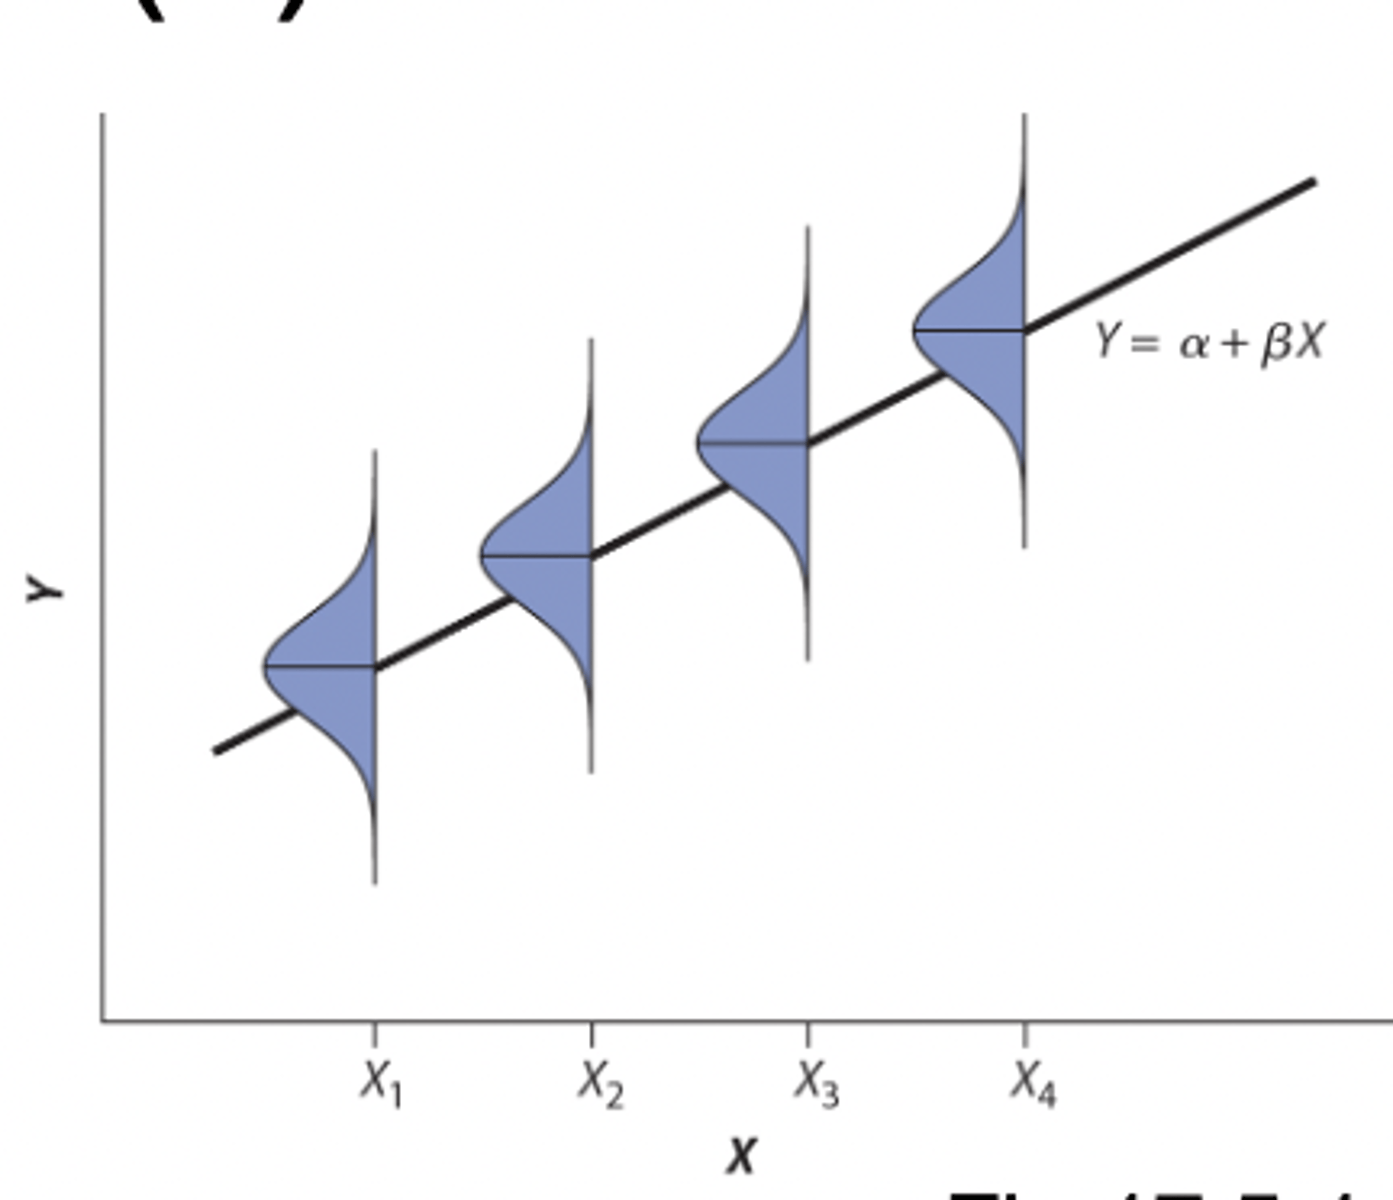
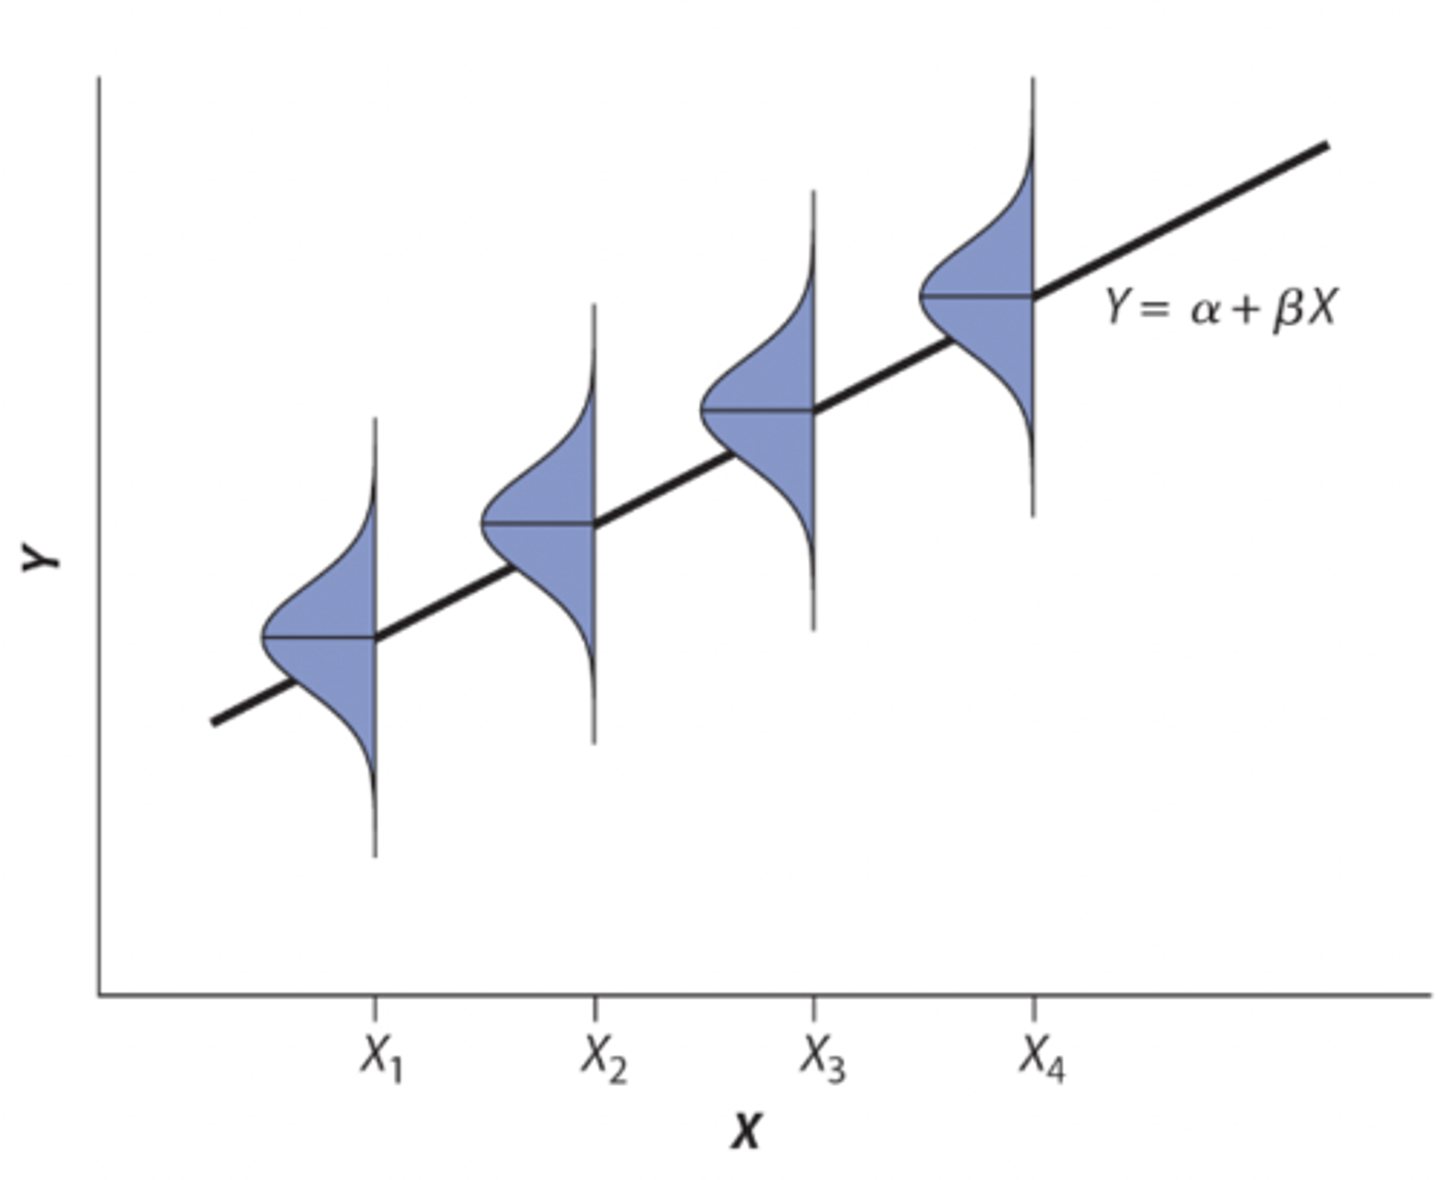
regression assumption
Regression assumes that there is a population for every value of X, and the mean Y for each of these populations lies on the regression line
• assumes the spread is the same in each subpopulation (you don't want a funnel)
Predicting values with a linear regression
•can predict values of Y for any specified value of x
- you can't predict X based off Y because (in the study) you're using the explanatory variable to predict Y not the other way around
• predictions are mean Y for all individuals with value X
• designated Y^ "Y-hat"
• use the linear regression formula to plug in a value of x and solve for y
Residual
the residual of a point is the difference between its measured Y value and the value of y predicted by the regression line
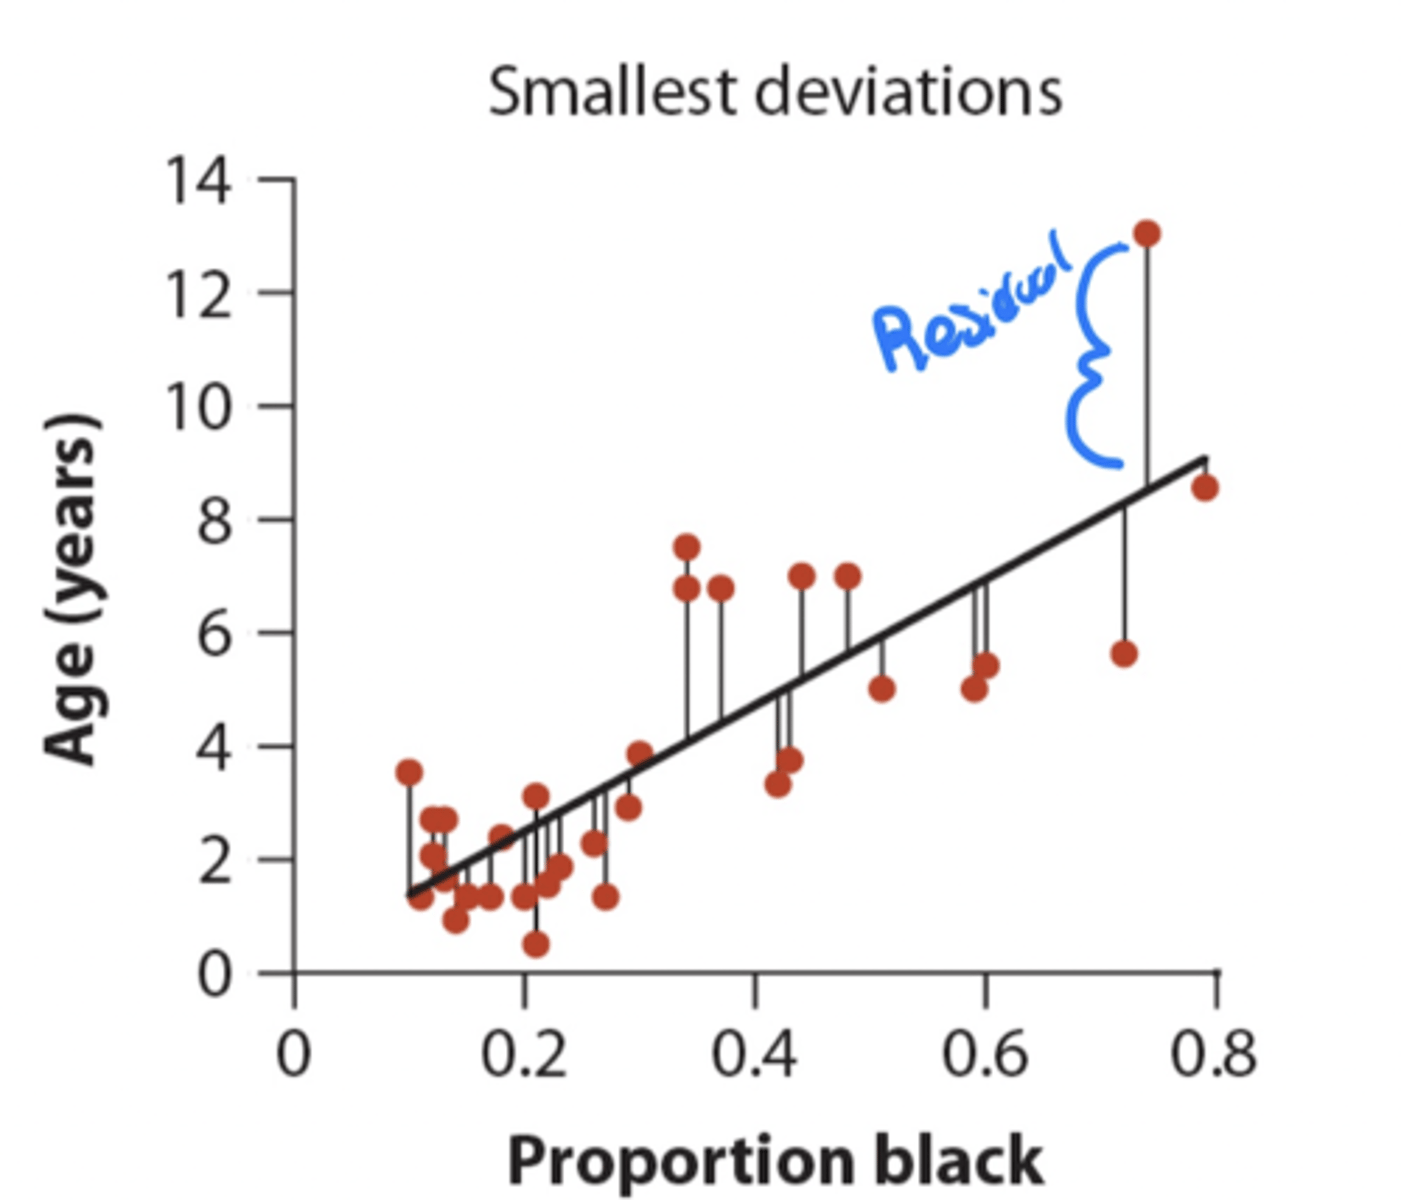
How do you measure how well the data fits the line?
• residuals measure the scatter of points above and below the least squares regression line
- can be positive or negative
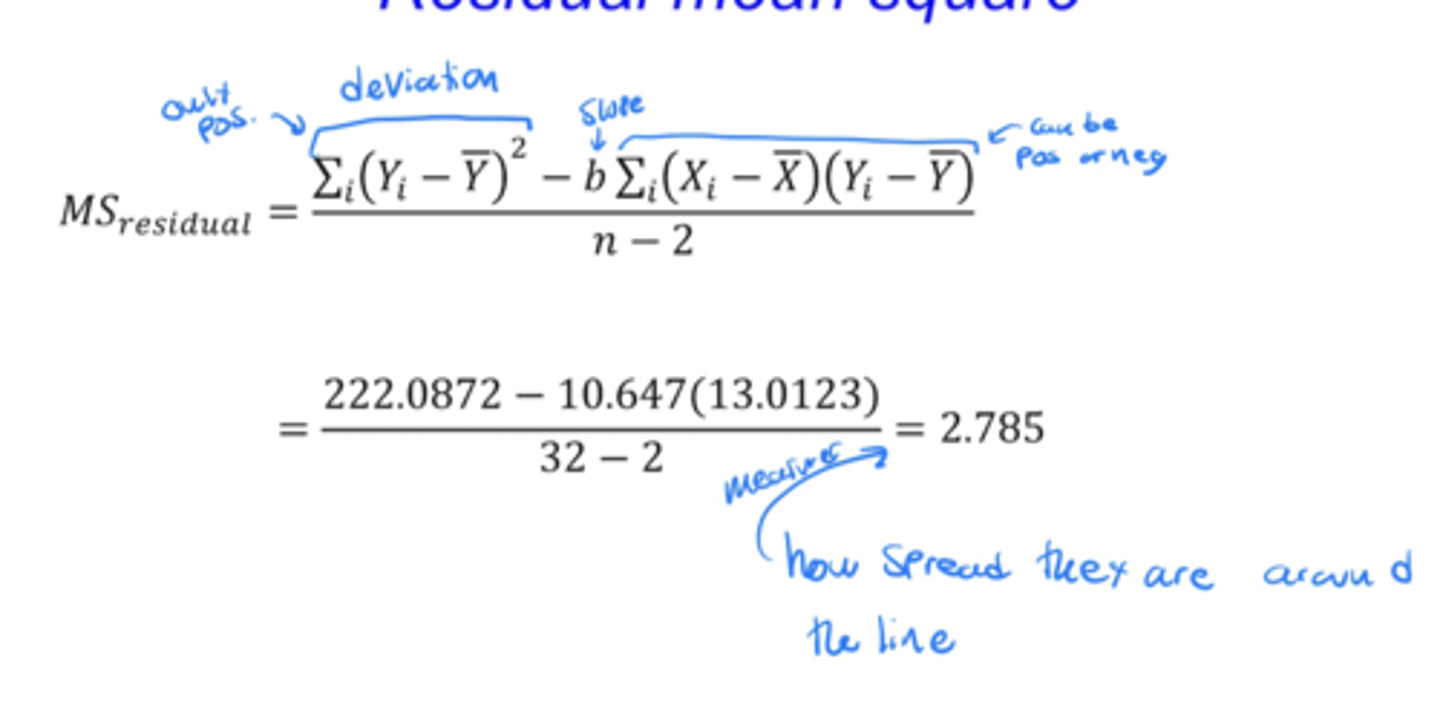
• variance in residuals (MSresidual) quantifies the spread of the scatter
- residual mean square
- analogous to error square in ANOVA
- used to quantify the uncertainty of the slope
Residual mean square equation
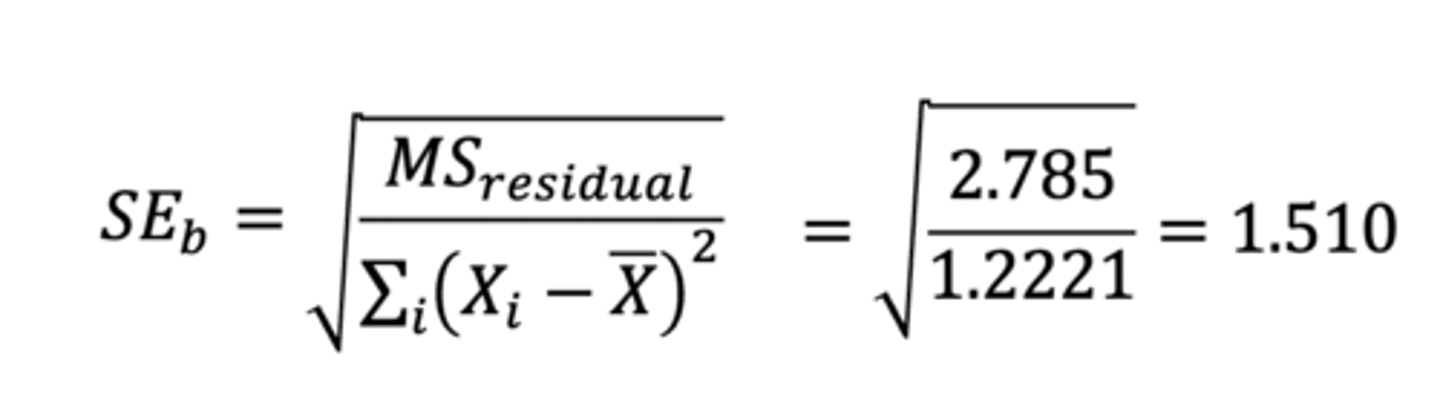
standard error of the slope (equation)
• uncertainty (precision) with the sample estimate (b) of the population slope (β)
• the sum of squares in the denominator takes into account as you add more data points you expect more spread
• in the numerator is the spread of the residuals
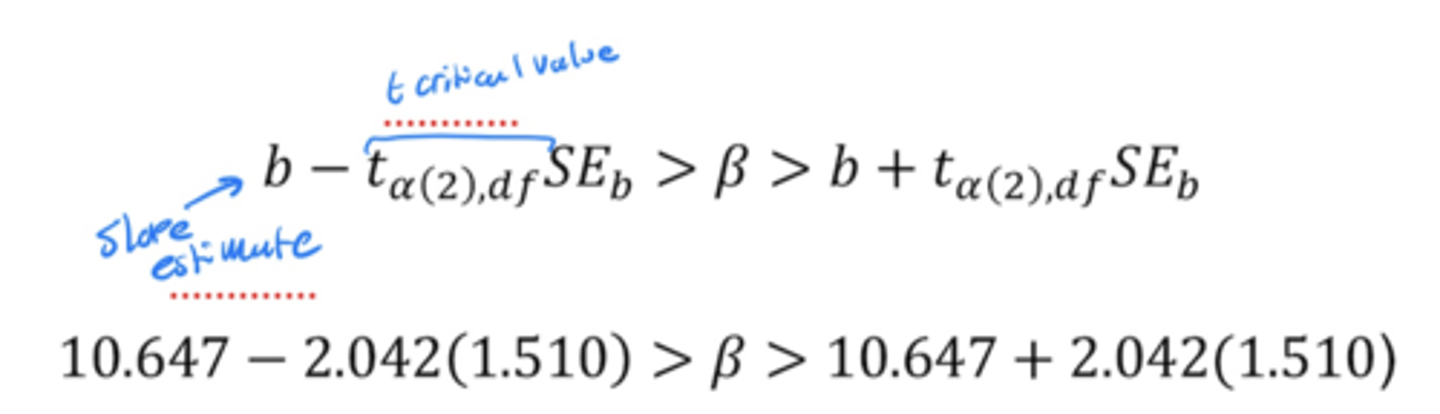
Confidence interval of the slope
The two types of predictions
1. predict mean Y for a given X
- e.g. what is the mean age of all male lions whose noses are 60% black
2. predict single Y for a given X
- e.g.how old is that lion over there with a 60% black nose
* both predictions give the same value of Y-hat but they differ in precision
• can predict mean with more certainty than a single value
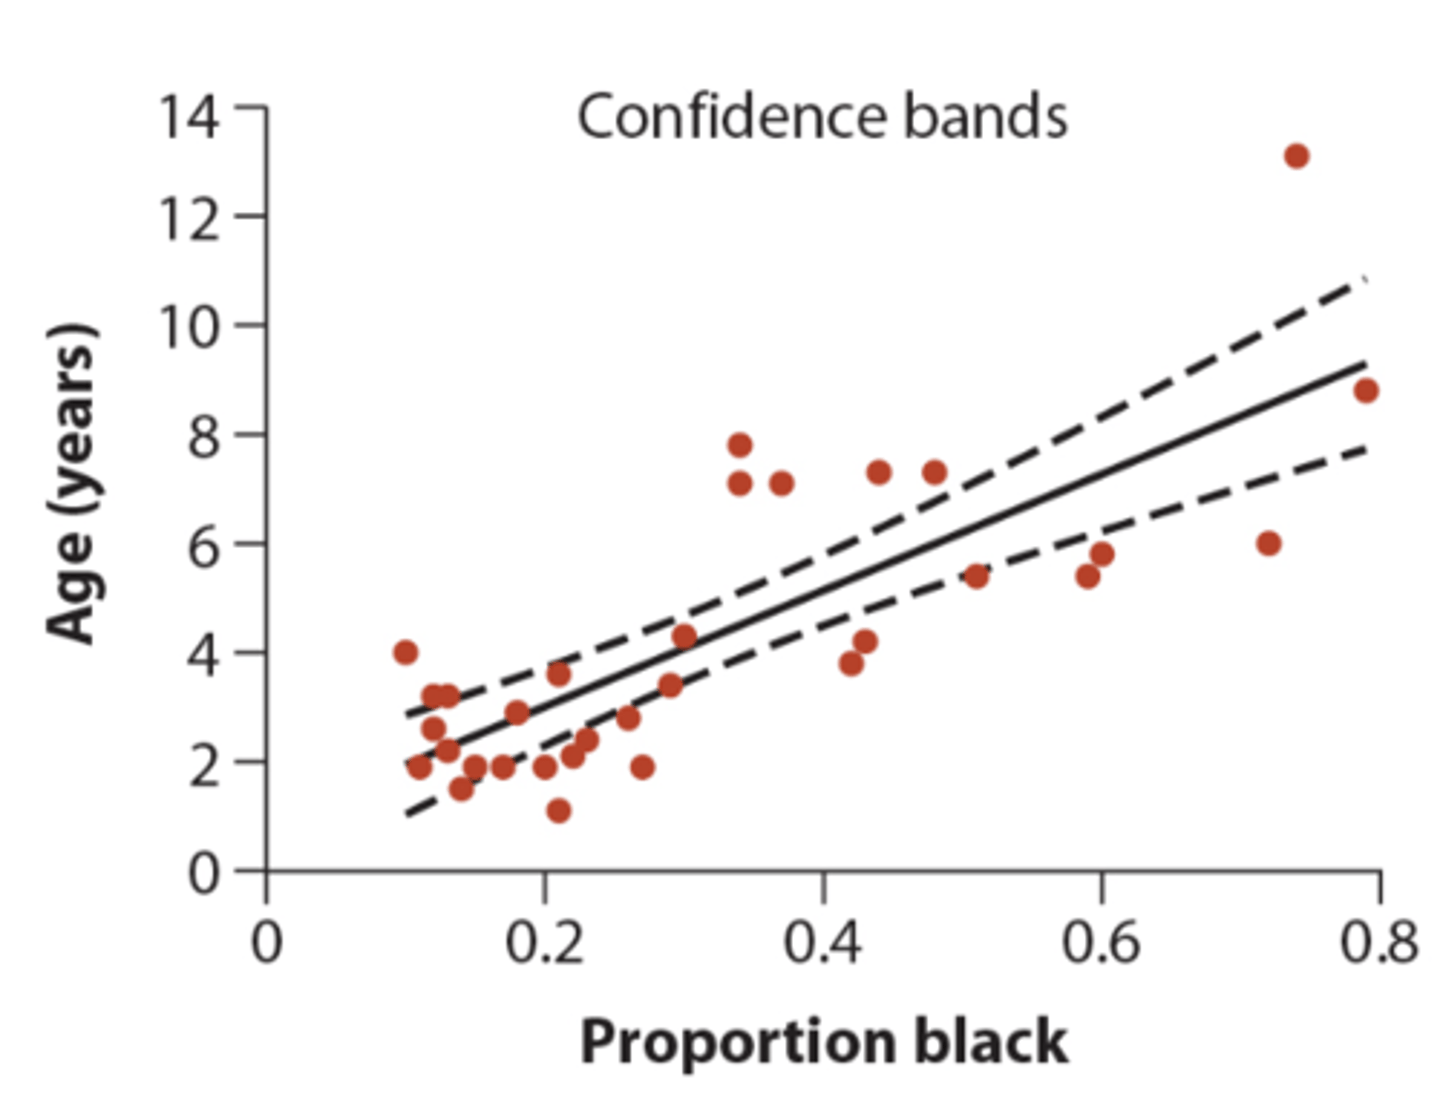
Confidence bands
measure the precision of the predicted mean Y for each given value of X
• curved because when sample size is smaller it gets wider
• width will be skinniest at the means of X-hat and Y-hat
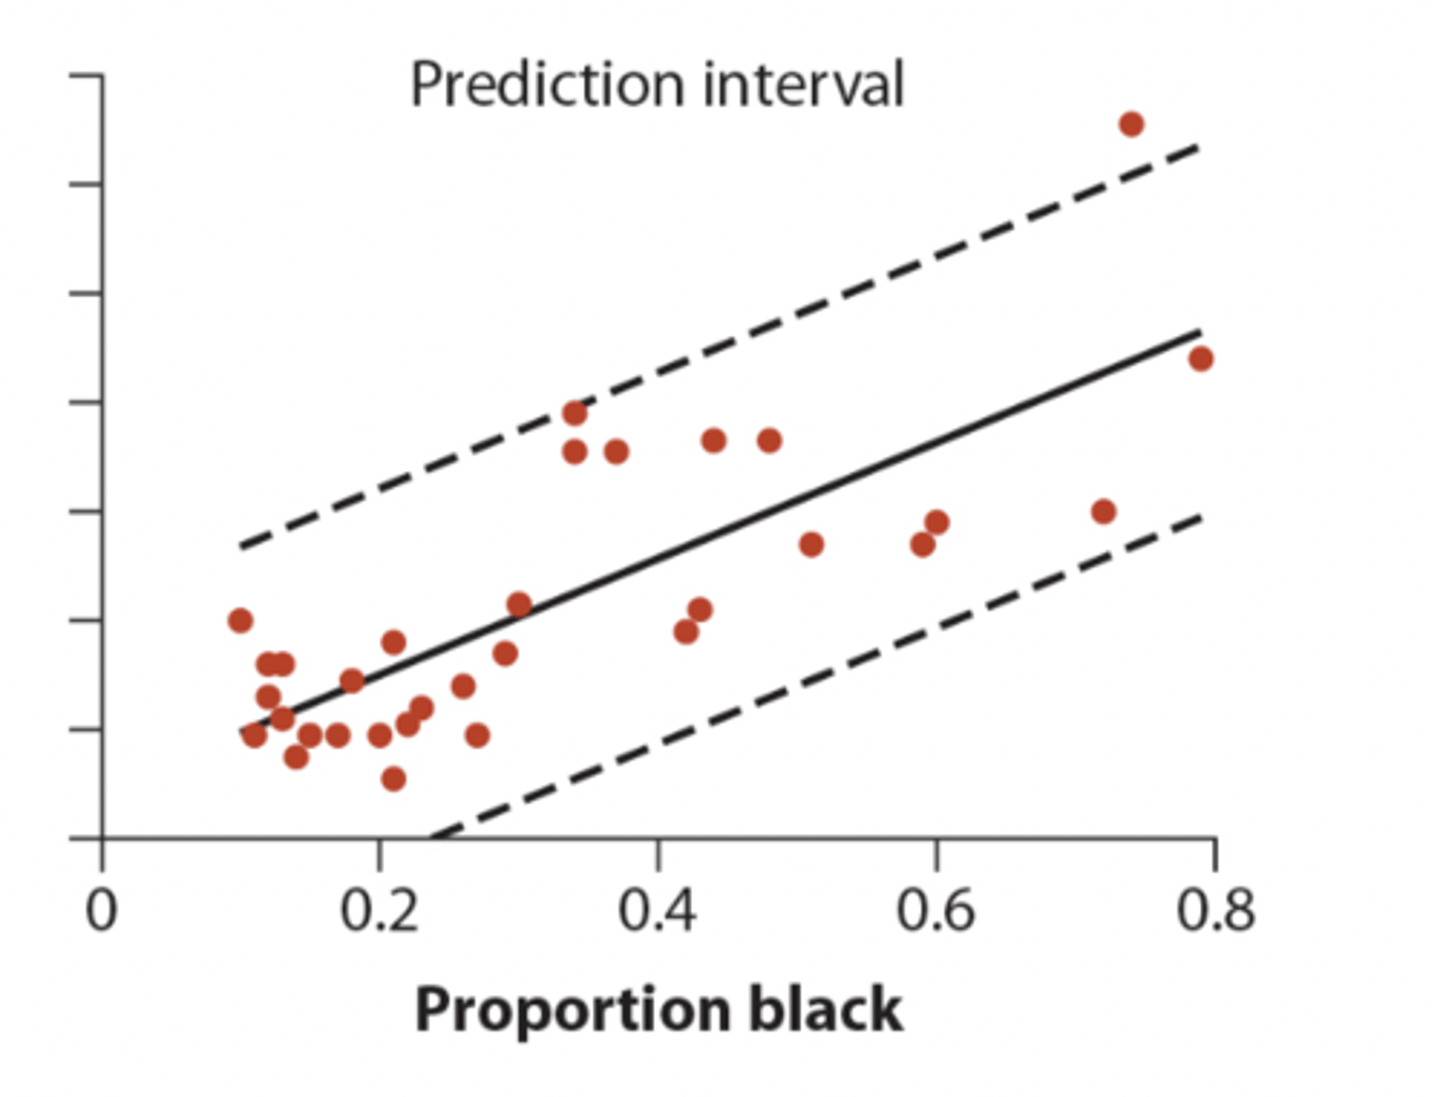
Prediction intervals
Measure the precision of the predicted single Y values for each X
• wider than confidence bands because predicting a single Y value is less precise than predicting a mean Y
Interpolation
Regression should be used to predict Y for any value of X lying between the smallest and largest values of X
Extrapolation
The prediction of the value of a response variable (Y) outside the range of X values in the data
• extended prediction Beyond where you sampled
• not recommended because there's no way to ensure the relationship continues to be linear beyond the range of the data
Hypotheses for testing a slope
H₀: β = 0
Ha: β ≠ 0
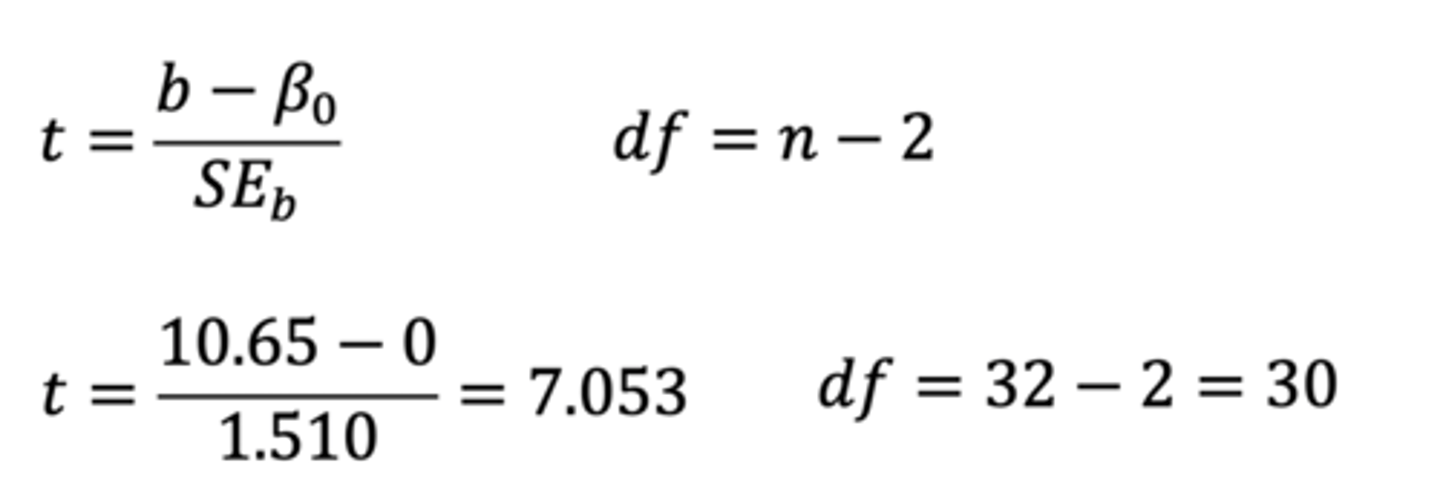
test statistic for regression slope
t-statistic → measures how well our data fit the expectation of our data
t-statistic equation for regression slope
• SEb = measures uncertainty
• β₀ = Null
• df = n-2
how to get a p-value from the test statistic
determine the critical value for the t-distribution and calculate p using a stats table or computer
ANOVA (F) approach
In regression framework:
• deviations between the predicted values of Yi-hat and Ybar
-analogous to MSgroups
• deviations between each Yi and it's predictive value Yi-hat (residuals)
- analogous to MSerror
• using ANOVA approach will generate the same p-value as the t-test approach
• can be used to measure R²: the fraction of the variation in Y that is "explained" by X
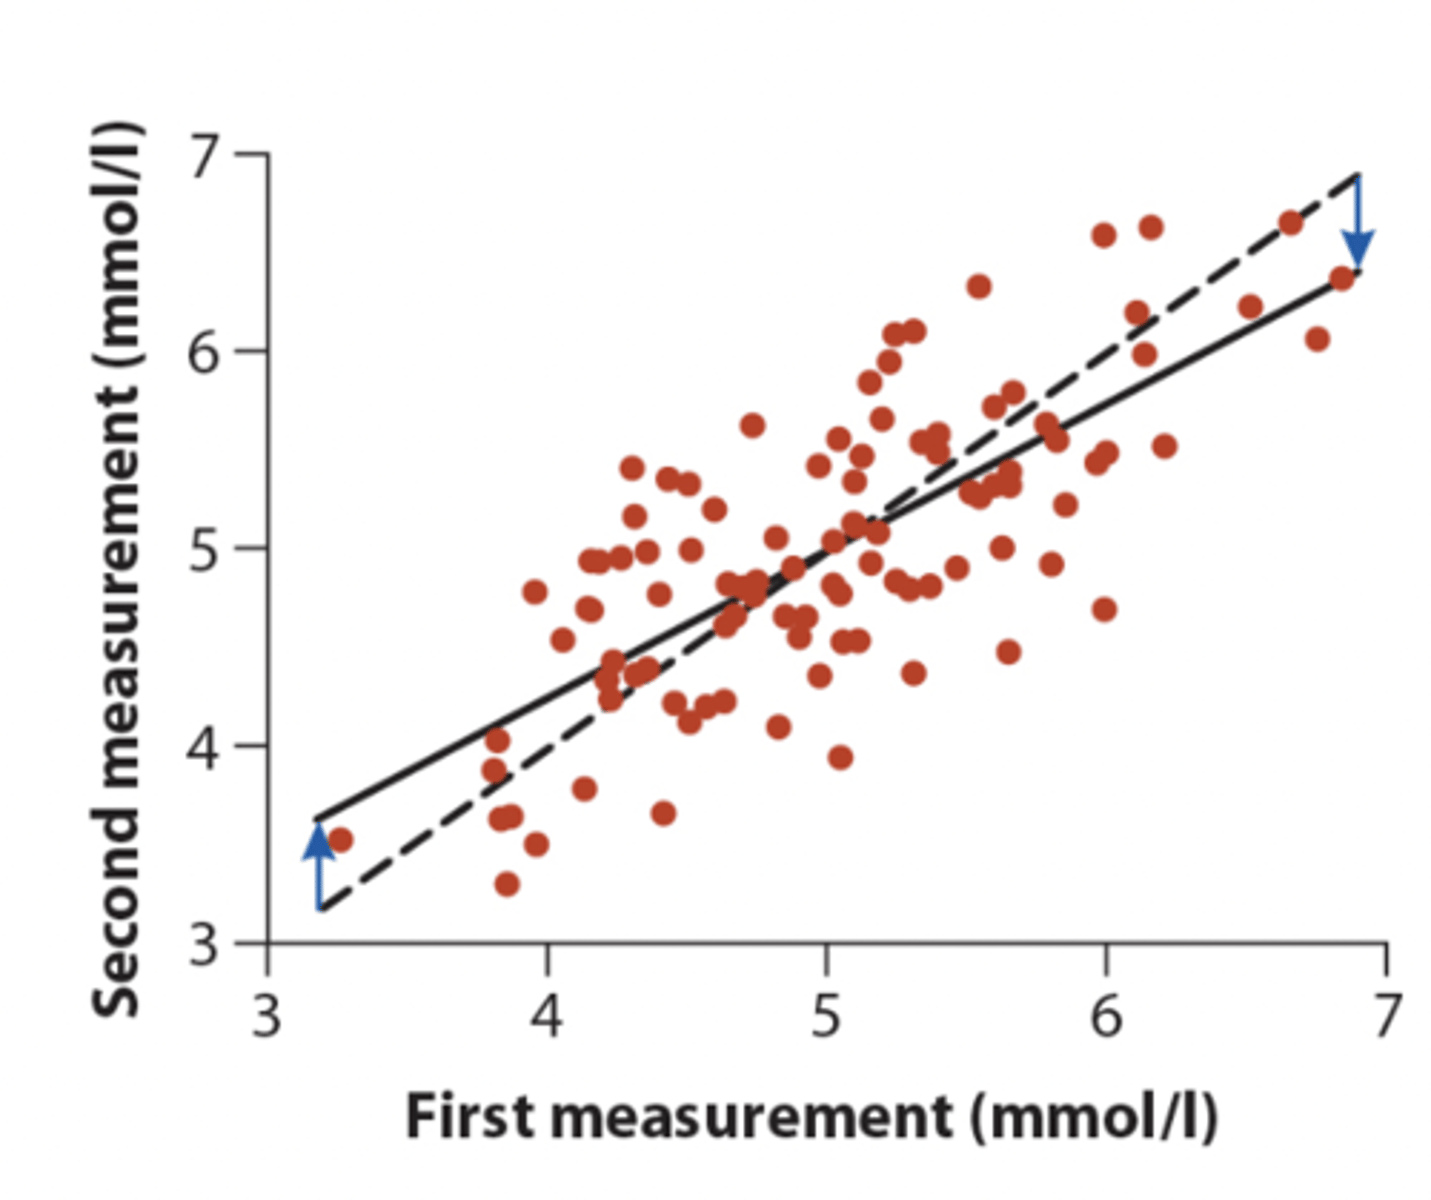
Regression toward the mean
Results when two variables measured on a sample of individuals have a correlation less than one. Individuals that are far from the mean for one of the measurements will, on average, like closer to the mean for the other measurement
• in pic: solid line = linear regression, dashed line = one-to-one line with slope of 1
• are people regressing to mean or is the drug working
Assumptions of linear regression
At each value of X:
• there is a population of Y-values whose mean lies on the regression line
• the distribution of possible Y-values is normal (with the same variance)
• The variance of Y-values is the same at all values of X
• the Y measurements represent a random sample from the possible Y-values
3 possible issues when trying to do a linear regression
1. outliers
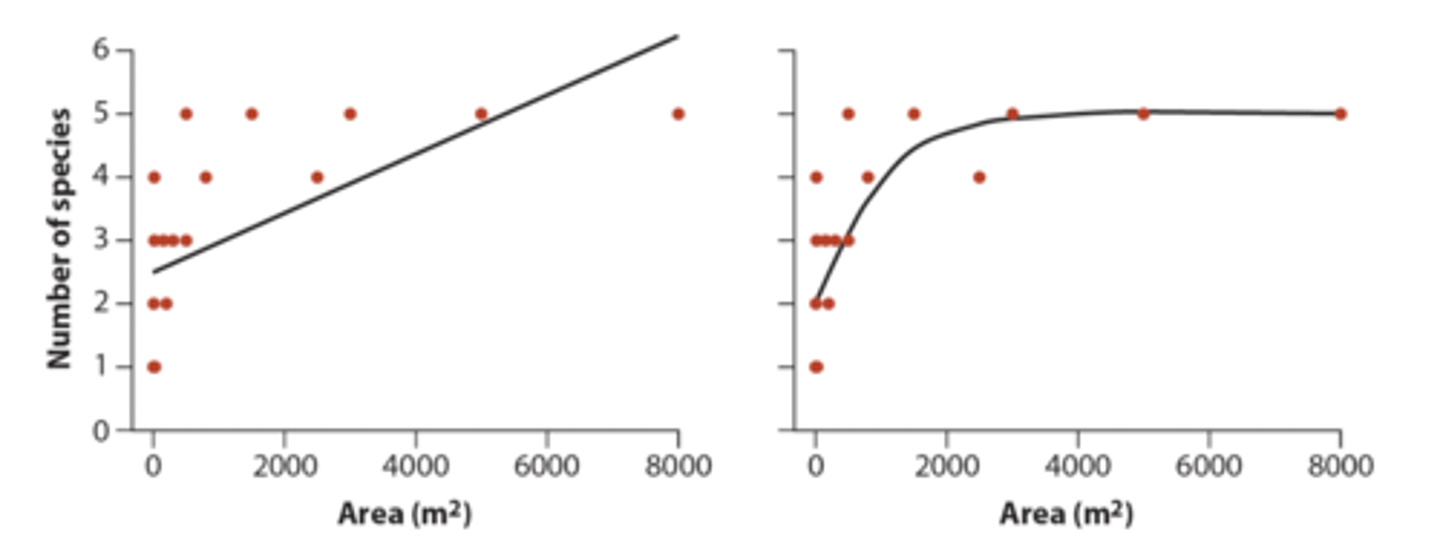
2. nonlinearity
3. non-normal and unequal variants
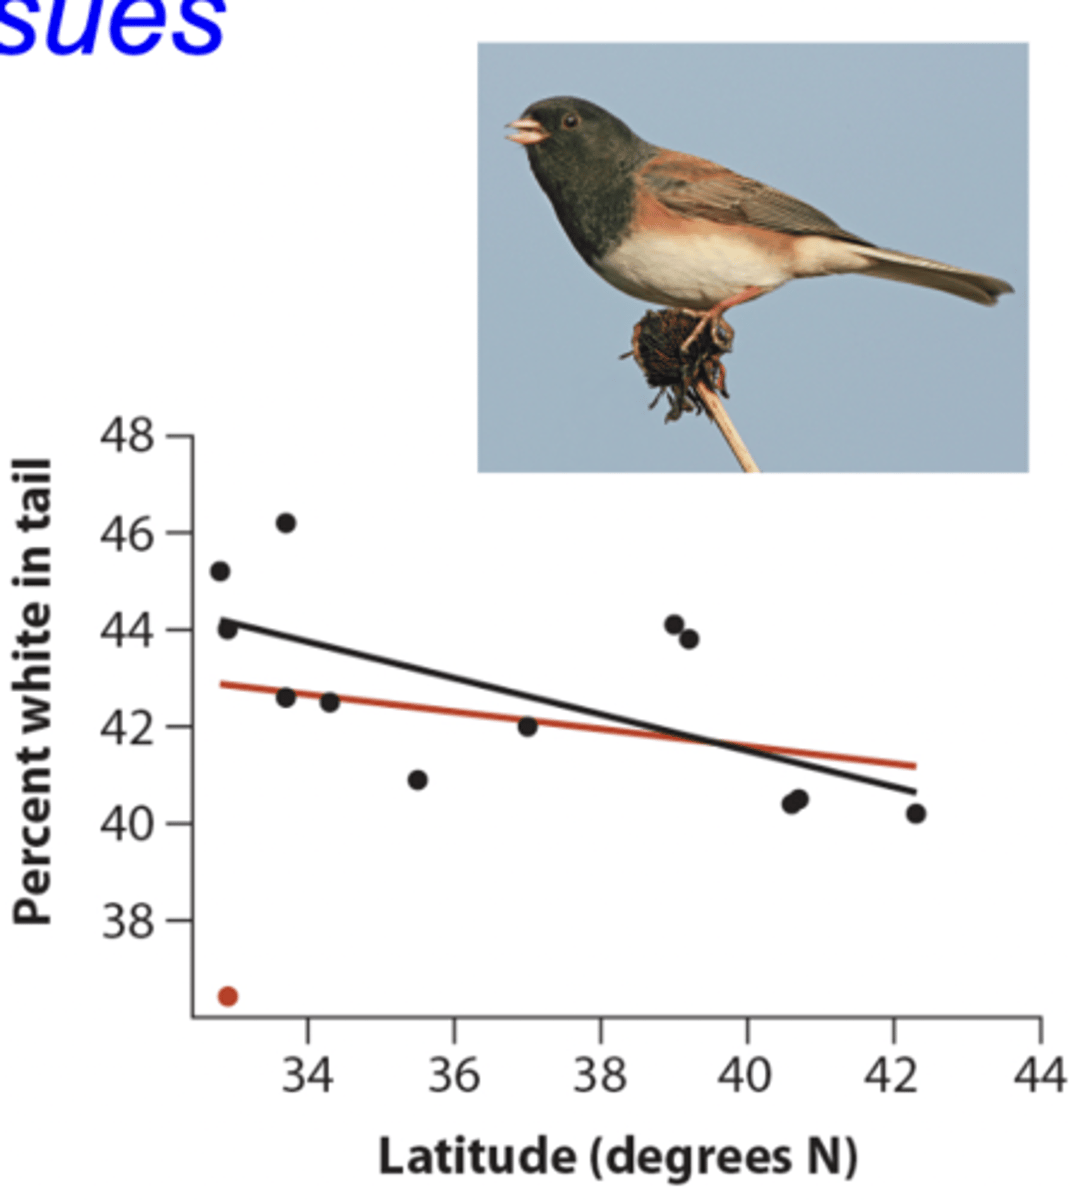
How to deal with outliers
If only one (or a low number) then it may be reasonable to report regression with and without outlier
How to detect nonlinearity
Can be detected by inspecting graphs
How to detect non-normality and unequal variances
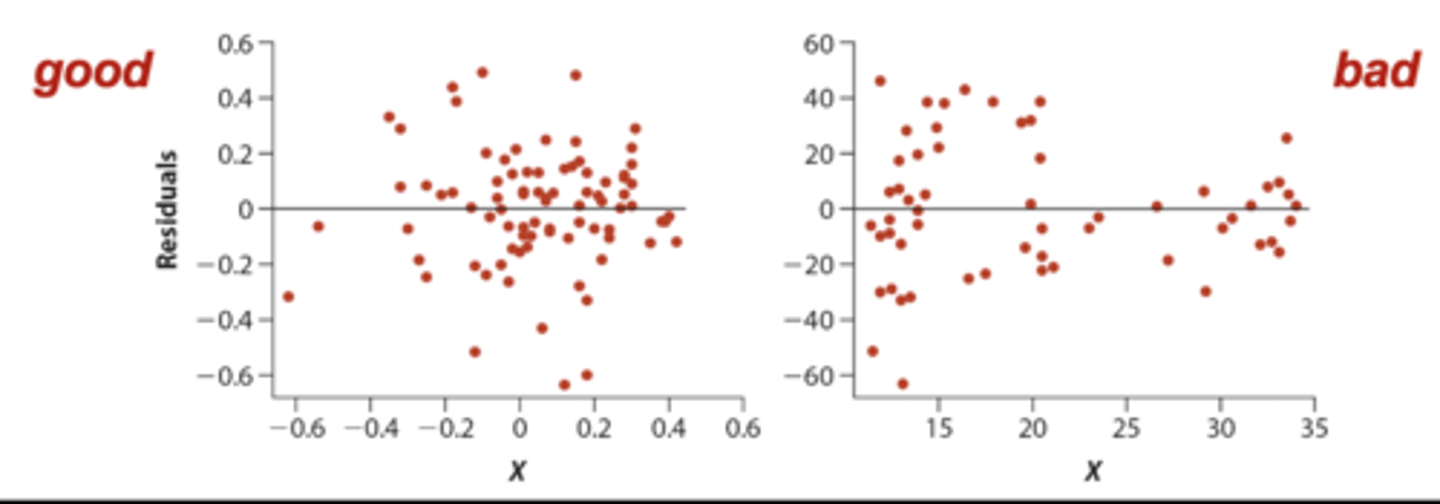
Residual plot
Residual plot
Residual of every data point (Yi - Yi-hat) is plotted against Xi
• if assumptions of normality and equal variances are met then there should be a roughly symmetric cloud above / below line at zero
- you don't want a funnel (violation of subpopulation distribution assumption)