maths stuff to know
1/76
There's no tags or description
Looks like no tags are added yet.
Name | Mastery | Learn | Test | Matching | Spaced |
|---|
No study sessions yet.
77 Terms
detail the proof of irrationality of root 2
1 - suppose √2 is rational and can be written as a fraction in its simplest form √2 = a/b
2 - let 2 = a2/b2, therefore 2b2 = a2
3 - this means that a2must be even, therefore a must be even
4 - therefore a2 = (2k)^2, so a2 = 4k^2, so 2b^2 = 4k^2, therefore b^2 = 2k^2, so b^2 must be even, so b must be even
4 - Therefore a and b both have a factor of 2, as this is true, m/n is not the fraction in its simplest form, therefore this is a contradiction and root 2 is irrational
proof by counter example there is a infinity of primes
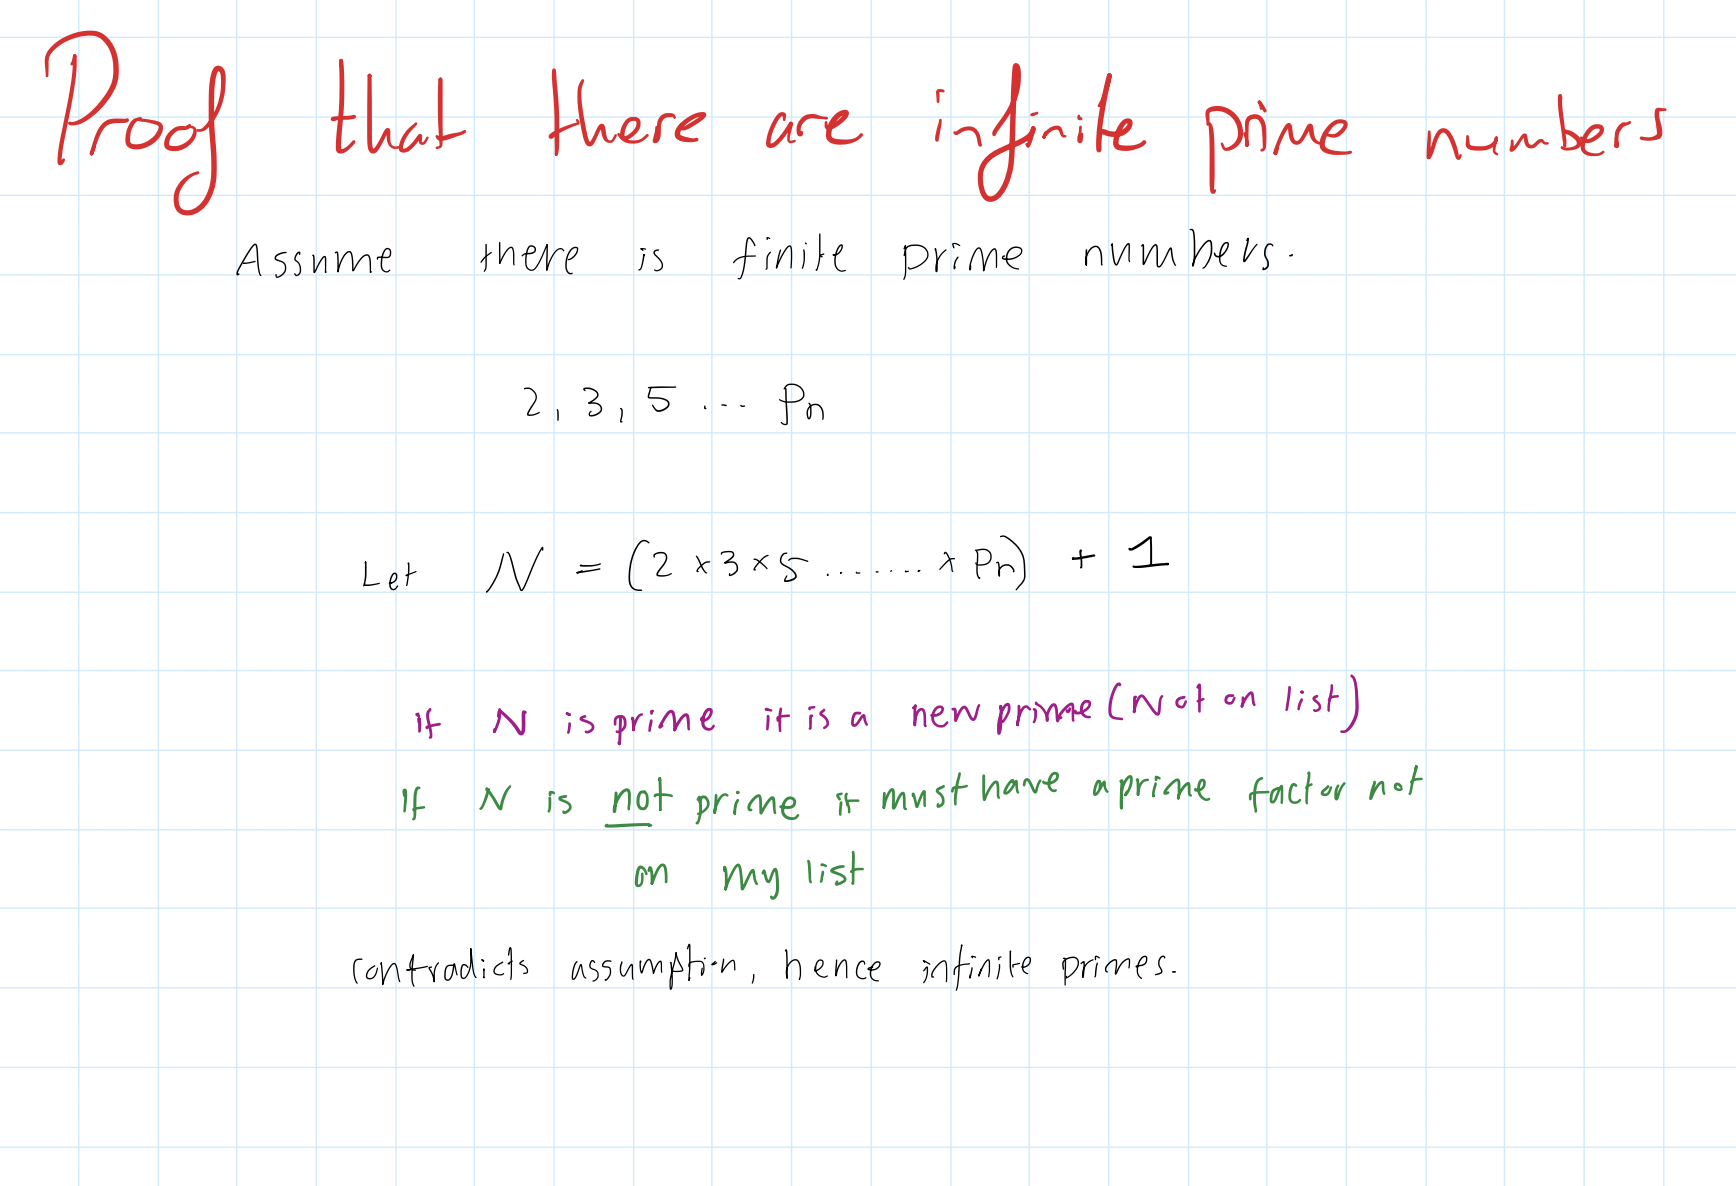
assume that there is a list of the finite primes;
p1xp2xp3xp4......pn
let P = p1xp2xp3xp4....pn +1 this way P is a prime and not a factor of any of the previous primes.
P is either a prime number or not a prime number
If P is prime, then P is not on the list and we have found a new prime
If P is not prime then P must be a factor of 1 (as it is not a factor of any other primes) this means that P must be less that one, this is impossible as P must be greater than 1
therefore we have found a contradiction
therefore there are infinitely many primes
why might a rod that rotates about a bearing not be in equilibrium despite the sum of the forces along the block = 0
if the moments are taken around A then the forces acting at A would have been discounted as the distance in motion is 0
what is meant by the term interpolation and extrapolation?
interpolation - is using the trends of the data to create an estimate for a value in a scatter graph where data is present to support the conclusion
extrapolation - is extending the trend in the data to draw conclusion even though there is no data to support he claim, therefore extrapolation is less reliable since correlation doesn't imply causation
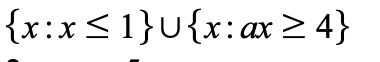
how to rewrite this using set notation: x<1 or x>4
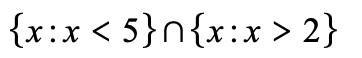
how to rewrite this using set notation: x<5 and x>2
how to find the domain of gf given the domain of f and g
Identify the domain of f:
Determine the set of all possible input values (x) for which the function
fis defined.2. Identify the domain of g:
Determine the set of all possible input values for which the function
gis defined.3. Find the domain of gf:
For each value of
xin the domain off, check iff(x)is also in the domain ofg. If it is, thenxis in the domain ofgf. Iff(x)is not in the domain ofg, thenxis not in the domain ofgf.
what is the inverse function
a reflection in the line y =.x
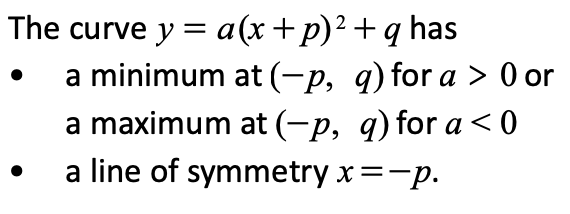
how to complete the square to find the line of symmetry and turning point
describe th 3 types of transformations
translation
stretch
reflection
the transformation y = af(x)
stretch of y = f(x) with scale factor a parallel to the y-axis.
The transformation y = –af(x)
a vertical stretch of y = f(x) with scale factor a parallel to the y-axis and
then a reflection in the x-axis.
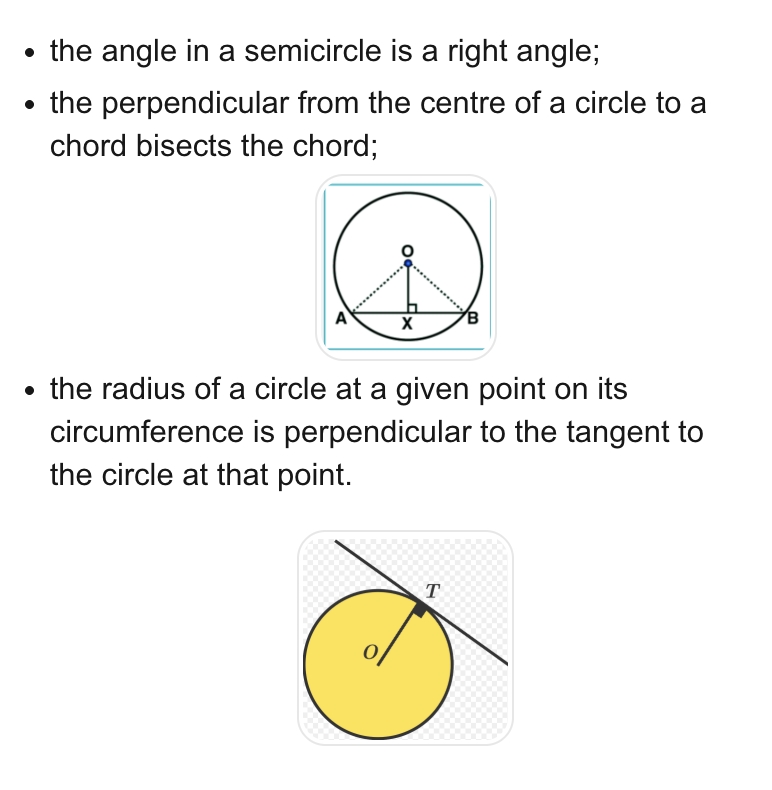
describe the 3 circle theorems u need to know
the angle in a semicircle is a right angle;
the perpendicular from the centre of a circle to a chord bisects the chord;
the radius of a circle at a given point on its circumference is perpendicular to the tangent to the circle at that point.
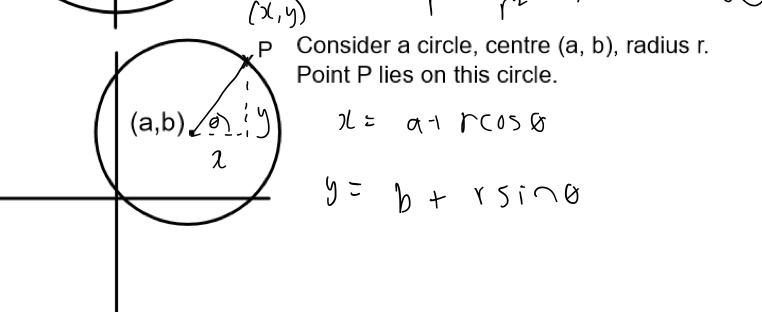
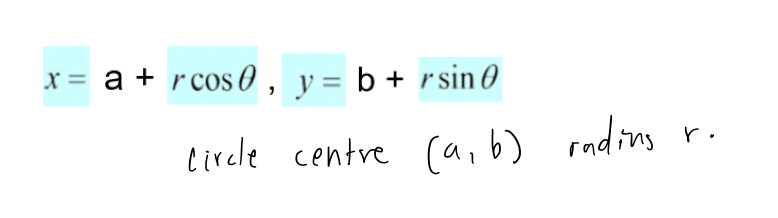
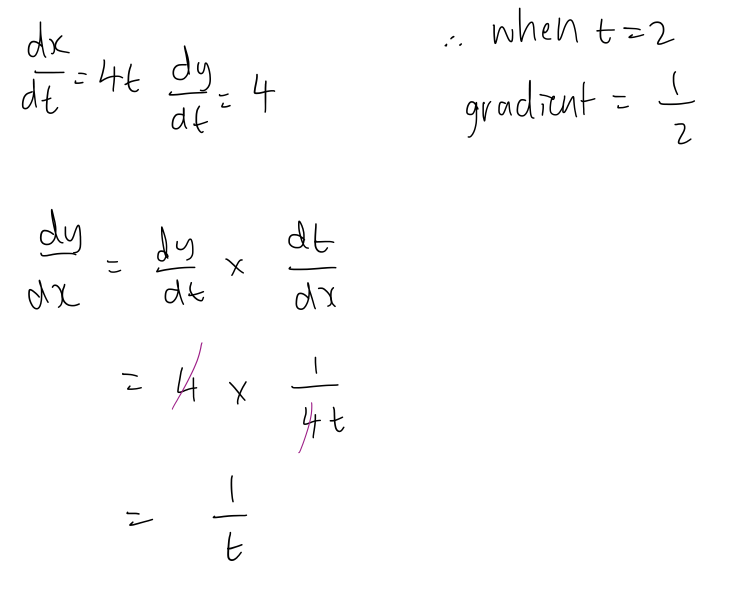
how to find coordinates of a circle to form parametric equations

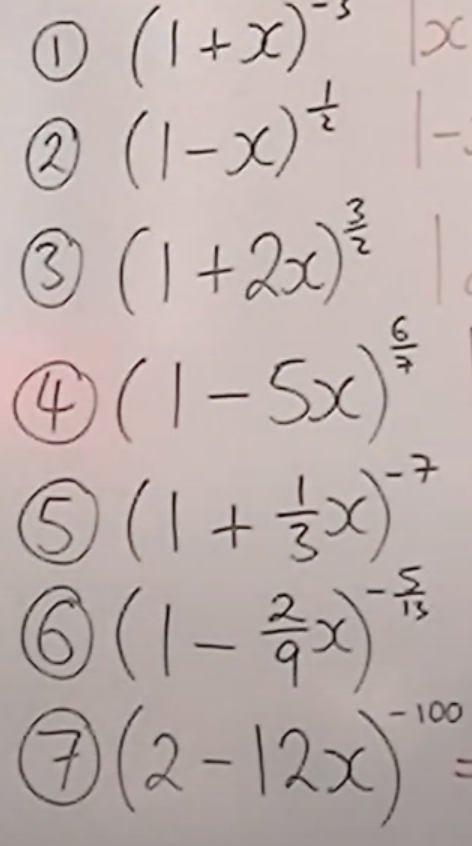
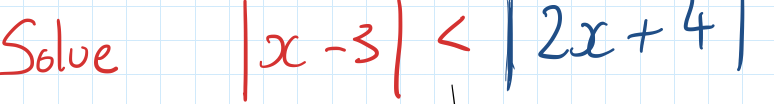
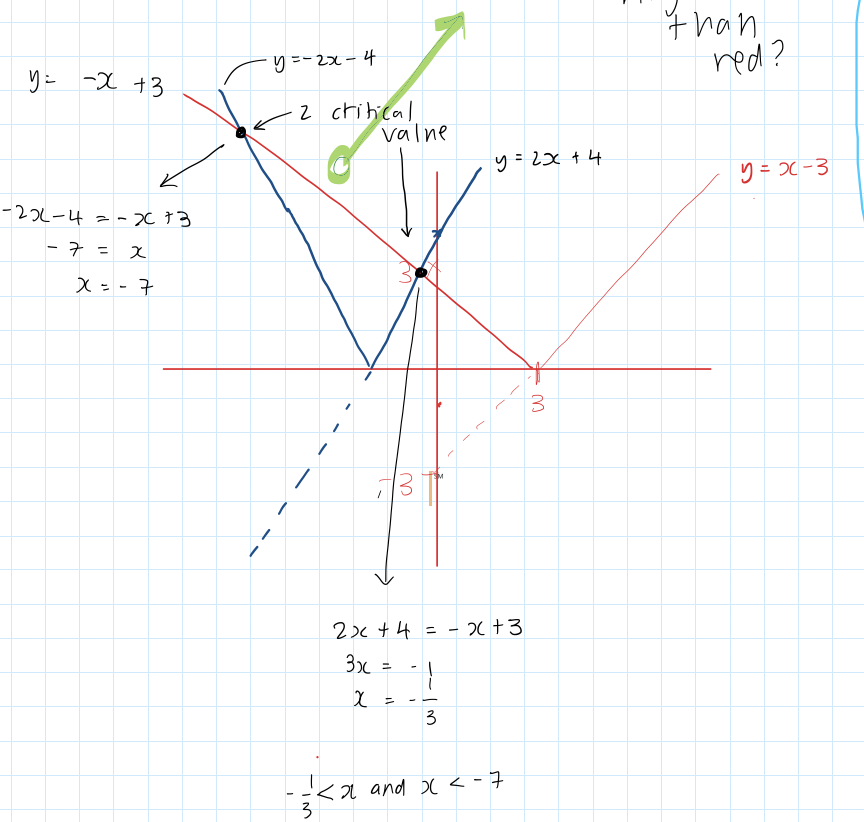
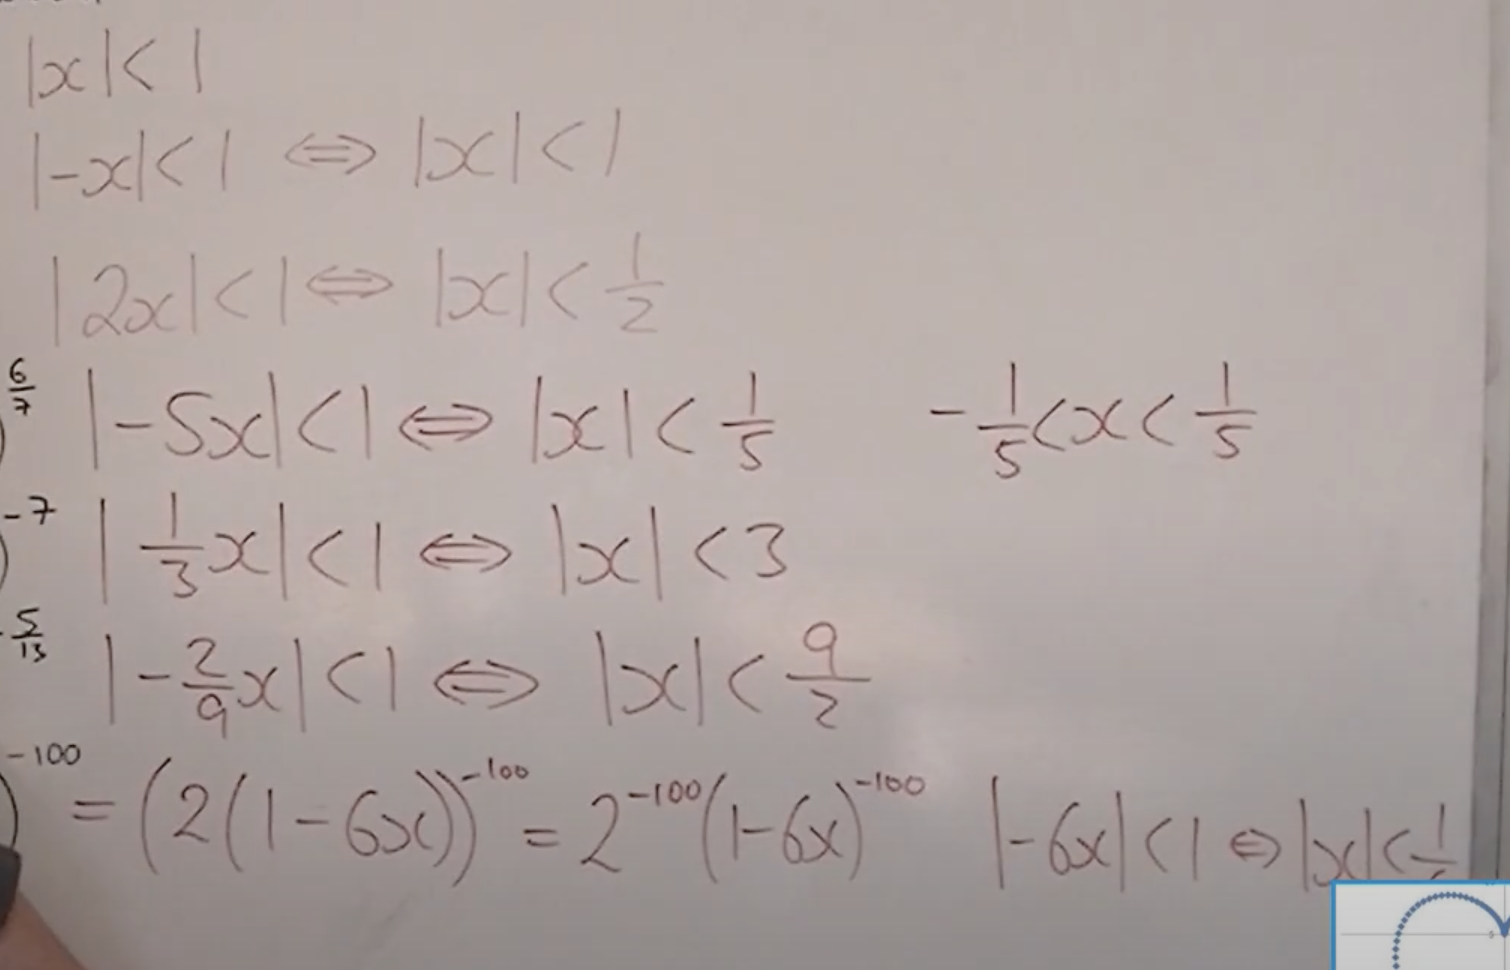
find the range of values x can be
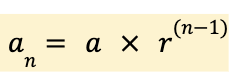
To find the nth term of a arithmetic sequence
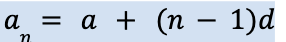
To find the nth term of a arithmetic sequence
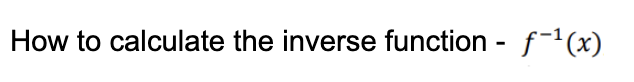
Set the function to equal y
Rearrange so that y is the subject
Interchange x and y variables
Transformations
BIDMAS for y transformations
Reverse BIDMAS for x transformations

Reciprocal trigonometric functions: draw their graphs

nverse trigonometric functions - draw the graph

condition for a geometric sequence to b convergent and to find its sum to infinity
| r | <1
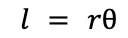
Arc length l of sector of a circle
r is the radius, theta is the angle in the sector
Area of circle using radians

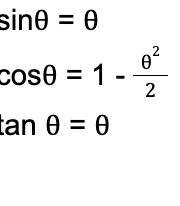
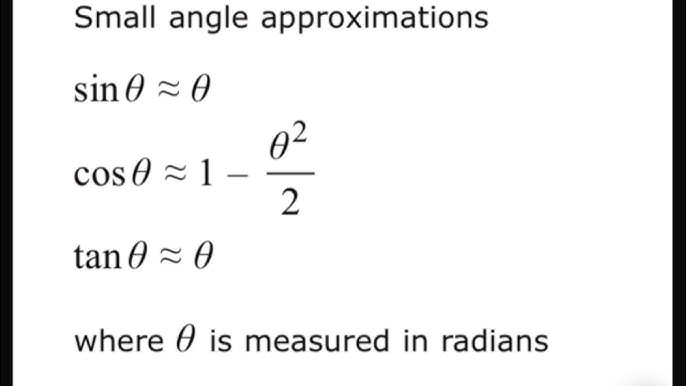
small angle approx
When -0.1 < x < 0.1
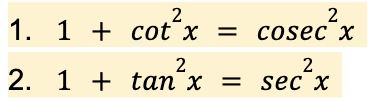
From the equation sin2x + cos2x = 1 what equations can be formed
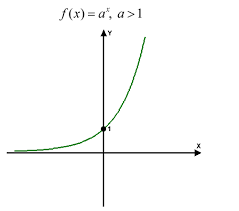
draw y = a x
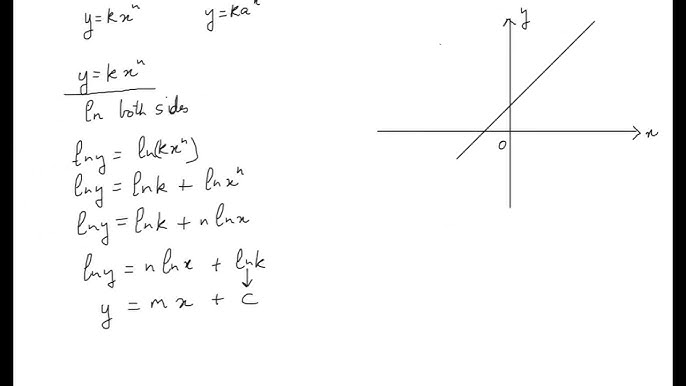
model the graph y = kx^n
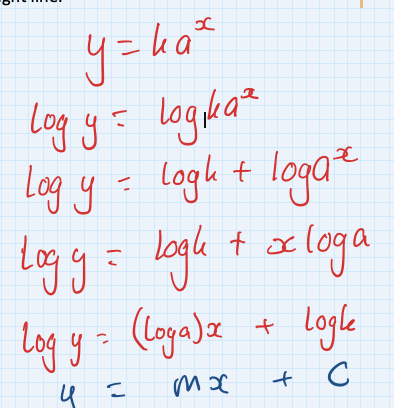
model the graph y=kax
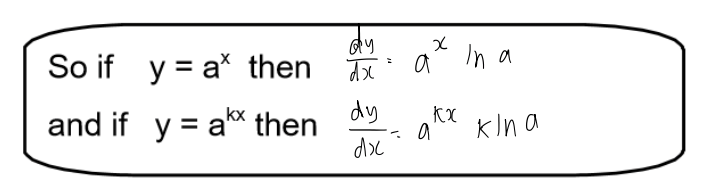
how to differentiate a^kx
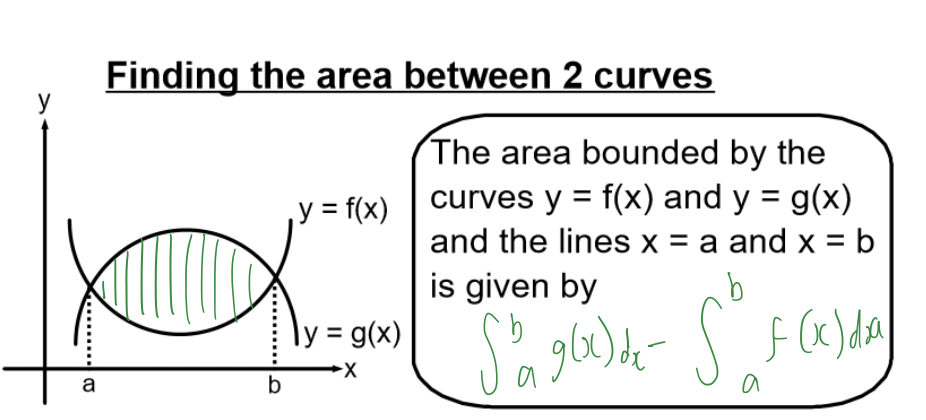
use integration to find the area between two curves
when might a change of sign fail
e.g. when the curve of y = f(x) touches the x-axis.
e.g. when the curve of y = f(x) has a vertical asymptote.
e.g. there may be several roots in the interval.
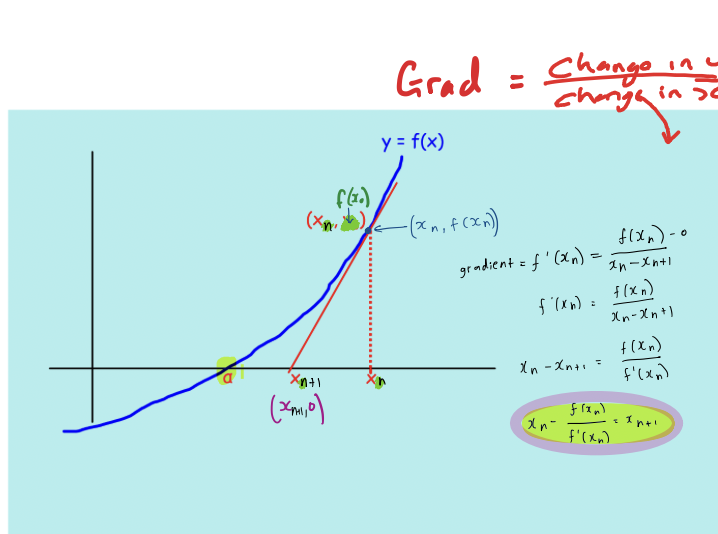
how to carry out the netwon raphson method
when is the trapezium rule a under/over estimate
The trapezium rule will overestimate the area under a curve when the curve is concave up (convex), and it will underestimate the area when the curve is concave down (concave).
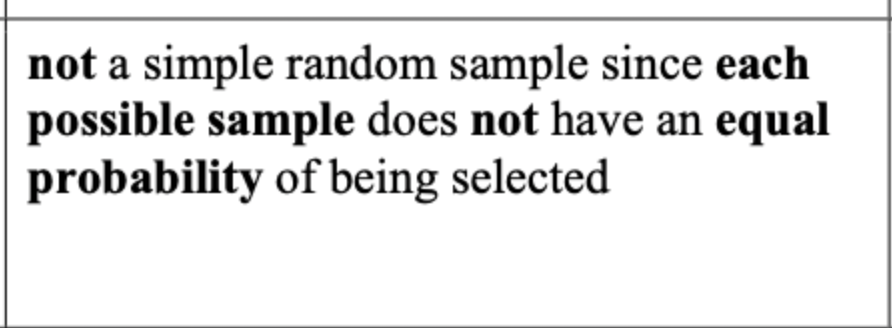
what is the definition for simple random sampling
every sample has the same probability of being selected
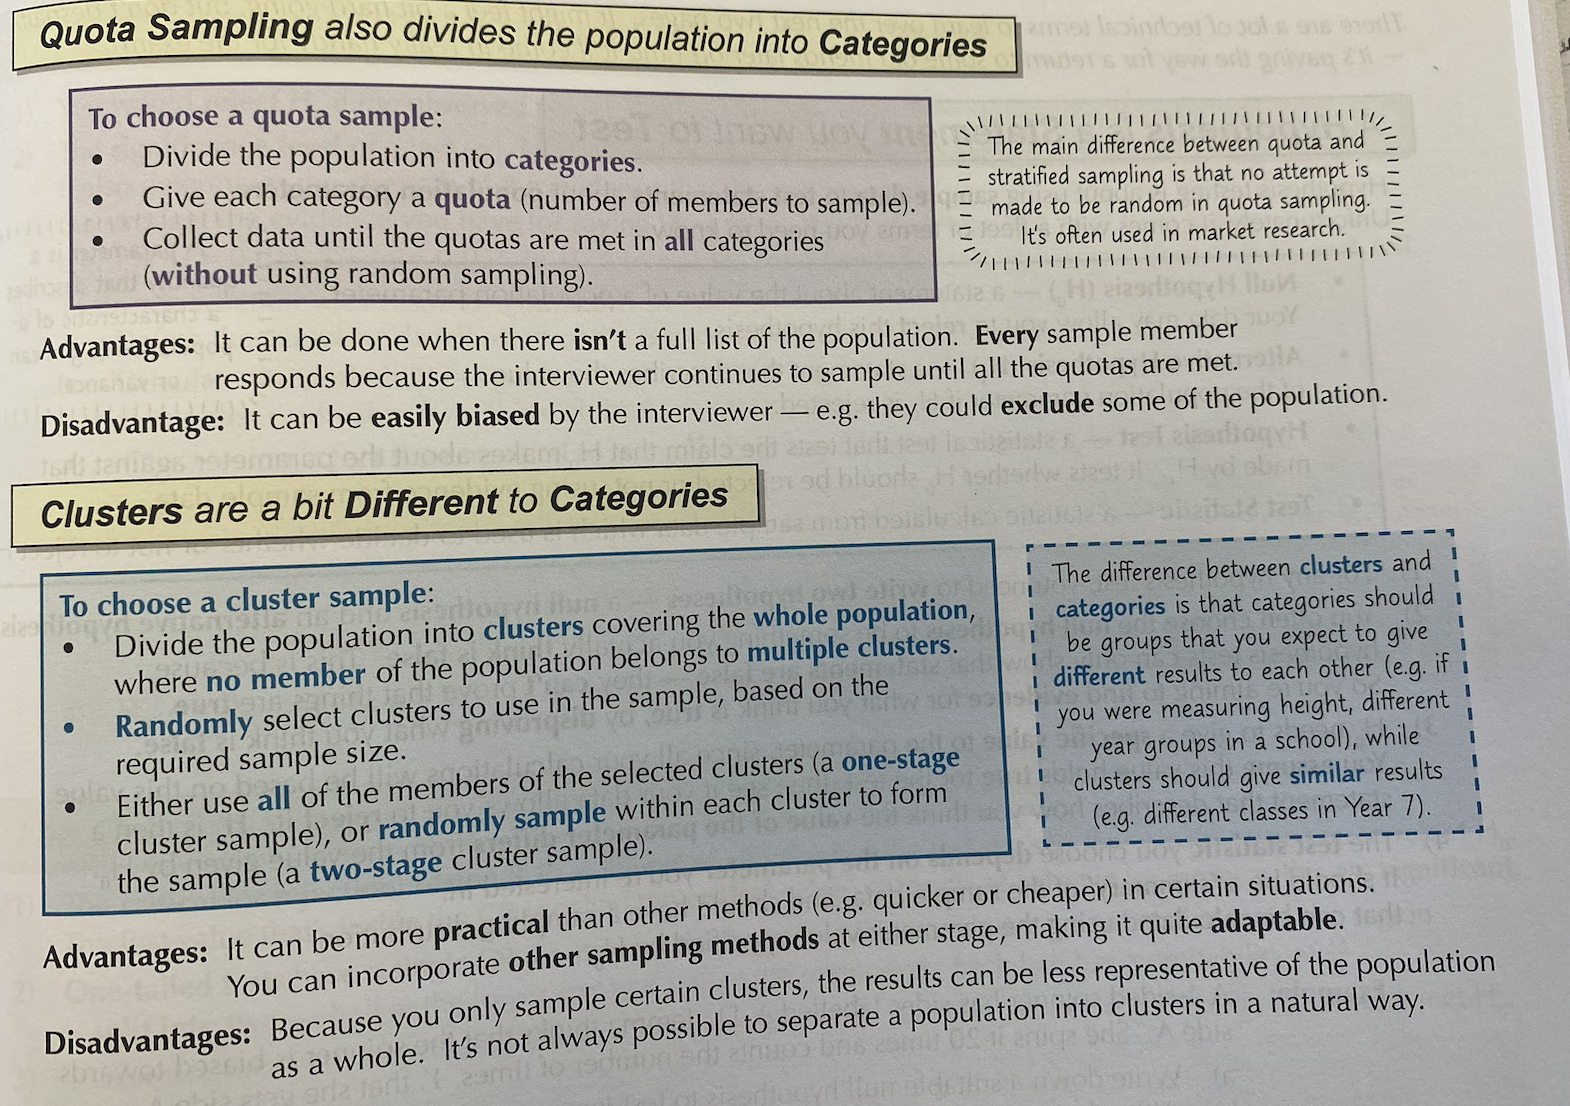
quota sampling
divide a population into subgroups (quotas) and then select participants from each subgroup to ensure representation based on specific characteristics like age, gender, or income.
cluster sampling
researchers divide a population into smaller groups known as clusters. They then randomly select among these clusters to form a sample
self selected samples
a non-probability sampling technique where participants choose to participate in a research study
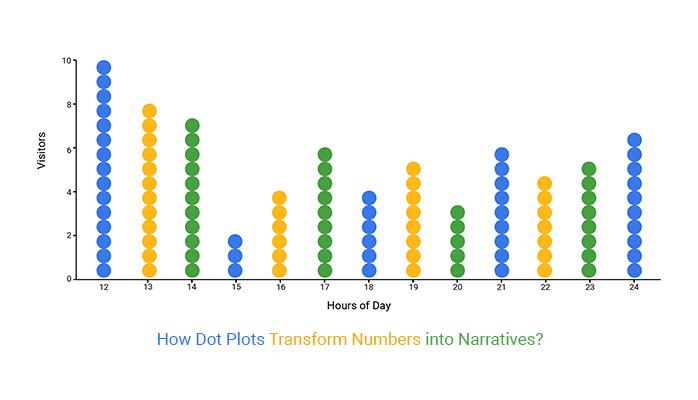
dot plot,
A dot plot is similar to a bar chart but with stacks of dots in lines to represent frequency.
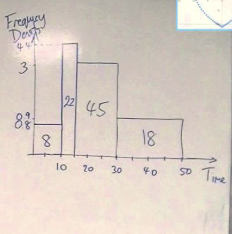
histogram,
the area of each bar in a histogram is proportional to frequency.
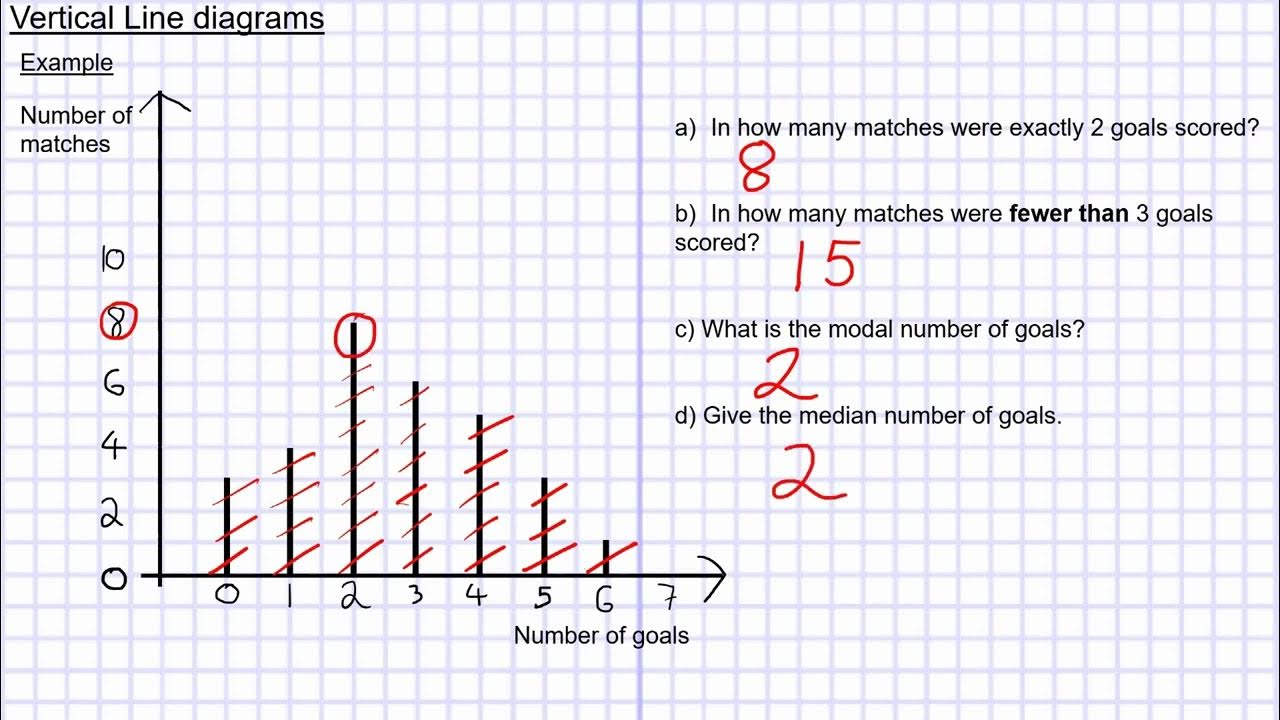
vertical line chart,
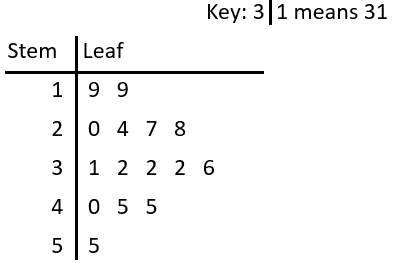
stem-and-leaf diagram,
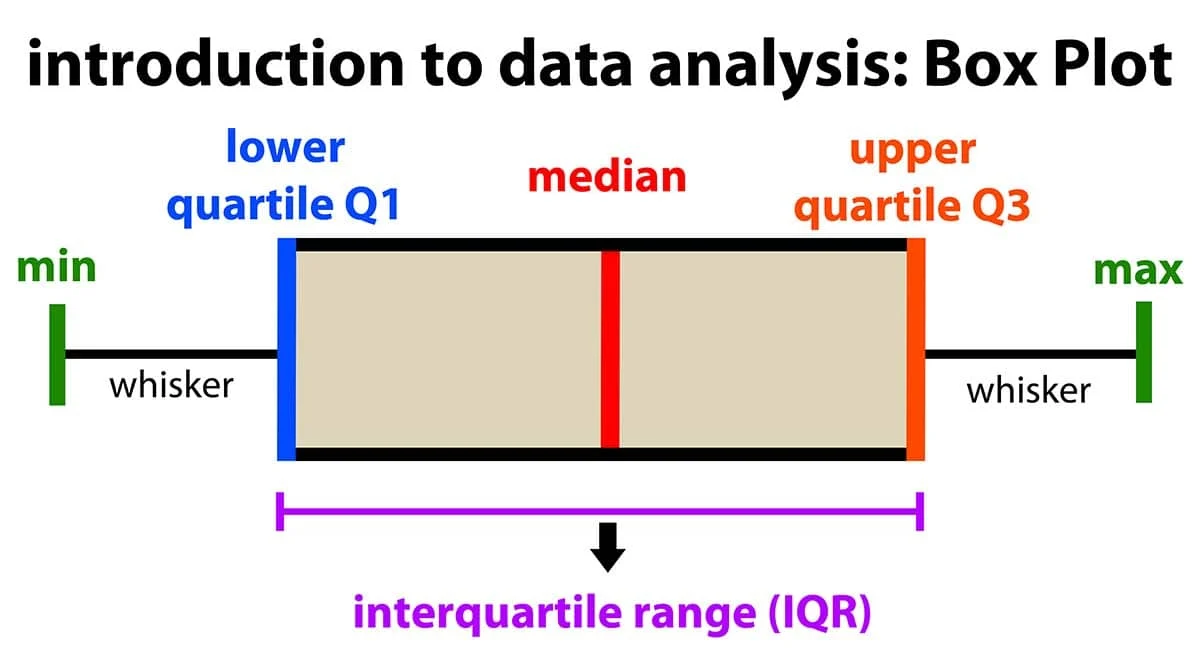
box-and-whisker diagram (box plot),
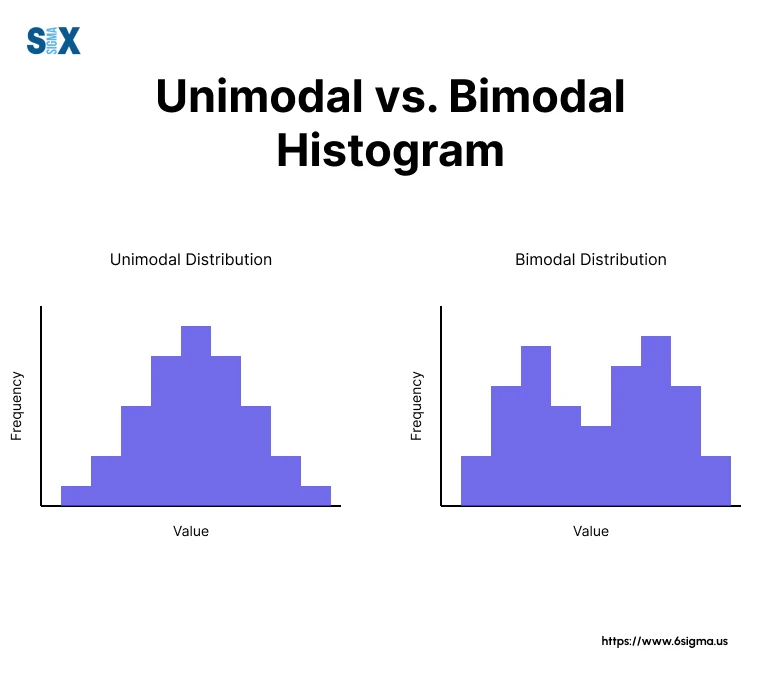
uni vs bi modal
what is bivariate data
2 variabels for each member of the population
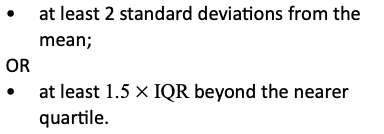
how to calculate and outlier
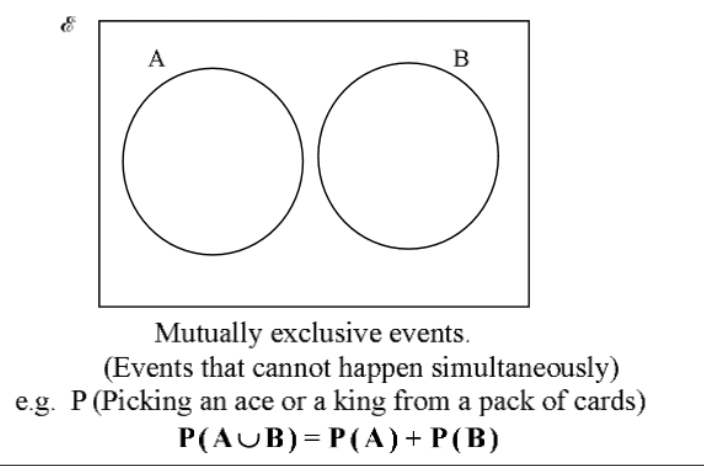
how are events mutually exclusive
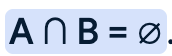

how to calculate independent events
events are independent if:
P(A) x P(B) = intersection of A and B
what is the definition for:
discrete
random
variable
discrete - only take particular values
random - cannot determine outcome for any trail
variable - can take different numerical values
situations that give rise to a binomial distribution
An experiment or trial is conducted a fixed number of times.
There are exactly 2 outcomes, which can be thought of as “success” or “failure”.
The probability of “success” is the same each time.
The probability of “success” on any trial is independent of what has happened in previous trials.
The random variable of interest is “the number of successes”.
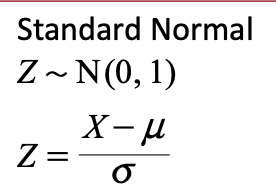
things to know about the normal curve
line of symmetry is at the mean
points of inflection are 1 sd from the mean
how to find the cartesian equation
add the 2 equations
square them
Standard modelling assumptions for
projectile motion are-
No air resistance.
The projectile is a particle.
Horizontal distance travelled is small enough to assume that gravity is always in the same direction.
Vertical distance travelled is small enough to assume that gravity is constant.
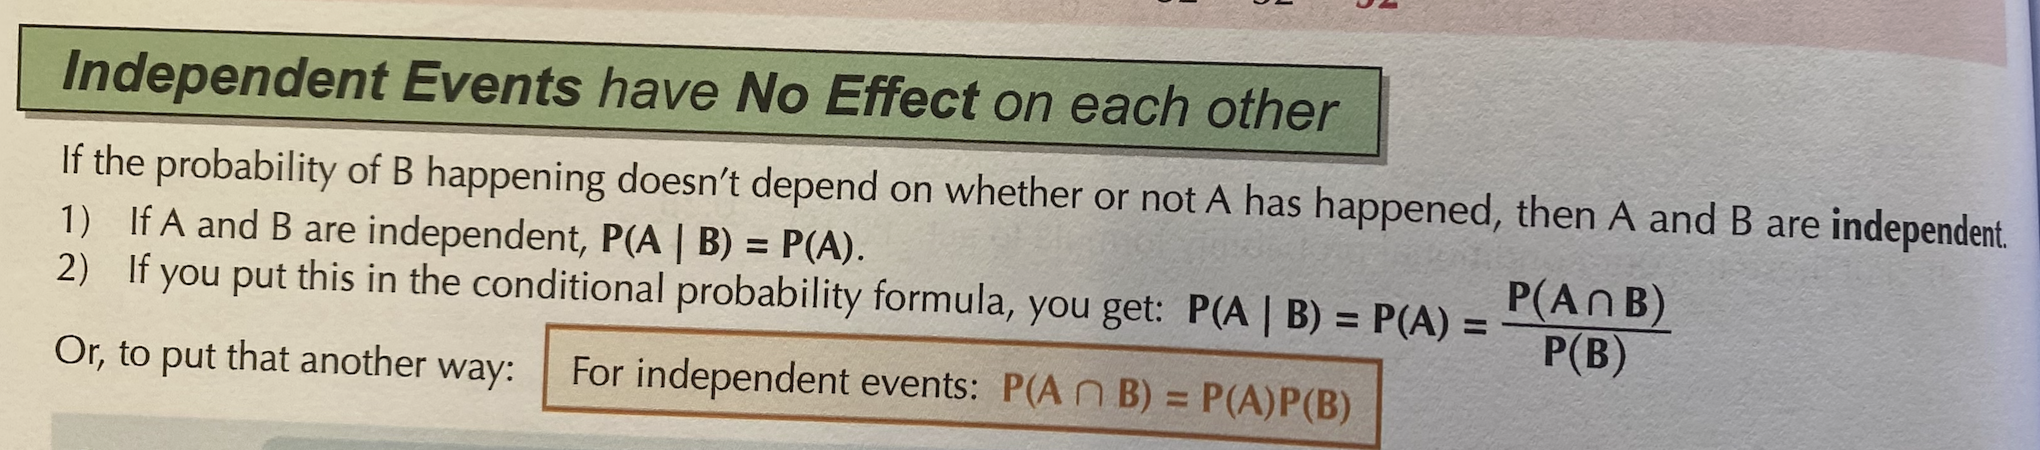
how to tell if a object is in thrust or compression
To determine if an object is in thrust (compression) or tension, examine the direction of the forces acting on it. If the forces are directed towards the object, it is in compression (thrust); if they are directed away from the object, it is in tension.
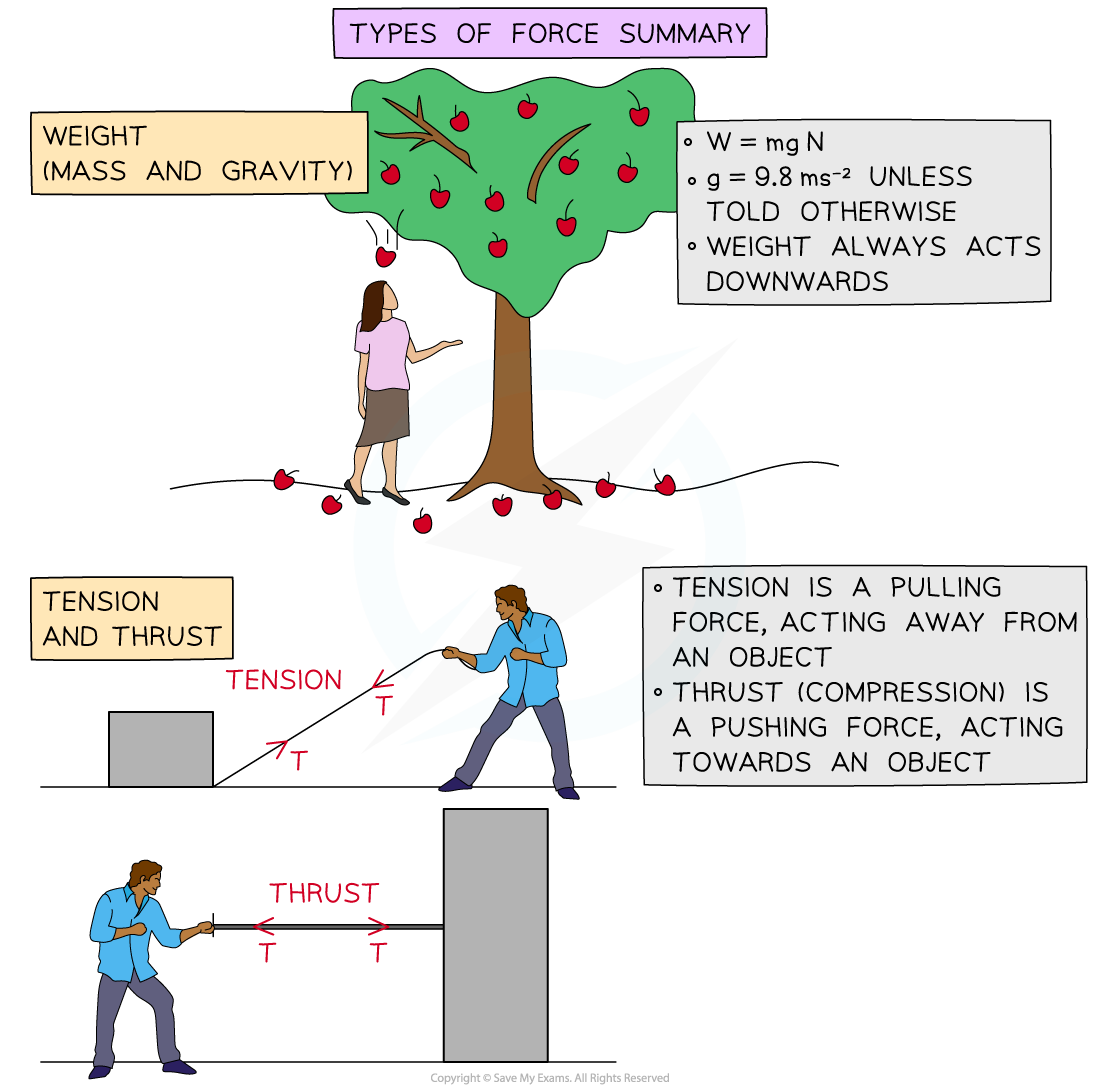
what are newtons 3 laws
how to use frequency tables
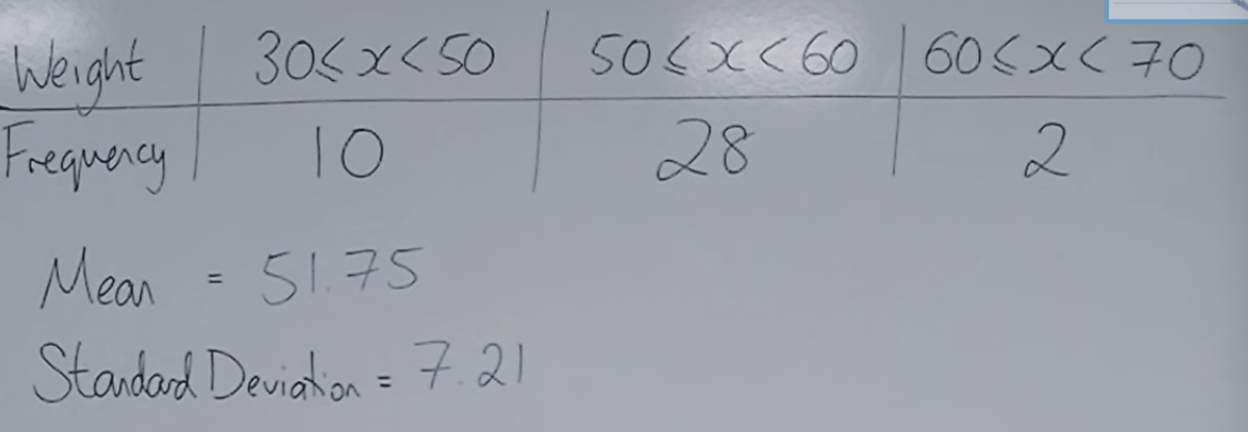
use the midpoints for modal classes
use the end values for cumulative frequency
detail the standardised normal
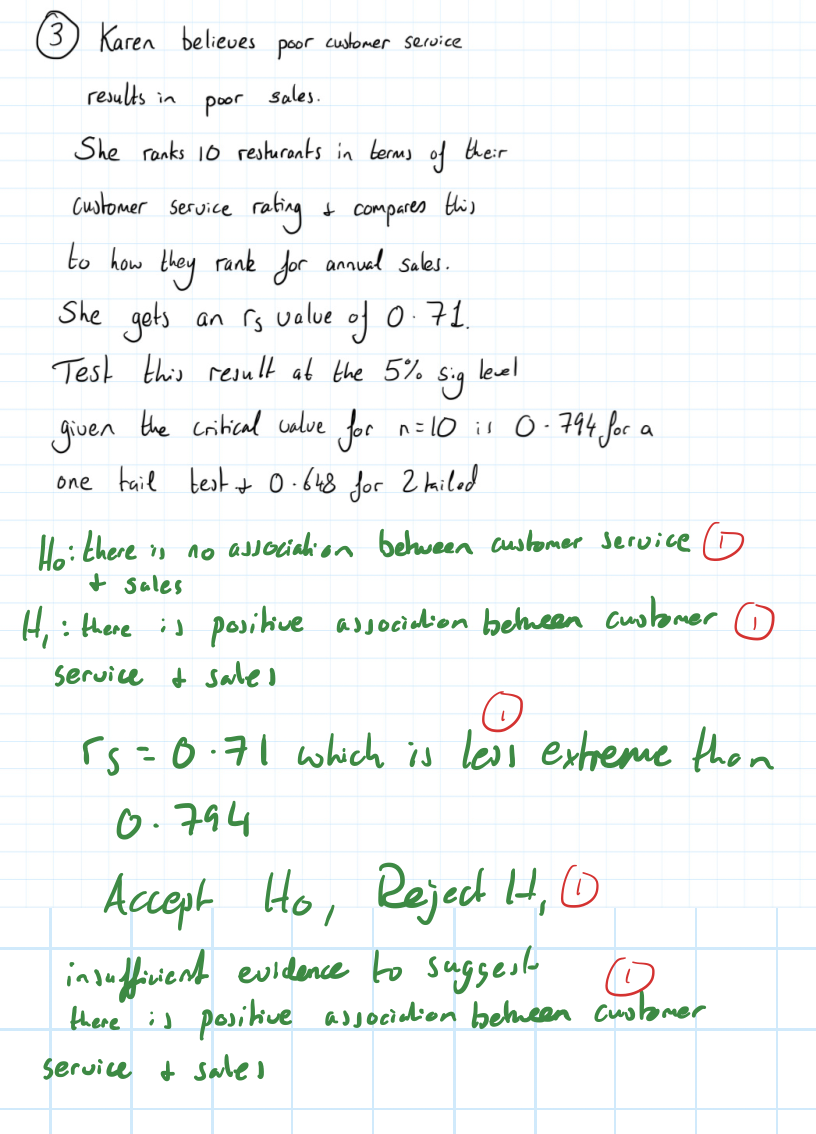
conduct a Spearman’s Rank "Correlation" Coefficient hypothesis test
what sig fig to give answers in
3sf
small angle approx
why can’t a graph get exponentially large
data shouldn’t be extrapolated
not enough people fro growth to continue
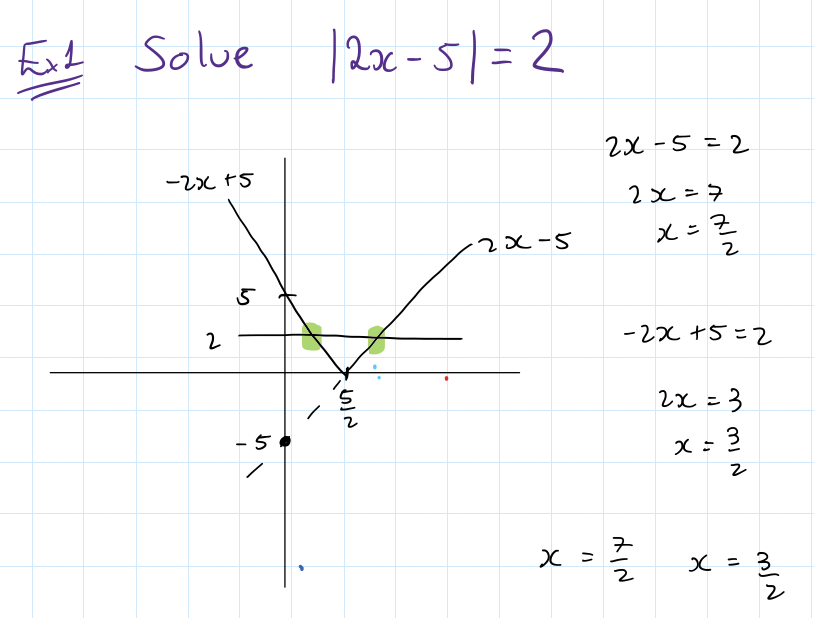
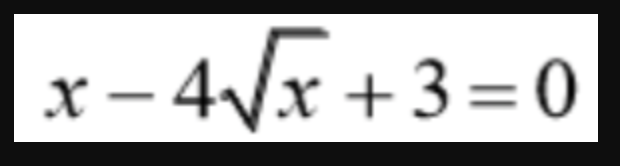
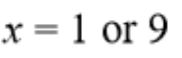
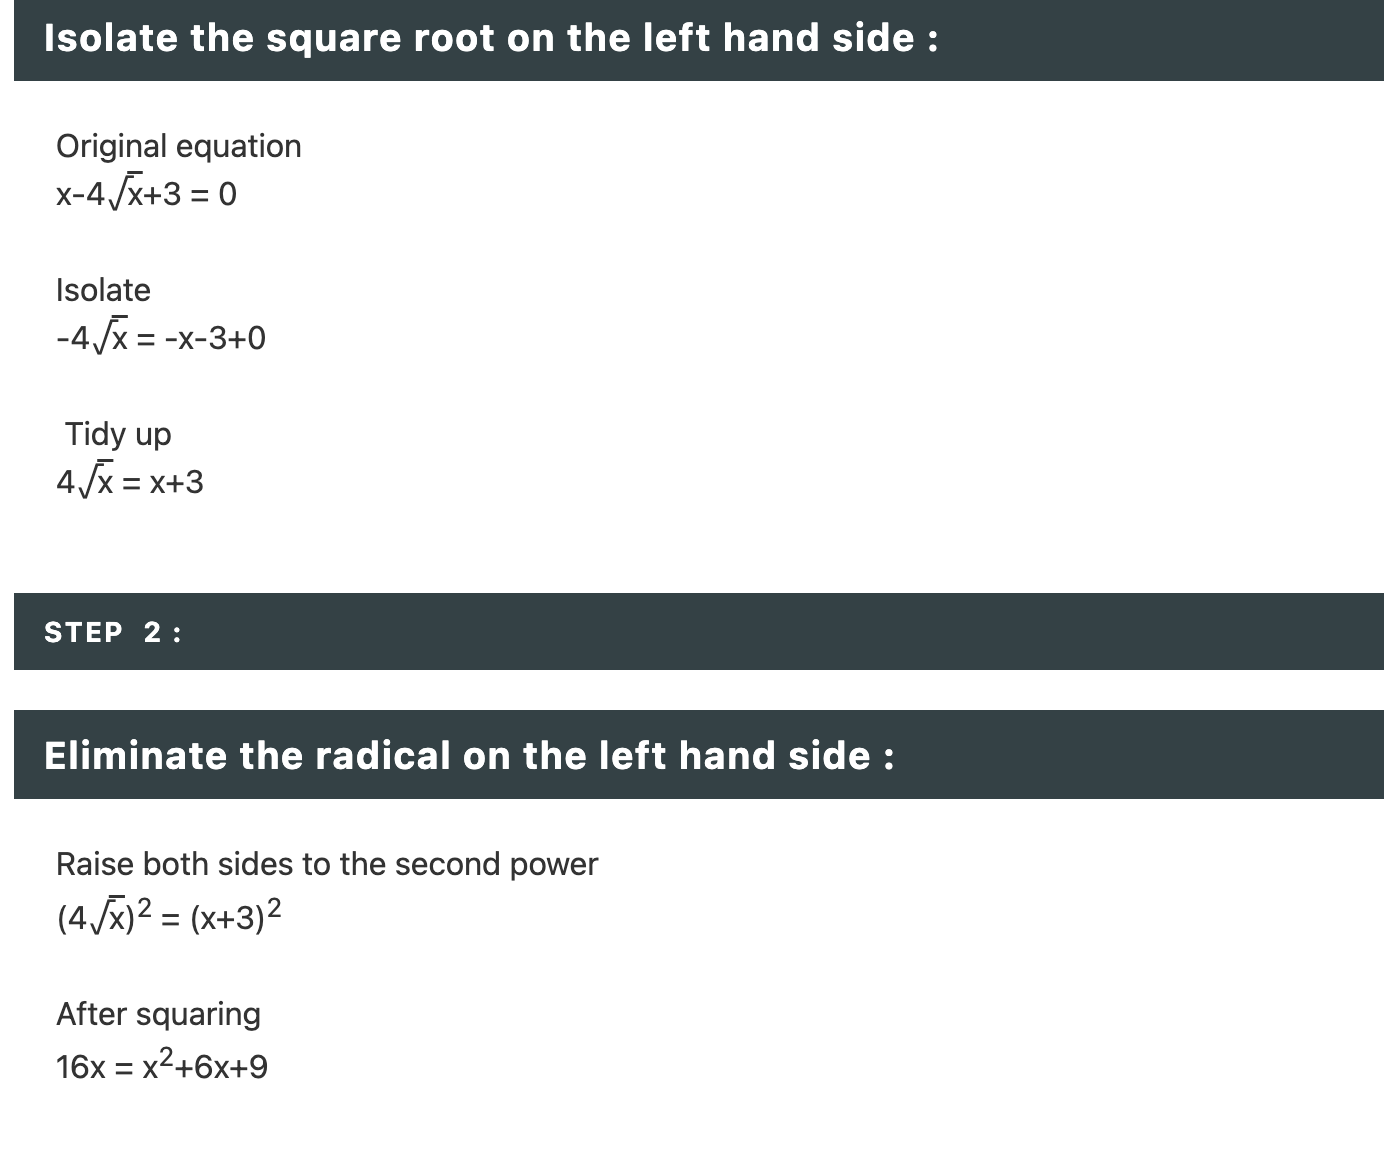
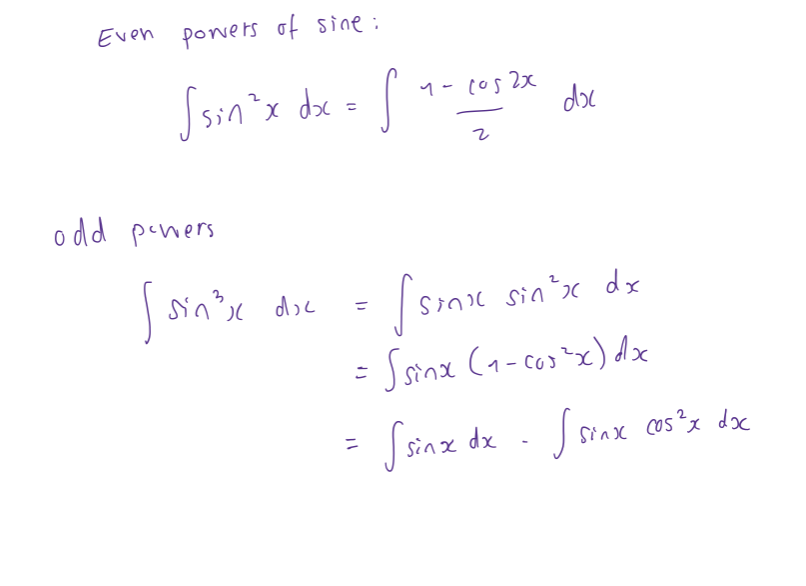
find the values of x
how to integrate odd and even powers of x
How to do a hypothesis test for a correlation
method 1
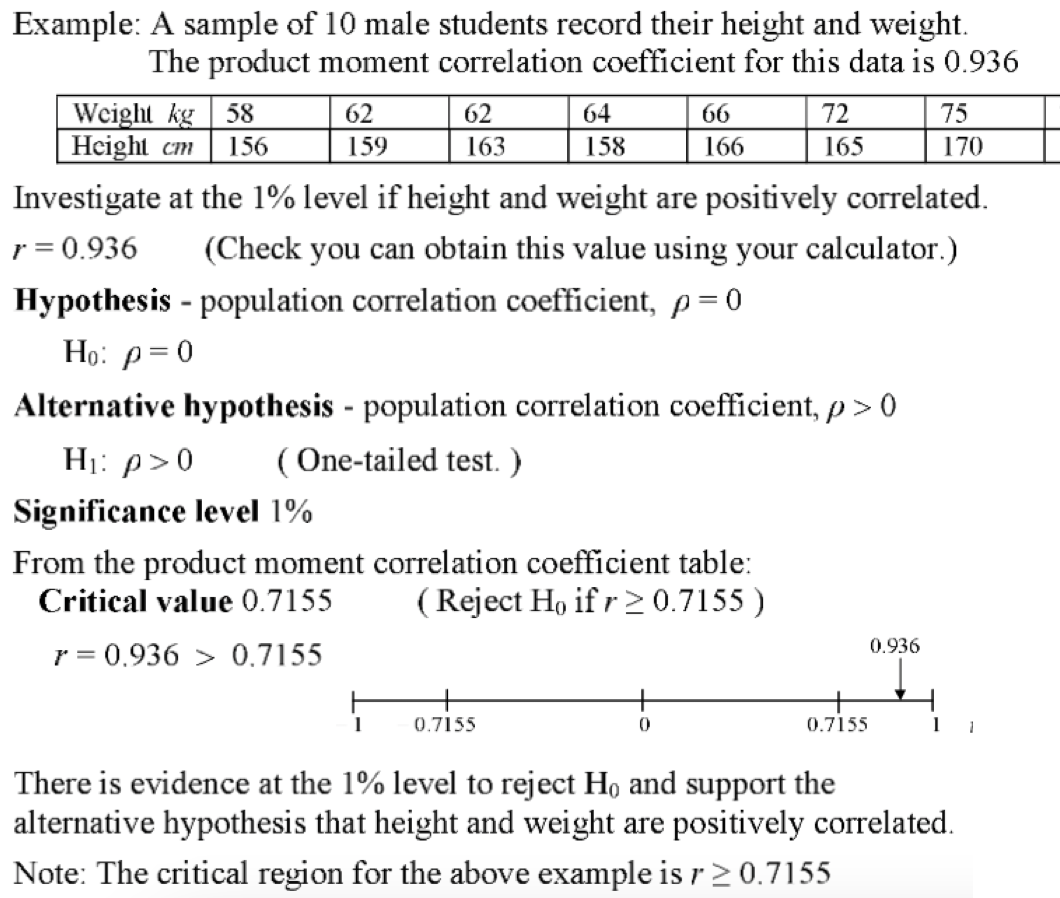
Compare correlation coeficient against critical value then look for the more extreme value.
Accept if the correlation coefficient is more extreme than the critical value
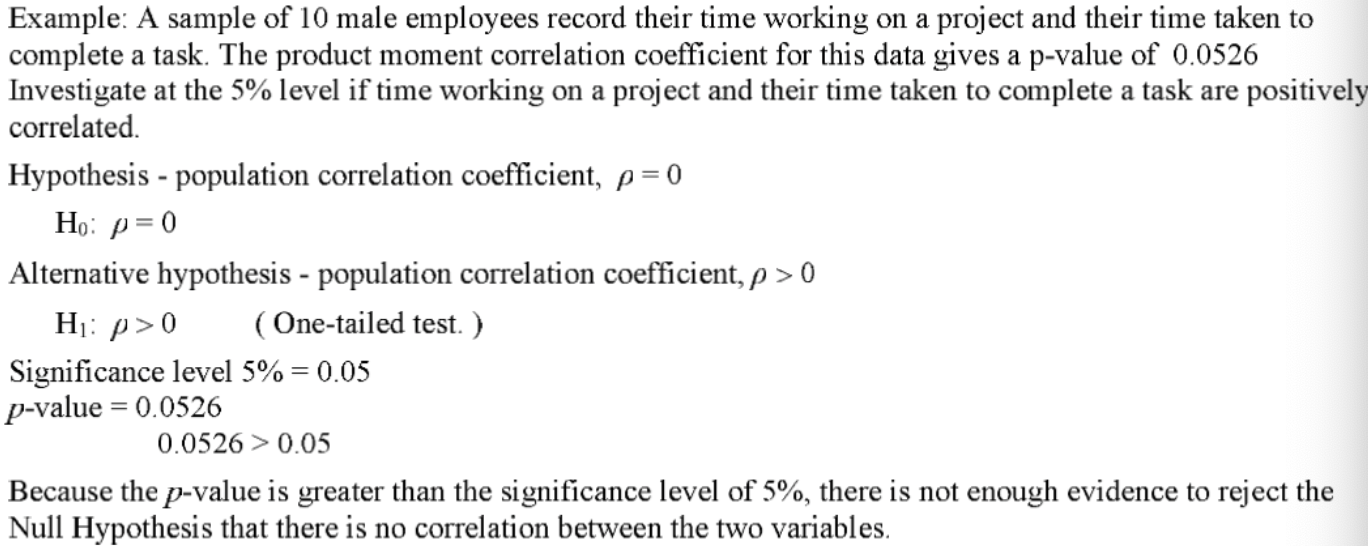
method 2
using the p value - probability of an observed or more extreme result arising by chance when the null hypothesis is true
if p < sig level
correlation is stat significant
if p > sig level
correlation is not stat significant
When to use spearman’s rank correlation coefficient
non linear relationships
hwo to test if a point is a tangent to a circle
if you add the point to the equation of the circle and it produces a repeated root
what does the area of a histogram represent and the hight of the black mean
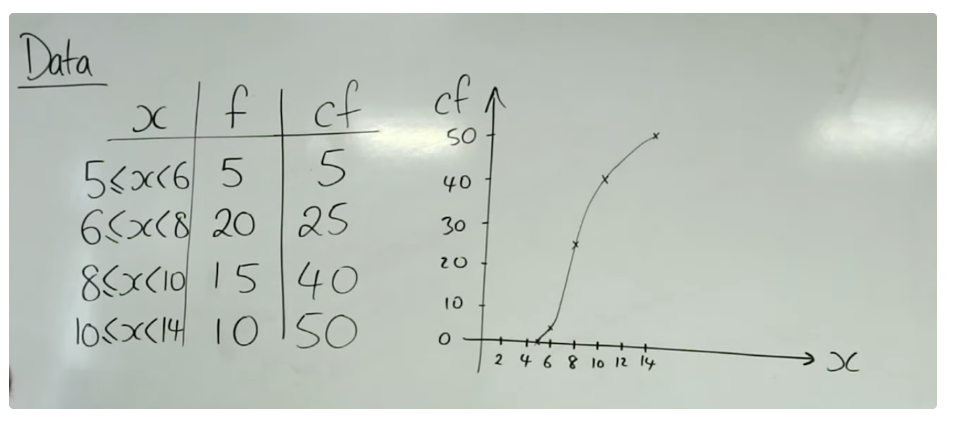
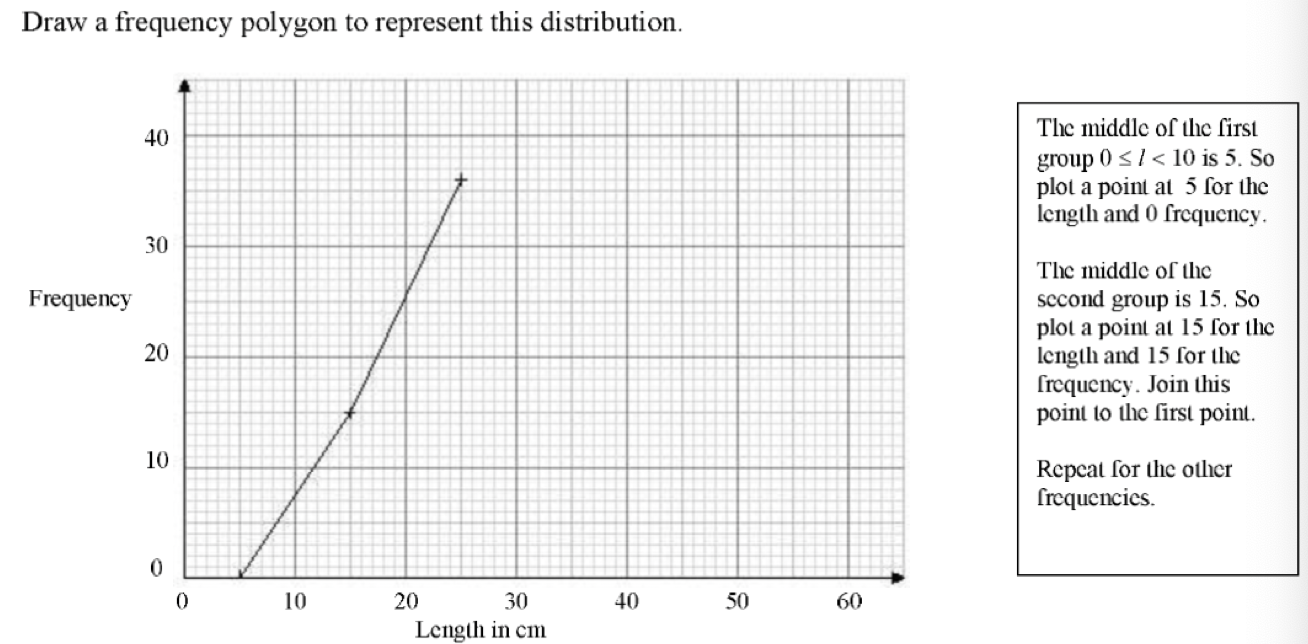
how to plot data from a frequency table

how to plot a cumulative freqency table

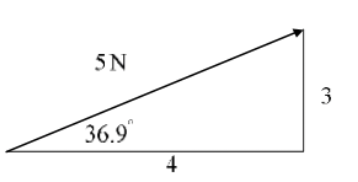
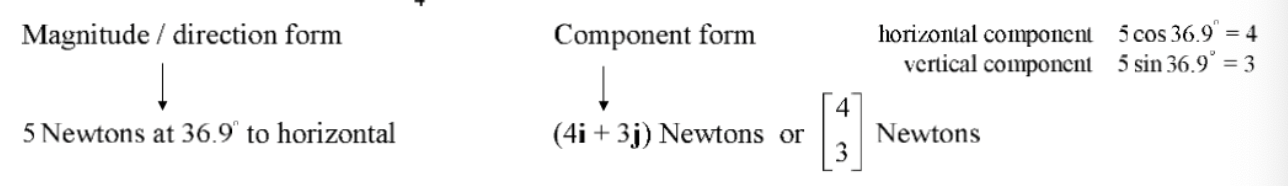
how to write component form vs magnitude direction form for this triangle
give some LDS info
The labor force data included some older estimates of labor force so the data
Countries which are not in Northern Africa have all been labelled Southern Africa
labour force is often estimated
The entry gives the number of mobile phone subscribers for every 100 in the population – note that this figure can be greater than 100.
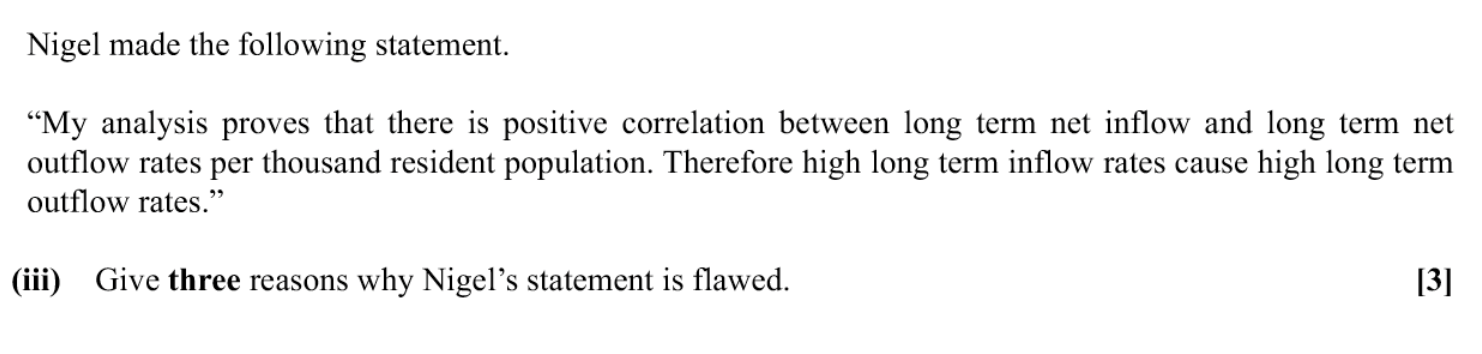
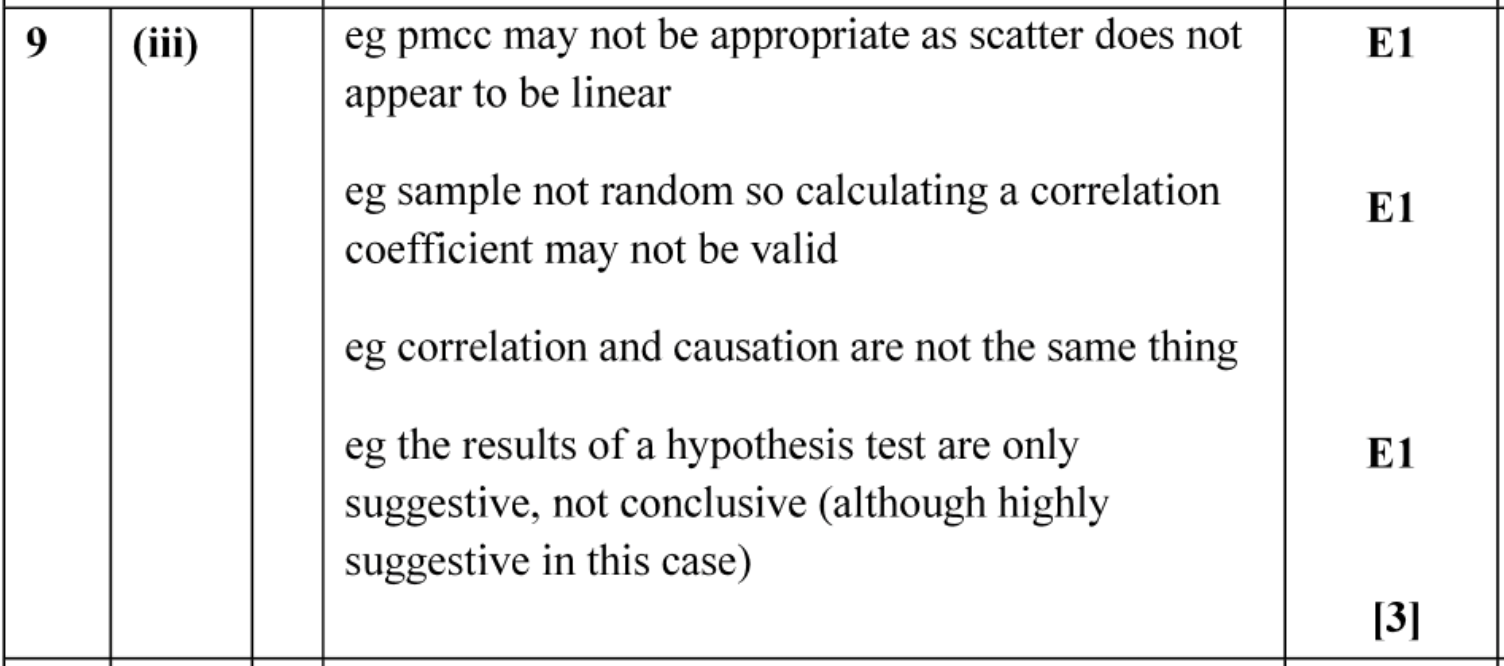
why is something not simple random
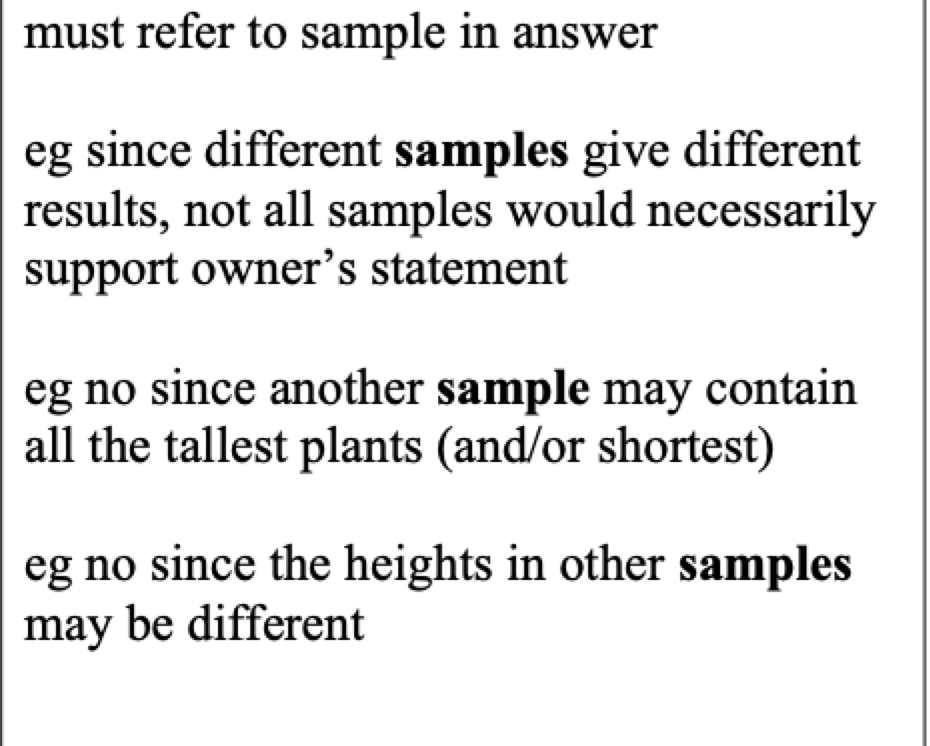
how to describe why the data might not be representative of population
why is this graph not a function [y = 1/x root x]
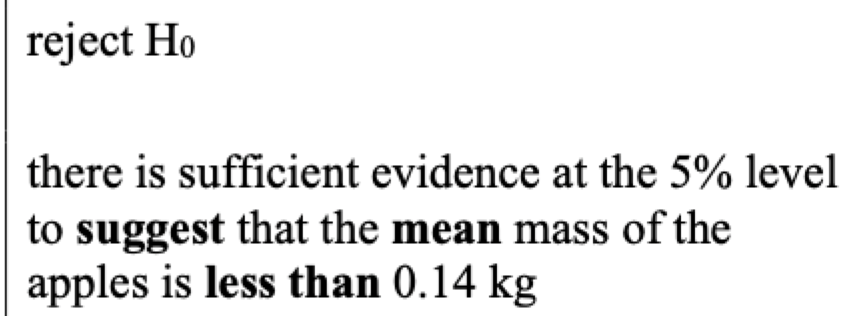
what to do if value is less than sig level