3.1.1.2 - Mass number and isotopes
1/15
Earn XP
Description and Tags
Name | Mastery | Learn | Test | Matching | Spaced |
|---|
No study sessions yet.
16 Terms
Relative atomic mass
Average mass of atom of element on scale where 1 atom of carbon-12 = 12
Relative isotopic mass
Mass of atom of isotope of element on scale where 1 atom of carbon-12 = 12
Relative molecular mass
Average mass of molecule on scale where 1 atom of carbon-12 = 12
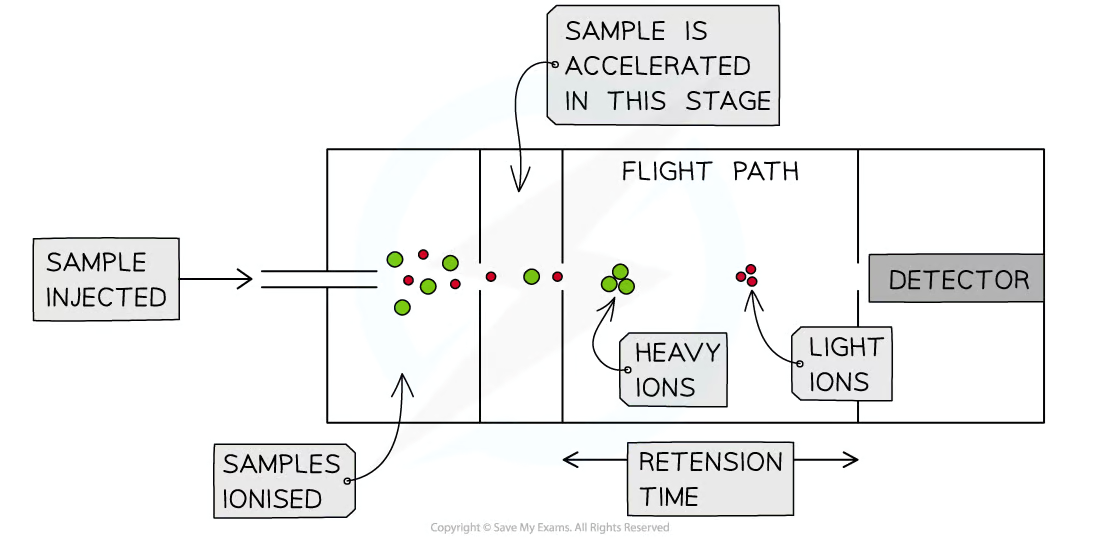
Stages of TOF mass spectrometer
Ionisation
Acceleration
Ion drift
Detection
Electrospray ionisation (mass spectrometry)
Sample dissolved + pushed through nozzle at high pressure
High voltage applied → each particle gains H+ ion
Sample turned into gas made of +ve ions
Electron impact ionisation (mass spectrometry)
Sample vaporised → ‘electron gun’ fires high energy electrons at it
1 e- knocked off each particle → become 1+ ions
Acceleration (mass spectrometry)
+vely charged ions accelerated by electric field so they all have same KE
→ lighter ions move faster than heavier ions
Ion Drift (mass spectrometry)
Ions enter region with no electric field, so drift through it
→ lighter ions drift faster than heavier ions
Detection (mass spectrometry)
Lighter ions travel faster in drift region → reach detector quicker than heavier ions
Detector detects charged particles + mass spectrum produced
Mass Spectrum
y-axis - abundance of ions
x-axis - mass/charge ratio
Mᵣ with electron impact ionisation
1 electron knocked off each particle to make 1+ ions
→ mass/charge ratio of peaks are same as Mᵣ of isotope
Mᵣ with electrospray ionisation
H+ ion added to each particle to form 1+ ions
→ mass/charge ratio of peaks are 1 greater than Mᵣ of each isotope
How to calculate Mᵣ from Mass Spectrum
For each peak, read % relative isotopic abundance (y-axis) and relative isotopic mass (x-axis)
Multiply them to get total mass for each isotopeAdd up the totals
Divide by 100
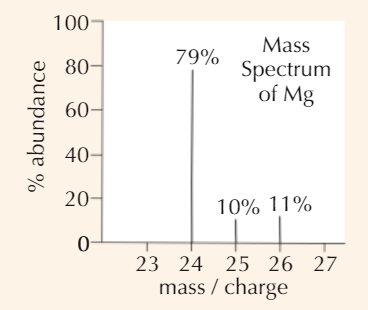
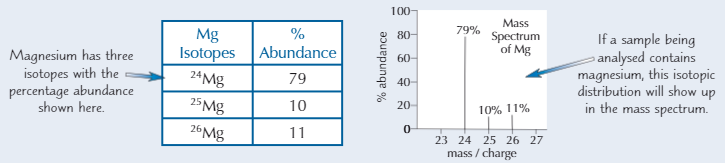
Example Mᵣ calculation Mass Spectrum
79×24 = 1896; 10×25 = 250; 11×26 = 286
1896 + 250 + 286 = 2432
2432/100 = 24.3 (3 s.f.)
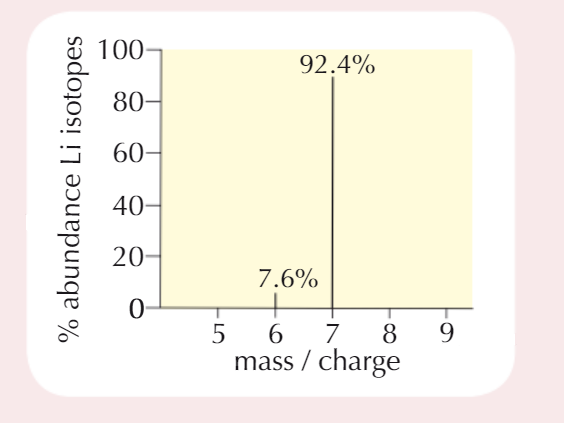
Identifying Elements with Mass Spectrometry
Elements with diff isotopes produce more than 1 line in mass spectrum because isotopes have diff masses
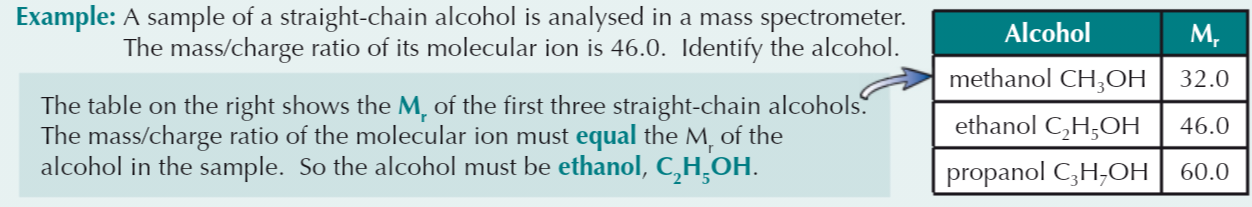
Identifying Molecules with Mass Spectrometry
Molecular ion, M+, is formed in mass spectrometer when 1 e- is removed from molecule
This gives a peak in spectrum with mass/charge ratio equal to Mᵣ of molecule
Can help to identify unknown compound