Regression Theoretical questions
1/3
There's no tags or description
Looks like no tags are added yet.
Name | Mastery | Learn | Test | Matching | Spaced | Call with Kai |
|---|
No analytics yet
Send a link to your students to track their progress
4 Terms
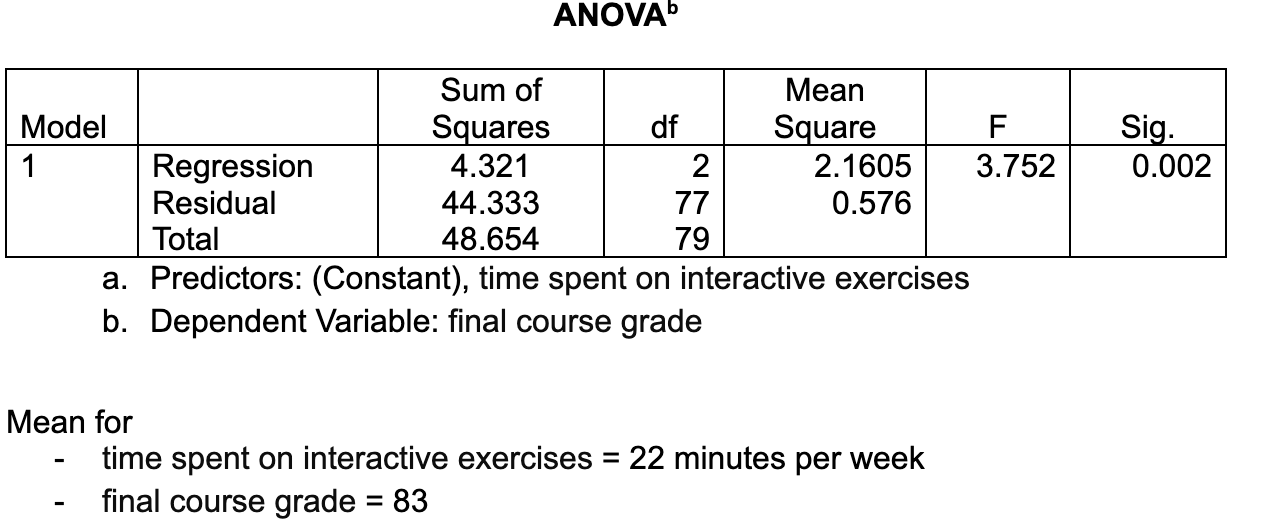
What is the p-value comparing in the ANOVA table above?
The p-value is comparing If the mean of the dependent variable (final course grade of 83) (the null hypothesis) is a better predictor than using a linear regression equation that uses interactive exercises to predict final course grade (the alternative hypothesis)
Using the relevant information above, what would you predict your final course grade would be if your time spent on interactive exercises was 38 minutes per week under the following conditions:
when rejecting the null hypothesis?
when failing to reject the null hypothesis?
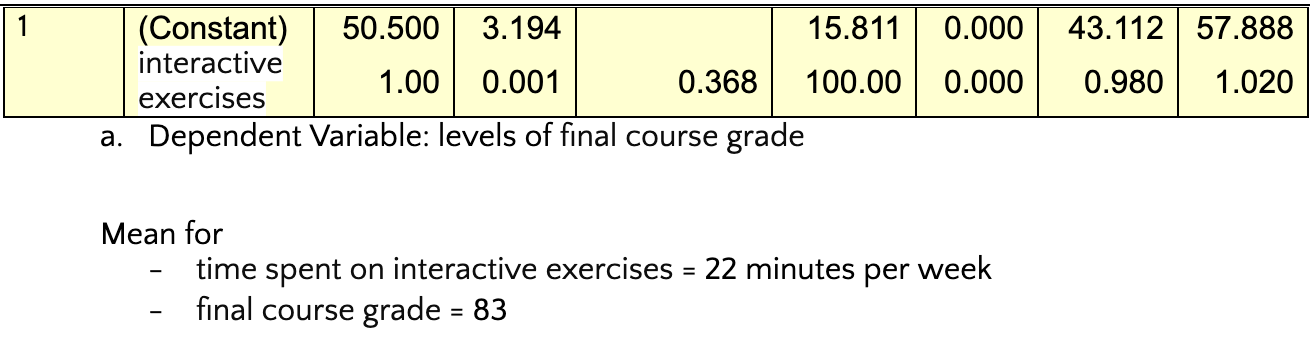
When rejecting the null hypothesis, I would use this equation to predict my final course grade (Constant + B for # of interactive exercises X 38 times interactive exercises). Here’s the result:
50.5 + 1(38)= 88.5 Final course grade
When failing to reject the null hypothesis, the best predictor for number of interactive exercises completed when we fail to reject the null hypothesis is the mean of the dependent variable (final course grade = 83)

What is the p-value comparing in this ANOVA table?
The p-value compares two things. If the mean of the dependent variable (final course grade of 83) (the null hypothesis) is a better predictor than using a linear regression equation that uses interactive exercises and completed quizzes, to predict final course grade (the alternative hypothesis)
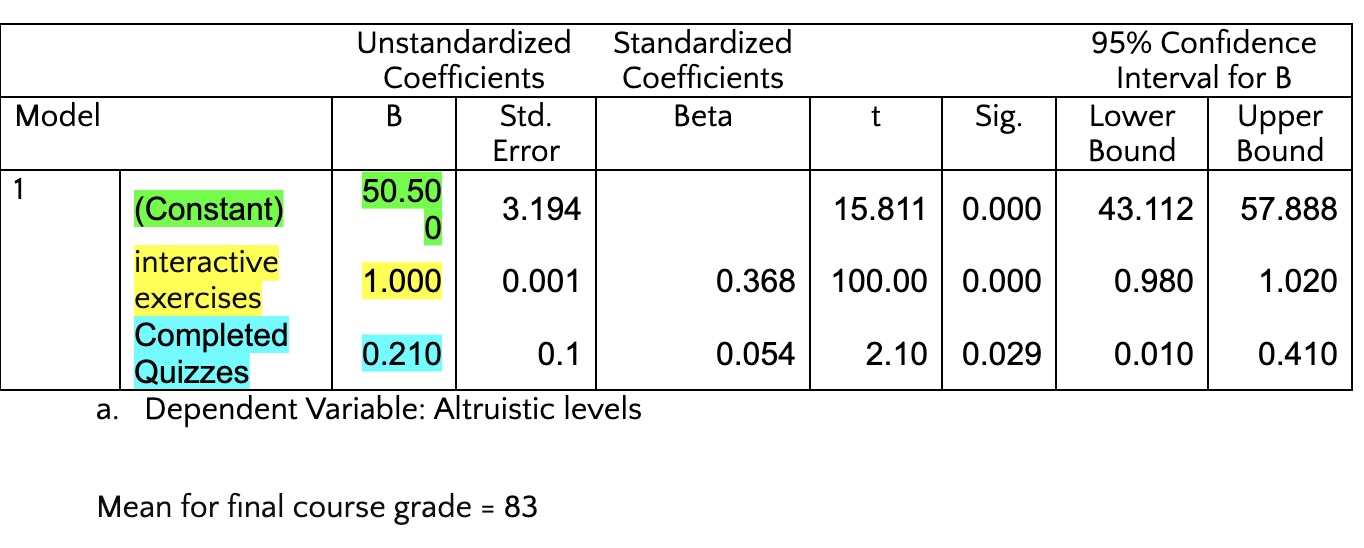
Using the information int the table above, what would you predict your final course grade to be if your social media usage was 150 minutes per day and your social comparison tendency were 15 out of 20 under the following conditions:
Rejecting the null hypothesis?
Failing to reject the null hypothesis?
When rejecting the null hypothesis, I would use this equation to predict my final course grade (Constant + B1 interactive activities X 38 minutes + B2 completed quizzes X 10 completed quizzes). Here’s the result:
50.5 + 1(38) + 0.21(10) = 90.6 final course grade
When failing to reject the null hypothesis, The best predictor of final course grade when we reject the null hypothesis is the mean of the dependent variable (final course grade = 83)