Presentation and display of quantitative data
0.0(0)
0.0(0)
New
Card Sorting
1/4
There's no tags or description
Looks like no tags are added yet.
Study Analytics
Name | Mastery | Learn | Test | Matching | Spaced |
|---|
No study sessions yet.
5 Terms
1
New cards
ways to present quantitative data
tables, scattergrams, bar charts, histograms
2
New cards
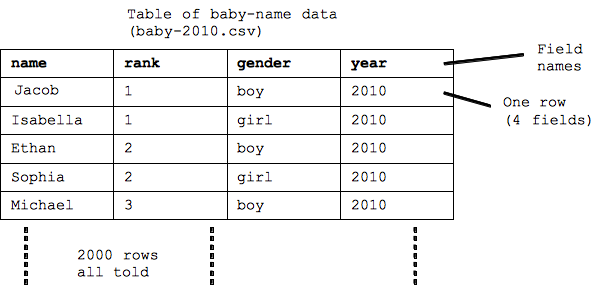
Tables
straightforward
easy to compare
3
New cards
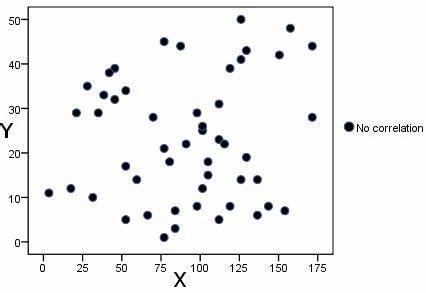
Scattergram
shows correlations
Continuous data
4
New cards
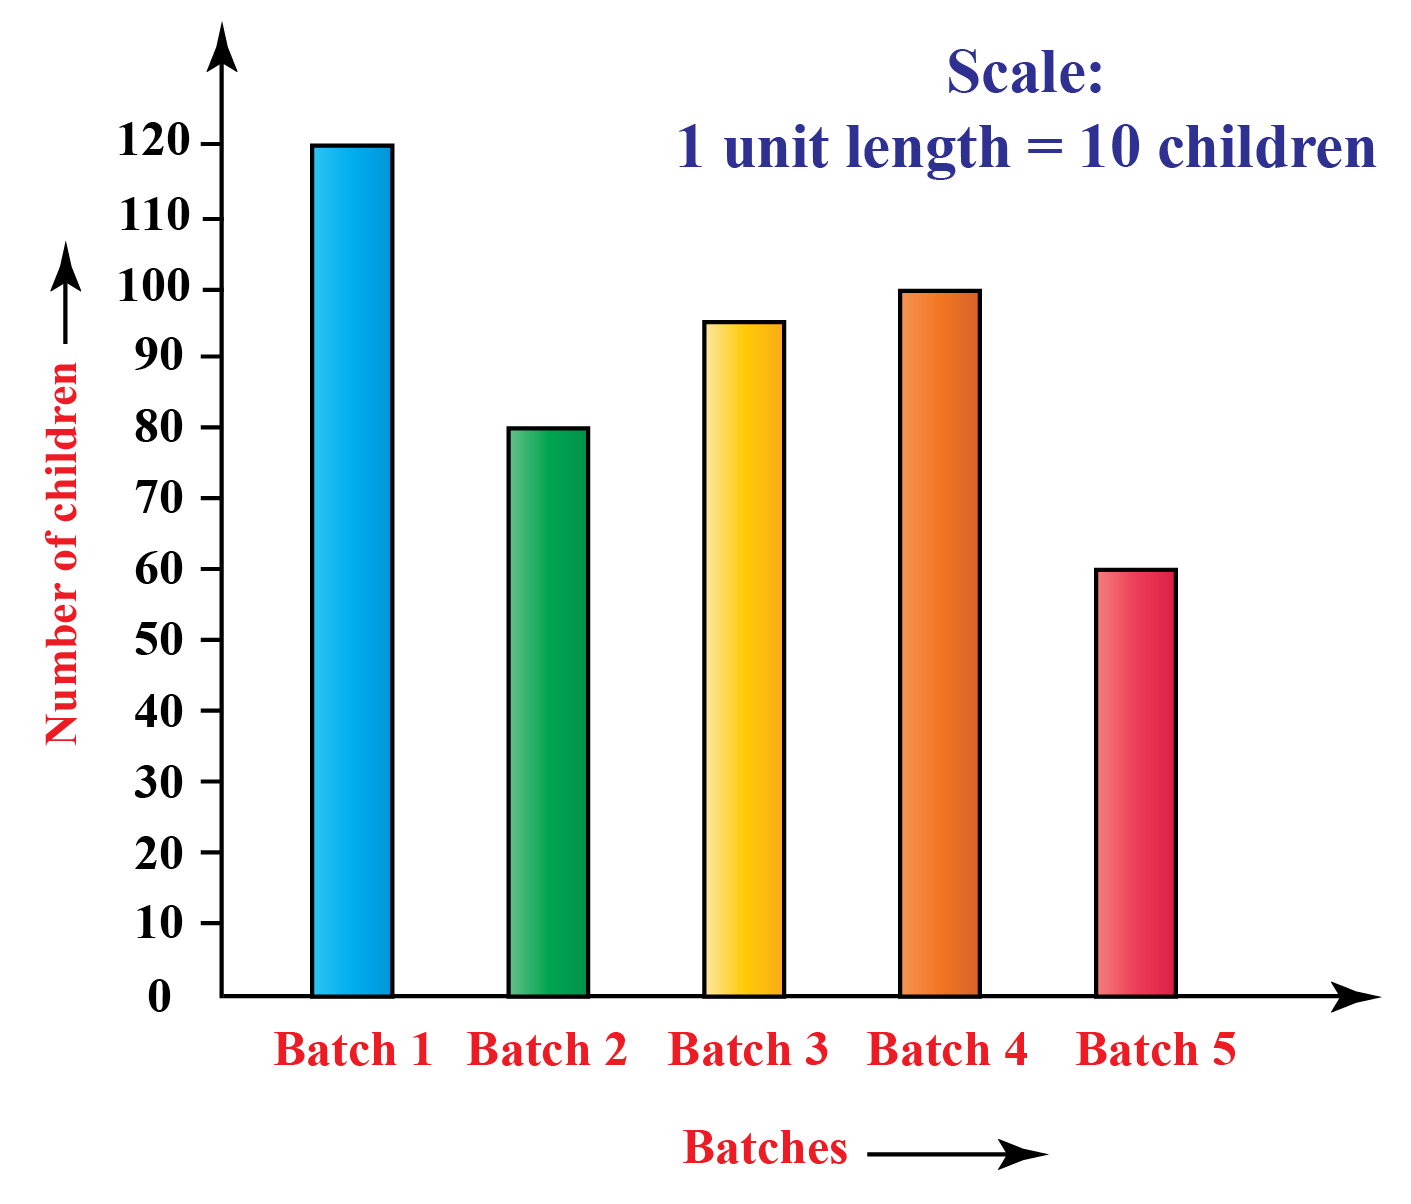
Bar chart
shows frequency data for discrete (separate) variables
y axis represents the value
5
New cards
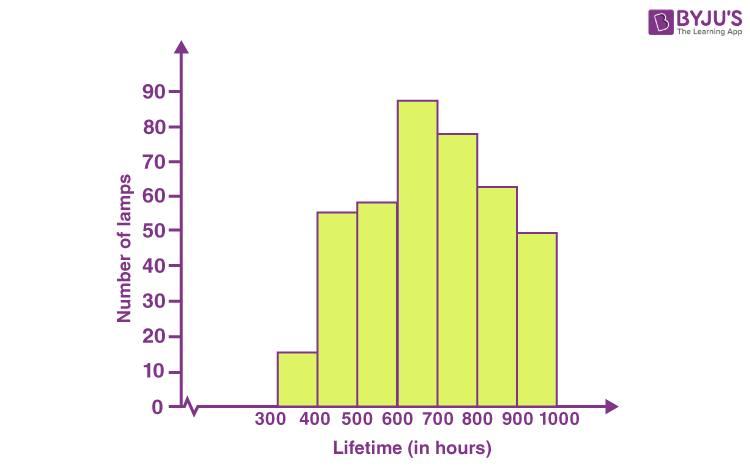
Histogram
similar to bar chart, except bars touch as it presents continuous data
y axis represents frequency