econ test 3
1/42
There's no tags or description
Looks like no tags are added yet.
Name | Mastery | Learn | Test | Matching | Spaced |
|---|
No study sessions yet.
43 Terms
Classical economists argued that unemployment during the Depression could be reduced
by:
A) lowering taxes.
B) eliminating labor unions and government policies that kept wages too high.
C) strengthening unions and government regulations protecting unions and workers.
D) increasing real wages so that people are encouraged to work.
B) eliminating labor unions and government policies that kept wages too high.
A Keynesian economist would be most likely to agree with which of the following
statements?
A) Government can implement policy proposals that can positively impact the economy.
B) Most government policies would probably make things worse.
C) The economy ought to be left to market forces.
D) Government policies do not affect economic activity
A) Government can implement policy proposals that can positively impact the economy.
according to Keynes, if a large portion of people in the economy decided to save __________, aggregate income could __________.
A) less; stagnate B) less; fall C) more; fall D) more; rise
C) more; fall
The level of income toward which the economy naturally gravitates in the short run is called
A) equilibrium income. C) real income.
B) nominal income. D) potential income
A) equilibrium income.
Suppose the price level falls and people buy more because they feel richer. This effect
is called the:
A) interest rate effect C) wealth effect
B) international effect D) multiplier effect
C) wealth effect
a lower U.S. price level will cause U.S. exports to __________ and U.S. imports to_______.
A) increase, decrease C) decrease, decrease as well
B) decrease, increase D) increase, increase as well
A) increase, decrease
If the price level falls, the interest rate effect will cause:
A) investment and the quantity of aggregate demand to decrease.
B) investment to increase and the quantity of aggregate demand to decrease.
C) investment to decrease and the quantity of aggregate demand to increase.
D) investment and the quantity of aggregate demand to increase.
D) investment and the quantity of aggregate demand to increase.
For some time now, the U.S. has been pressuring Japan to institute policies to improve its weak economy. What effect would these policies have on the U.S.?
A) They would shift the U.S. aggregate demand curve left.
B) They would cause the U.S. to move up its aggregate demand curve.
C) They would shift the U.S. aggregate demand curve right.
D) They would cause the U.S. to move down its aggregate demand curve
C) They would shift the U.S. aggregate demand curve right. (see why)
Which of the following would shift the aggregate demand curve to the left?
A) A higher future expected price level.
B) An increase in exports.
C) An appreciation of the domestic currency.
D) An increase in foreign income.
C) An appreciation of the domestic currency.
(m/p pg)
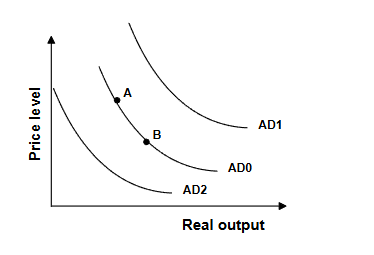
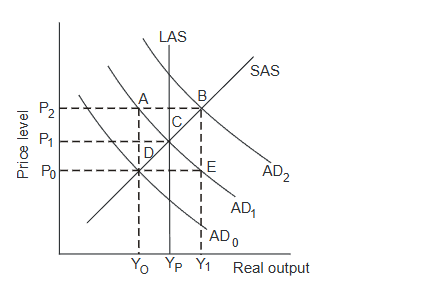
Refer to the graph above. From 1938 to 1943 the Federal deficit rose from $1.0 billion to $53.8 billion due to increased defense spending. The effect of this on the AD curve
can be shown by:
A) a shift from AD0 to AD2 C) a movement from A to B
B) a shift from AD0 to AD1 D) a movement from B to A
B) a shift from AD0 to AD1 cause government spending shifts ad
Refer to the graph above. During the 1970s, the money supply in the United States grew rapidly. The effect of this on the AD curve is best shown by a movement from:
A) B to A B) AD0 to AD2 C) A to B D) AD0 to AD1S
D) AD0 to AD1S? cause money supply increases consumption and investment
Which of the following statements is true?
A) The AD curve could shift out by more or less than the initial shift factor.
B) The AD curve will shift out as much as the initial shift factor.
C) The AD curve will shift out by more than initial shift factor due to the multiplier.
D) The AD curve will shift out by less than the initial shift factor due to leakages
C) The AD curve will shift out by more than initial shift factor due to the multiplier.
The short-run aggregate supply curve specifies how shifts in __________ affect real output and the price level in the short run.
A) market supply C) aggregate supply
B) aggregate demand D) market demand
B) aggregate demand
Why the others are wrong:
A) market supply → refers to microeconomic supply, not macro.
C) aggregate supply → SRAS doesn’t show how AS shifts; it's one of the AS curves.
D) market demand → micro term again, not macro.
According to the short-run aggregate supply curve, firms respond to a reduction in aggregate demand by:
A) cutting production. C) cutting prices.
B) cutting neither production nor prices. D) cutting production and prices
A) cutting production
If productivity increases by 2% but wages increase by 5%, then it is most likely that:
A) the price level will rise by 7 percent. C) the price level will fall by 7 percent.
B) the price level will rise by 3 percent. D) the price level will fall by 3 percent
B) the price level will rise by 3 percent.
Unit labor cost=Wage growth−Productivity growth
The short-run aggregate supply curve is most likely to shift down if:
A) sales taxes increase. C) wages rise.
B) import prices fall. D) productivity falls.
B) import prices fall
If input prices fall → production costs fall → SRAS shifts DOWN/RIGHT
A) sales taxes increase
Sales taxes raise costs → SRAS shifts UP/LEFT
❌ Not down.
C) wages rise
Wages are the largest cost → SRAS shifts UP/LEFT
❌ Not down.
D) productivity falls
Lower productivity raises costs → SRAS shifts UP/LEFT
❌ Not down.
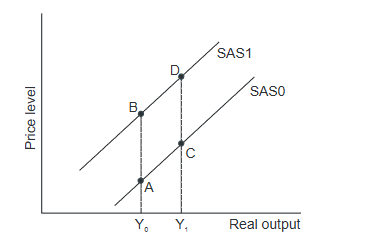
Refer to the above graph. A movement from C to D is most likely to be caused by:
A) an increase in aggregate demand. C) a decrease in input prices.
B) a decrease in aggregate demand. D) an increase in input prices.S
D) an increase in input prices.
This matches the upward shift from SAS0 → SAS1 that moves point C to D.
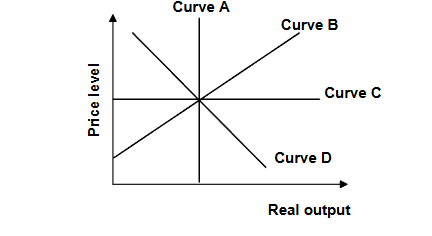
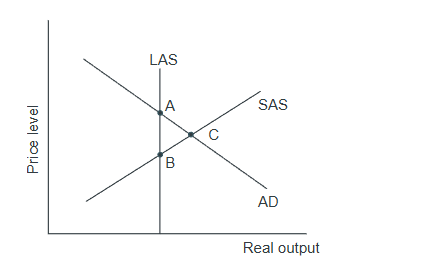
Refer to the graph above. The short-run relationship between the supply of output and the price level is reflected in:
A) curve A. B) curve B. C) curve C. D) curve D.
B) curve B
The long-run aggregate supply curve is:
A) upward sloping because it shows that a higher price level will bring about higher
output in the long run.
B) horizontal because it shows that an increase in aggregate demand will increase
output in the long run.
C) downward sloping because it shows that an increase in aggregate demand will
reduce both the price level and output in the long run.
D) vertical because it shows that a higher price level will not bring about higher output
in the long run
D) vertical because it shows that a higher price level will not bring about higher output
cause its a line
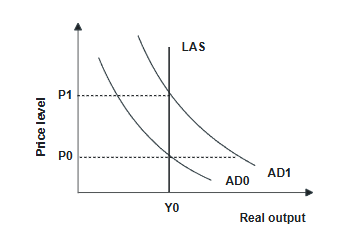
A 10 percent increase in the price level:
A) increases potential output by 10 percent.
B) increases potential output by less than 10 percent.
C) does not affect potential output.
D) increases potential output by more than 10 percent
C) does not affect potential output.
Because potential output depends on resources and technology, not the price level, so changes in prices don’t affect it.
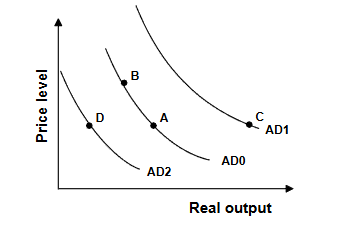
Refer to the graph above. The economy is in a long-run equilibrium at:
A) point A. B) point B. C) point C. D) no point in the graph.S
C) point C
because page 199
In the long run, the price level is determined by the position(s) of:
A) the long-run aggregate supply curve.
B) the aggregate demand curve.
C) the aggregate demand curve and the long-run aggregate supply curve.
D) the long-run and short-run aggregate supply curves.
C) the aggregate demand curve and the long-run aggregate supply curve.
think of it as a graph
A(n) __________ exists when aggregate demand exceeds potential output.
A) inflationary gap C) recessionary gap
B) long-run equilibrium D) short-run equilibrium
A) inflationary gap
amount output is above potential output
If __________ exceeds __________, eventually input prices will rise and output will
fall.
A) long-run aggregate supply; short-run aggregate supply
B) potential output; aggregate demand
C) potential output; short-run aggregate supply
D) aggregate demand; potential output
D) aggregate demand; potential output
i duno

Refer to the graph above. If the price level is P1, then input prices will __________
and output will __________ in the long run.
A) rise; also rise B) rise; fall C) fall; rise D) fall; also fallS
B) rise; fall
“Because the price level is above long-run equilibrium, input prices rise due to excess demand for resources, causing output to fall back to potential.”
Which of the following has preceeded all but one of the Post WWII recessions in the
US?
A) A steel workers strike. C) An increase in oil prices.
B) An increase in taxes. D) A recession in Japan
C) An increase in oil prices.
All of the following can explain the asymetric response of the economy to oil prices
except:
A) a strict countercyclical fiscal policy response.
B) the asymetric response of petroleum product prices to oil prices.
C) the costs of adjustment to changes in oil prices.
D) the asymetric monetary policy response
A) a strict countercyclical fiscal policy response.
asymmetric responses come from how prices, adjustment costs, and monetary policy react differently to oil price increases versus decreases—not from fiscal policy.
According to Real Business Cycle Theory decreases in productivity could be caused by:
A) decreased foreign income.
B) increased concerns about the economy.
C) increased government regulation.
D) increases in technology
C) increased government regulation.
RBC theory says productivity can fall when regulations reduce efficiency, making them a valid source of negative productivity shocks.
A policy that raises taxes or reduces government spending is called:
A) an expansionary fiscal policy. C) a contractionary fiscal policy.
B) a contractionary monetary policy. D) an expansionary monetary policy
C) a contractionary fiscal policy.
BOSNIa pg
No changes in fiscal policy are advisable when the economy is at point:
A) A. B) B. C) C. D) D.Ss
look later
If the economy is not experiencing inflation and unemployment is at the target rate, then
the most appropriate fiscal policy is:
A) impossible to determine without knowing potential output.
B) contractionary.
C) expansionary.
D) neither expansionary nor contractionary.
D) neither expansionary nor contractionary. ✅
Reason: If inflation is stable and unemployment is at its target (full employment), the economy is in long-run equilibrium, so no fiscal intervention is needed.
Suppose policy makers know that actual output is falling but are unsure about the level
of potential output. Under these circumstances, the best policy is probably to:
A) adopt policies that bring the economy to full employment.
B) adopt contractionary policies that reduce the threat of inflation.
C) adopt no policies until an estimate of potential output can be obtained.
D) adopt expansionary policies that maintain or increase economic growth
D) adopt expansionary policies that maintain or increase economic growth
If output is falling, the risk of recession is more pressing than the uncertain risk of inflation, so mild expansionary policy is the safer choice.
All of the following are reasons that fiscal policy might not be effective except:
A) the policymaker may not know where the LAS curve is.
B) the multiplier model diminishes the initial effect.
C) government response is slow.
D) Real Business Cycle theory does not support it
B) the multiplier model diminishes the initial effect.
it amplifies not diminish
In which model do policymakers manipulate the economy in order to win re-election?
A) Partisan Theory C) Real Business Cycle
B) Political Business Cycle D) None of the above
B) Political Business Cycle ?
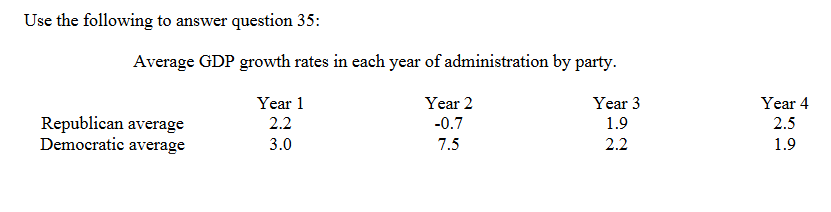
The above table supports the _________________________ because
______________________.
A) Political Business Cycle theory; GDP is high for both parties in the last year
B) Partisan Theory; the growth rates are similar in most years
C) Political Business Cycle theory; the growth rates are higher for the Democrats than
the Republicans
D) Partisan Theory; the growth rate for the Democrats is higher than for the
Republicans in year 2
D) Partisan Theory; the growth rate for the Democrats is higher than for the
Republicans in year 2?
If the mpe is 0.75 and autonomous expenditures are $300, then the multiplier equation
implies that total equilibrium expenditures in the economy are:
A) $1,200. B) $375. C) $225. D) $300.
A) $1,200. ✅
Reason (quick):
Multiplier = 11−0.75=4\frac{1}{1 - 0.75} = 41−0.751=4
Total spending = 300×4=1200300 \times 4 = 1200300×4=1200.
According to the multiplier equation, an increase in the marginal propensity to expend:
A) decreases total output. C) increases autonomous expenditures.
B) decreases autonomous expenditures. D) increases total output.
D) increases total output.
A higher marginal propensity to expend makes the multiplier larger, which increases total output.
In the multiplier model, if the mpe is 0.5, then the expenditures multiplier is:
A) 4. B) 0.5. C) 5. D) 2.
D) 2.
Multiplier=1/(1−MPE)
Because of political unrest in South Korea, investment declines by 50. If the mpe is
0.75, income would likely decline by:
A) 50. B) 200. C) 37.5. D) 87.5.
Answer: B) 200
1/(1-0.75)*-50)
The multiplier model cannot be used:
A) to estimate how changes in autonomous expenditures alter the equilibrium level of
output.
B) to explain why changes in autonomous investment occur.
C) to estimate the effect on equilibrium income of a change in net exports.
D) to estimate the effect on equilibrium income of a change in government spending
B) to explain why changes in autonomous investment occur.
The multiplier model shows the effect of changes in spending on output but cannot explain why autonomous investment changes.
In the multiplier model, a recession is most likely to occur when:
A) increases in autonomous expenditures fail to be translated into increases in income
and output.
B) decreases in autonomous expenditures are magnified into significantly larger decreases in income and output.
C) investment exceeds saving.
D) firms don't produce enough output.
B) decreases in autonomous expenditures are magnified into significantly larger
A recession occurs because a drop in autonomous spending gets amplified by the multiplier, causing a larger decline in income and output.
To cool down an overheating economy, the U.S. government decides to decrease
income by 2000. If the mpe is 0.6, the government should decrease its spending by:
A) 2,000. B) 1,600. C) 800. D) 1,200.
c)800
1/(1-0.6)=2.5 -2000/2.5=-800
Refer to the graph above. In the graph, input prices will begin to rise and output will
begin to contract if:
A) the price level is P1 and the aggregate demand curve is AD1.
B) the price level is P0 and the aggregate demand curve is AD0.
C) the price level is P0 and the aggregate demand curve is AD1.
D) the price level is P1 and the aggregate demand curve is AD0.
look up later