CHS Stats - Chapter 9
1/21
There's no tags or description
Looks like no tags are added yet.
Name | Mastery | Learn | Test | Matching | Spaced | Call with Kai |
|---|
No analytics yet
Send a link to your students to track their progress
22 Terms
correlation
relationship between 2 variables
independent variable
aka explanatory variable; x
dependent variable
aka response variable; y
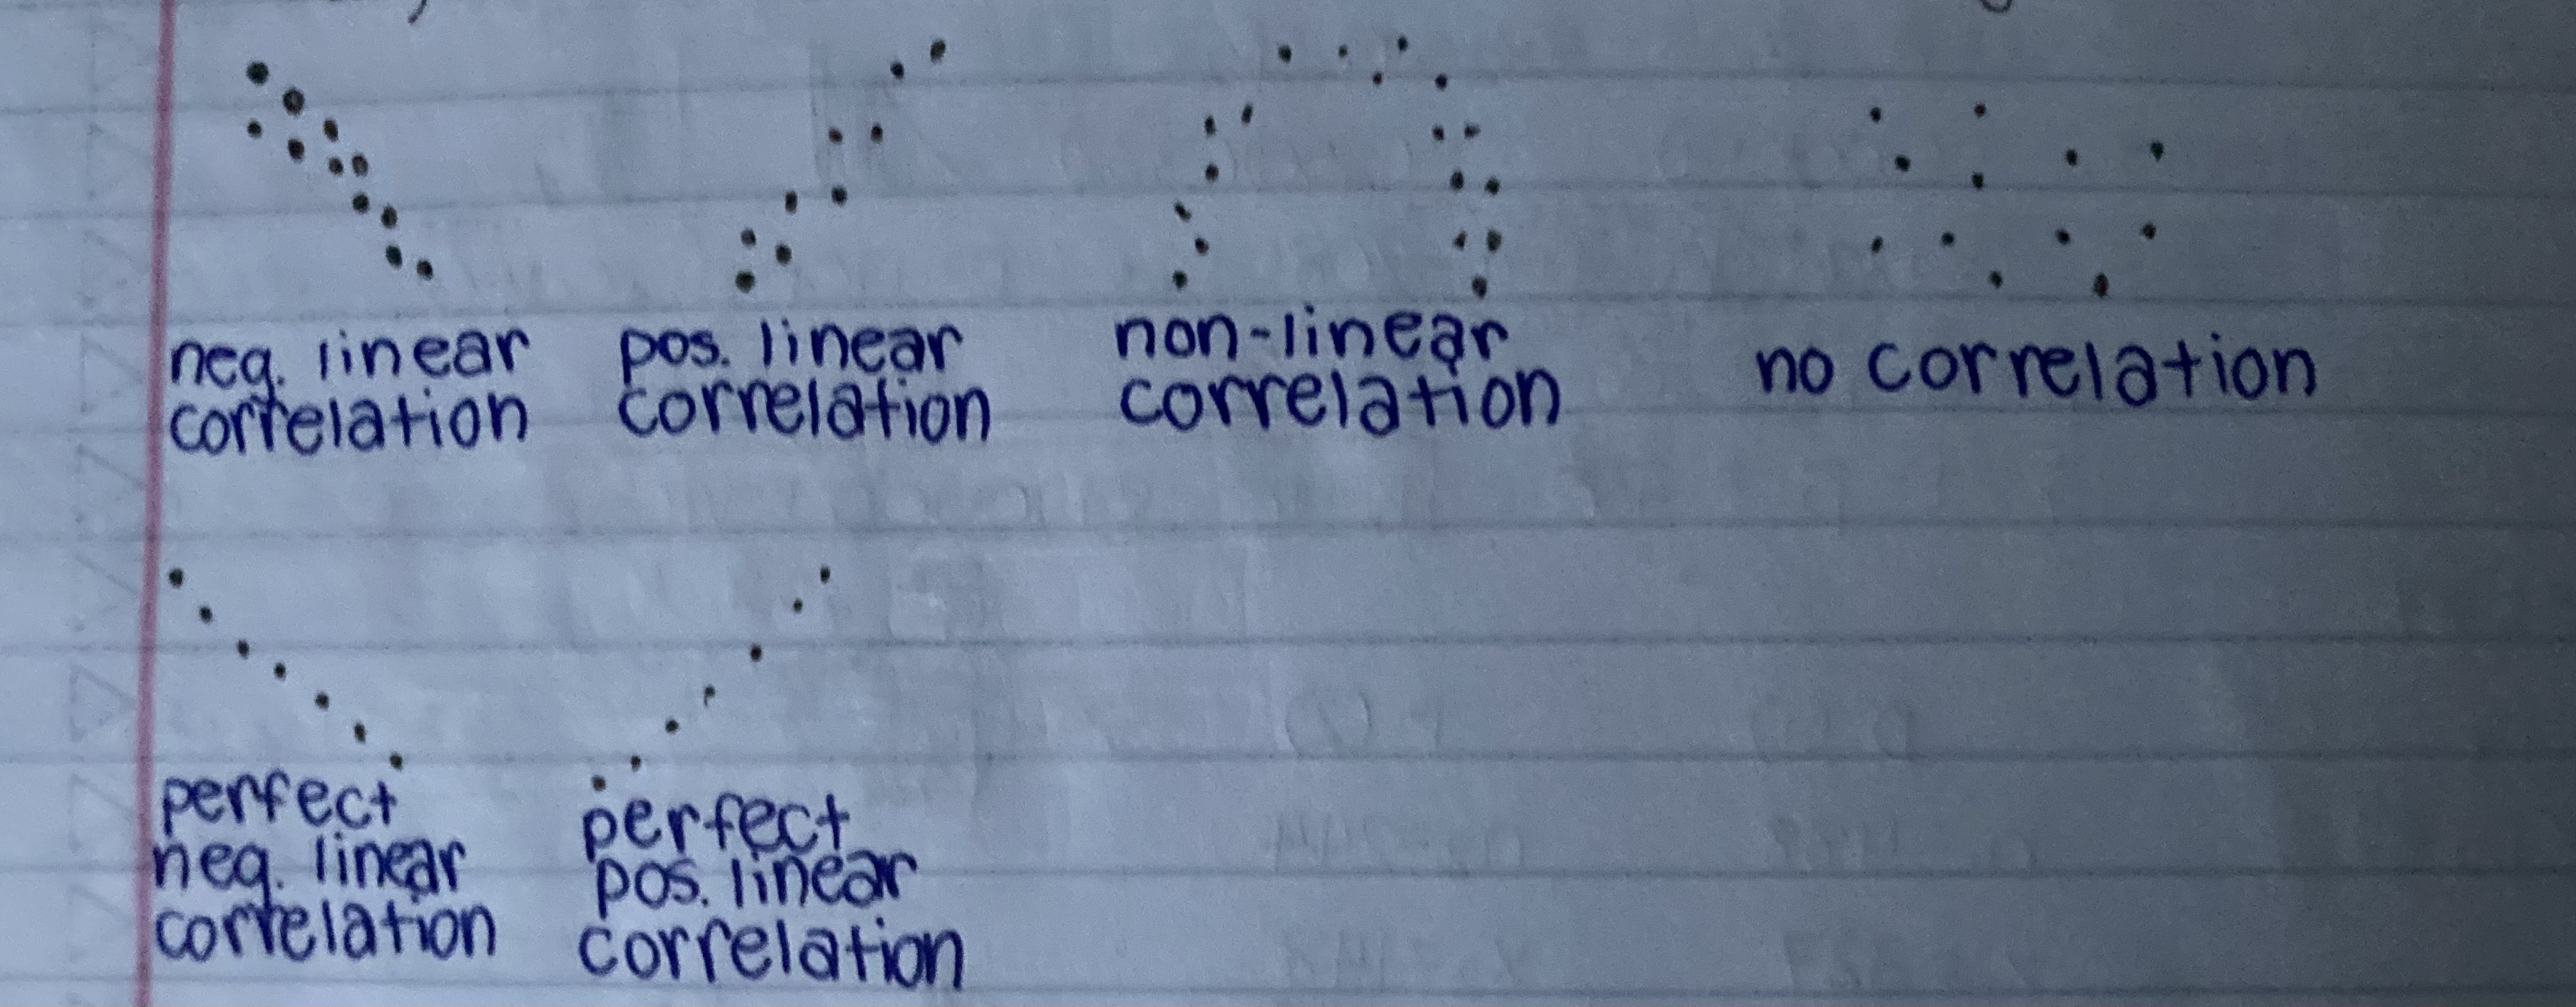
types of correlation
correlation coefficient
a measure of the strength and direction of a line of a linear relationship between variables
r = sample correlation coefficient
p = population correlation coefficient (Greek letter Rho - “row”)
correlation coefficient direction
based on +/- r
correlation coefficient strength
based on |r|; the closer it is to 1, the stronger it is; if |r| =
0.00-0.24 = no correlation
0.25-0.49 = weak correlation
0.50-0.74 = moderate correlation
0.76-1.00 = strong correlation
1.00 = perfect correlation
Hypothesis Test for Correlation Steps/Formulas
Ho: p = 0 - no significant linear correlation; Ha: p ≠ 0 - there is a significant linear correlation; specify claim
α =
Standardized Test Statistic: t = r / √[(1-r²) / (n-2)]
P-Value: P = tcdf(lower, upper, df) * 2
df = n - 2
* 2 bc it’s always 2-tailed
Decision: If P ≤ α, reject Ho; if P > α, fail to reject Ho
Statement about the claim: can change it up, but always use evidence
Ex. R Ho… evidence suggests that there is a relationship between age and vocab
Is reject Ho a relationship or no relationship? What so fail to reject Ho?
Reject Ho: relationship
Fail to reject Ho: no relationship/no correlation
regression line
aka line of best fit, the line for which the sum of the squares of the residuals is a minimum
predicted value
every point on a regression line
residual
d sub i; the difference between an observed y and a predicted y; d sub i = observed y - predicted y
when the predicted value is on the line, the residual = 0
(x̄, ȳ)
the point that includes the mean of all the x-coordinates and the mean of all the y-coordinates; is always on the regression line
ŷ
predicted y-value based on x sub 0; begins the regression line equation (ŷ = ax+b)
What do you say for predictions for x-values that are too far outside the range of x-values in the given data?
Not meaningful
explained variation
variation that can be explained by the nature of the relationship between x and y
unexplained variation
variation that is not explained by the x-y relationship. Instead, it’s due to other factors, like sampling error, coincidence, and lurking/confounding variables.
total variation
the explained variation + unexplained variation
coefficient of determination
r²; the ratio of explained variation to total variation
r² = explained variation/total variation
Explanation statement for coefficient of determination
r² as a percent of the variation in y can be explained by the relationship between x and y.
substitute problem-specific values/variables for the underlined portions
Prediction Interval for ŷ
Input x & y values into L1 and L2, respectively
Find the regression line
Find the predicted ŷ value based on the given x sub 0 value
Find s sub e (Stat - Tests - F: LinRegTTest, use the s), n, ∑x, and ∑x² (in 1-Var-Stats - just L1 for List, leave FreqList blank)
Find E (equation given on test)
t sub c = invT(area to the left, df)
df = n - 2
n = # of data pairs
(ŷ - E, ŷ + E)
s sub e
Standard Error of the Estimate