ALEVEL BIO WRITTEN PRAC
1/43
There's no tags or description
Looks like no tags are added yet.
Name | Mastery | Learn | Test | Matching | Spaced |
|---|
No study sessions yet.
44 Terms
Enzyme rate experiments
carried out to determine the effect of a changing particular factor on the rate of a reaction.
Whats factors can be changed on enzyme rate experiment
Temperature
pH
Enzyme concentration
Substrate concentration
e key thing with enzyme rate experiments is to ensure that
Only independent variable changes, everyhting else must be controlled
If these control variables are not kept constant,
can affect results and make them unreliable
A good way to evaluate an experimental design is by
repeating the experiment yourself (using the instructions provided) and determining if you can produce similar results
When analysing and criticising the design of an experiment there are several key things to consider
Method limitations
Accuracy
Precision
Reliability
Validity
Method limitation
A method limitation is any experimental design flaw or fault in the method that affects the accuracy of the results
must be identiifed and removed
Accuracy
Accuracy is how close a reading/measurement is to its true value
can be reduced by the presence of errors in an experiment
Systematic errors - how to reduce it
systematic errors that are repeated consistently every time the instrument is used or the method is followed - from faulty instruments of flaw in method
instruments should be relicalibrated
Random error
Unexpected environmental changes or incorrect use of equipment can produce random errors
are diff each time the experiment occurs
Precision
how similar repeat readings/measurements are to each other
Readings that are tightly clustered together (a small range) are described as precise
more decimal places means more precise
Reliability ensured by
repeating experiment
Instruction should have all the required details
Precision vs accuracy
Precision refers to the ability to take multiple readings that are close to each other, whereas accuracy is the closeness of those measurements to the true value.
How to process (occurs before analysis) qualitive and quanatative results
qualitive - observations can be anaylsed (compared to a standard)
quantative - using math skills (statistical tests, work out means and rates, standard devi etc) and presented in graph form
Reduce random error
Repeat measurements several times and calculate an average from them
Uncertainty
Uncertainty is the amount of error your measurements might contain, Results will always contain some error so there will always be some uncertainity in readings
Why is there always uncertainty
because the accuracy and precision of the apparatus being used is limited
margins of error
on glass of apparatus, used to calc percentage error
The gas syringe may only give readings to the nearest 1 cm3
The gas syringe has a margin of error of ± 0.05 cm3
A ‘±’ sign tells you the range in which the true value lies
The real volume produced could be up to 0.05 cm3 smaller or larger
How to calc percentage error
percentage error = (uncertainty value ÷ your measurement) x 100
Resolution
s the smallest change in the quantity being measured of a measuring instrument that gives a perceptible change in the reading
Smaller measuring instruments have
higher resolution scales due to the smaller graduation so have smaller margin of error
For example, measuring 5 cm3 of a liquid using a 500 cm3 measuring cylinder would be very difficult. A 10cm3 measuring cylinder would be a more appropriate choice as the measuring scale is of a higher resolution
In an enzyme rate experiment involving the breakdown of hydrogen peroxide by catalase, a student recorded that 10 cm3 of oxygen was produced in 5.245 seconds. The student measured this using a stopwatch that counted in milliseconds. Calculate the percentage error of the stopwatch measurements.
Answer:
Step 1: Calculate the uncertainty value
The stopwatch can measure to the nearest millisecond (0.001 seconds)
This means the actual time taken could be up to 0.0005 seconds shorter or longer than this
This means stopwatch measurements have an uncertainty value of ± 0.0005 s
Step 2: Calculate the percentage error of the student’s measurement of 5.245 seconds
Percentage error = (uncertainty value ÷ your measurement) x 100
Percentage error = (0.0005 ÷ 5.245) x 100
Percentage error = 0.000095 x 100
Percentage error = 0.0095% or 0.01%
SD
Standard deviation is a measure of the spread or dispersion of data around the mean
Size of SD
A small standard deviation indicates that the results lie close to the mean (less variation)
Large standard deviation indicates that the results are more spread out

If there is an overlap between the standard deviations
then it can be said that two sets of results are not significantly different
.69 (+0.02)
0.67-0.71
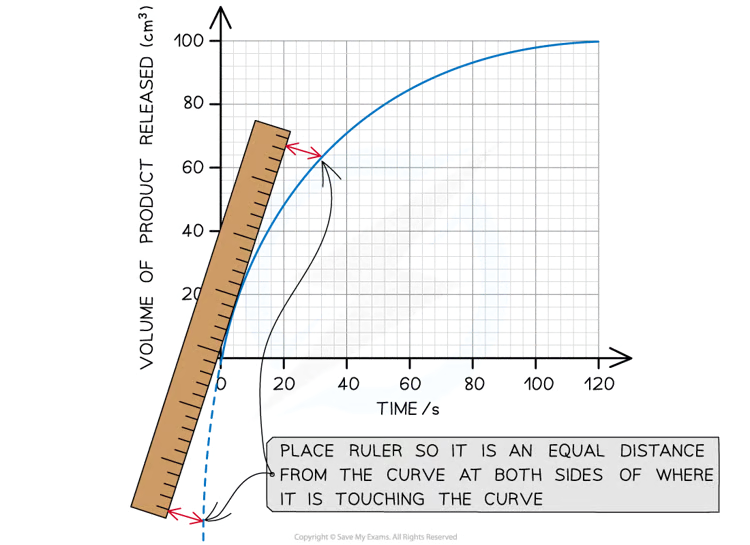
Using a tangent to find the initial rate of a reaction
bc enzyme reactions make non linear graphs
draw the estimated straight line
Gradient of tangent= change in y divided by change in x
If the percentage error is too high
any conclusions may be rejected or further testing may be needed to reduce percentage error
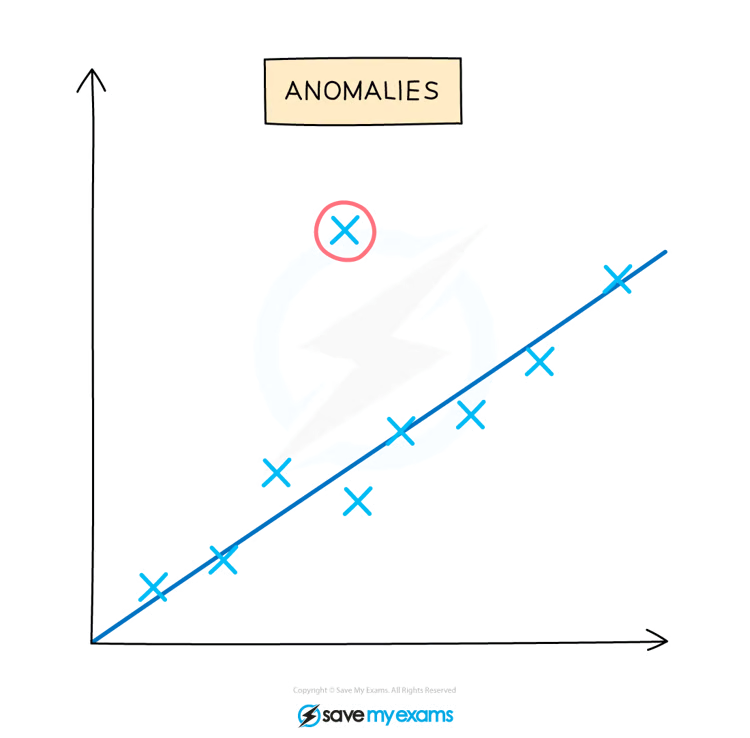
Anomalies
Experimental error will affect results and produce anamolies.
When should anamolies be identified
These anomalies should be identified during the evaluation of results and before drawing conclusions
How can anamolies be identified
Anomalies can be identified by looking for results or data points on a graph that don't fit with the trend or with other replicates carried out during the experiment
These anomalous results will show a larger difference from the mean than the rest of the results
ructure for 6-mark planning questions:
Aim/Hypothesis
Independent, dependent, control variables
Step-by-step method (mention repeats + equipment)
How to measure results
How to ensure reliability (repeats/means)
Risk assessment
“Describe how you could investigate the effect of temperature on catalase activity.
IV: Temperature (°C)
DV: Volume of oxygen produced (cm³/min)
CV: pH, enzyme concentration, substrate concentration
Method: Water bath, gas syringe, repeats
Safety: Wear goggles (hydrogen peroxide irritant)
Find Sd
find mean, subtract mean from each value, sqaure the values, add them add, then do s= that sqaured divided by n-1
Find uncertanity
+ half the smallest scale divisin
hat a p-value < 0.05 means you the null hypothesis
reject
Student’s t-test
Compare two means
Chi-squared test (χ²)
Compare observed vs expected frequencies
All types of errors, meaning
Term | Meaning | Example |
|---|---|---|
Accuracy | How close results are to the true value | Using a colorimeter instead of judging by eye |
Precision | How close repeated results are to each other | Using apparatus with smaller scale divisions |
Reliability | Whether results are consistent and reproducible | Repeating experiment and calculating mean |
Reproducibility
Different person or equipment, same trend
percent change formula
((new - original)/original) × 100 |