Hazards
1/24
There's no tags or description
Looks like no tags are added yet.
Name | Mastery | Learn | Test | Matching | Spaced | Call with Kai |
|---|
No analytics yet
Send a link to your students to track their progress
25 Terms
Natural event
Events that occur as a result of natural processes of the Earth.
Hazard
The threat of substantial loss of life, substantial impact upon life or damage to property, socioeconomic disruption & environmental degradation that can be caused by an event (these can be caused by human actions or naturally occuring).
Natural hazard
An event which is perceived to be a threat to people, the built environment & the natural environment (occur in the physical environments of the atmosphere, lithosphere & hydrosphere).
Disaster
Occurs as a result of the hazard involving enormous impacts on people or property - a major natural hazard event.
Criteria (at least one met):
10+ people killed
100+ people affected
State of emergency declared by government
Request by government for international assistance
3 Types of Hazard
Geophysical Hazards: driven by Earth’s own internal energy sources.
Atmospheric Hazards: driven by atmospheric processes.
Hydrological Hazards: driven by water bodies, mainly oceans.
Hazard Perception
The way in which someone understands/interprets a hazard.
Risk (definition)
The exposure of people, their possessions & the built environment to a hazardous event.
Risk (formula)
Risk = (Frequency/Magnitude of hazard x Level of Vulnerability)/Capacity of Population to Cope
Factors affecting Hazard Vulnerability
Location (close to hazard origin e.g. Pacific Ring of Fire)
Wealth (low = forced to live in hazard-vulnerable areas without suitable building materials)
Level of technology
Education
Urbanisation (mainly LICs: forces poor into high-risk urban areas, vulnerability increasing as unsustainable development = poor land use/degradation)
Person (very young/old = dependent populations, women more vulnerable)
Changing risk (rising sea levels/deforestation)
Cost vs Benefits (e.g. fertile soils)
Class-quake
Hazards that are unequal in the way that they affect people
Capacity of Population to Cope
Ability for a community to absorb & recover from a hazard
Fatalism
An acceptance that hazards are natural events that we can do little to control & losses have to be accepted
Risk sharing
Idea that loss from natural hazards can be modified using aid (sharing the level of risk between the affected countries and those offering aid)
Integrated risk management
Considering social, economic, political factors involved in risk analysis to minimise damage/disrupction
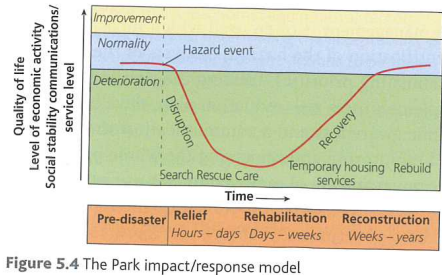
3-Stages Park Model (1991) (incl. factors affecting disruption & defining stages)
(bear in mind QoL may also increase due to a hazard in the long-term)
Type of hazard
Intensity/magnitude
Immediate environment
Infrastructure
Relief: immediate response of aid e.g. medical attention, rescue services, overall care (few hours to several days)
Rehabilitation: people try to return to normal by providing food, water, shelter for most affected (few days to weeks)
Reconstruction: infrastructure/property reconstructed & crops regrown, people use experience for better response to next hazard (weeks to several years)
5-Stages Park Model: additional 2 stages
Preparation: modifying cause/event
Hazard event: QoL dramatically deteriorates & people respond with protection
Hazard Management Cycle
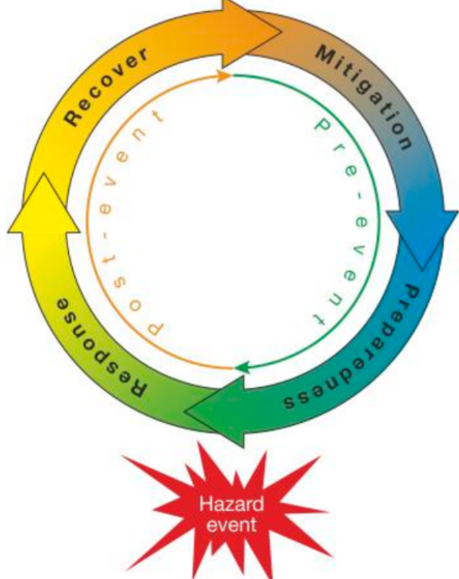
Preparedness: increases in areas of high risk
Evaluating Park Model
Strengths:
Charts the stages (QoL) following disaster
QoL is clear indicator of the impact of hazard
Can clearly visualise impact
Shows clearly level of normality, impact of hazard & impact of recover on QoL
Useful for understanding how prepared a community was & how successful it has been in response
Models can be used to compare events to understand what factors worsen impact
Clearly shows rate of recovery
Very versatile (can be applied to many hazards)
Allows for disaster planners to prepare for normal progression through a disaster event
Includes temporal dimension
Weaknesses:
No quantitative data (e.g. death toll)
Doesn’t show what was done before event to help mitigate
Can’t show when a country gets hit by another hazard whilst still recovering from an initial event
Can’t show when a hazard impacts multiple locations
Might not show full picture of events
Evaluation of Hazard Management Cycle
Strengths:
Focus on management of hazard (before & after event)
Can be used to speed up recovery from events by providing a model of action pre/post-event
4 stage sequenced framework for managing hazards
Clear mitigation stage
Cyclical (ongoing) modal
Weaknesses (* = most impactful):
*Doesn’t refer to QoL/speed of response
More basic than Park model
Less visually representative
Features of Crust
Continental: thicker, less dense, older/permanent, mainly granite
Oceanic: thinner, denser, newer, recycled via subduction, mainly basalt
Thickness:
Continental: 30-40 km thick below continents, <70 in highest mountain ranges
Oceanic: 6-10 km thick
Features of Mantle
2,900 km
Elements: silicate rocks rich in magnesium/iron
Asthenosphere: plastic & moves very slowly due to high pressure/temperatures > convection currents > plate movement
Lower mantle: hotter/denser than upper mantle, intense pressure keeps lower mantle solid
Features of Core
Outer Core: semi-molten (liquid iron/nickel), responsible for Earth’s magnetic field
Inner Core (>5,000*C): solid ball (iron) due to extreme pressures
Primordial heat/radio. decay > hottest part of Earth > drives tectonic activity
Diameter: 1,200 km
The boundary between crust & mantle
Mohorovičić discontinuity
The boundary between lithosphere & asthenosphere
Isotherm (1,300*C)
Evidence of Continental Drift:
- Geological: jigsaw shape of continental shelves & similar rock sequences in areas now far apart
- Biological: similar fossils found in areas that are now far apart
- Climatological: location of natural resources & glacial markings > some areas have changed drastically