CLEP College Mathematics
1/136
There's no tags or description
Looks like no tags are added yet.
Name | Mastery | Learn | Test | Matching | Spaced | Call with Kai |
|---|
No analytics yet
Send a link to your students to track their progress
137 Terms
quadratic formula
-b ± √b² - 4ac / 2a
how to tell if a plot is a function
vertical line test; if it only intersects 1 point, then its a function. if it intersects multiple, then it is not
x/0
undefined
e =
2.71
axay =
ax+y
axbx =
(ab)x
(ax)y =
axy
a-x =
1/ax
ax / ay =
ax-y
(a/b)x =
ax / bx
y = loga(x) =
ay = x
loga(xy) =
loga(x) + loga(y)
loga(x/y) =
loga(x) - loga(y)
loga(xy) =
y loga(x)
loga(1) =
0
loga(a) =
1
loga(0) =
undefined
domain
what x can be, from a starting number to an end number
range of a function
is what f(x) can be, from a starting number to an end number
√-x =
undefined
“( )” meaning
endpoint is not included in set
infinity signs (-∞,∞) always use parentheses
represented with an OPEN dot
“[ ]” meaning
endpoint is included in set
represented with a CLOSED dot
(x, ∞) =
all numbers greater than x
(-∞, x) =
all numbers less than x
(-∞,∞) =
all real numbers
f(x) → f(x + a)
shifts the function to the left by a
f(x) → f(x - a)
shifts the function to the right by a
f(x) → f(x) + b
shifts the function up by b
f(x) → f(x) - b
shifts the function down by b
f(x) → f(-x)
reflects the function over the y axis; left/right
f(x) → -f(x)
reflects the function over the x axis; up/down
f(x) → -f(-x)
reflects the function on both the x and y axis
how to know if a function is even
when f(x) = f(-x)
how to know if a function is odd
when f(-x) = -f(x)
how to tell if a plot is a inverse function
the horizontal line test; if it only intersects 1 point, then its a inverse function. if it intersects multiple, then it is not
how do you find an inverse of a function
switch x and y, then solve for y
f(x) = x → y = x
linear function formula
y = mx + b
ex; a library has 8,000 books and is adding 500 more books each year
500x + 8,000
exponential function
f(x) = ax · b
ex; a bank account starts with $10, every month, the amount gets tripled
3x · 10
given n, how many groups of k possible, if order doesn’t matter
(n / k) = n! / k! (n-k)!
“choose”
“combinations”
“group”
“set up”
given n, how many groups of k possible, if order does matter
n! / (n-k)!
“arrange”
“permutation”
“line up”
“sequence”
how many combinations can you make with 1 appetizer (a options), 1 main dish (b options), and 1 dessert (c options)
multiply a × b × c
4!
4 × 3 × 2 × 1 = 24
all probabilities have a value from
0-1
A ∪ B
The union of A and B; the event that either A or B occurs
A ∩ B
The intersection of A and B; the event that both A and B occur
Ac
The complement of A; the event that A does not occur
A / B
The difference between sets; the set of elements that are in A, but not B
P (A ∪ B) =
P(A) + P(B) - P(A ∩ B)
P(A ∩ B) =
P(A) · P(B)
in probability, the events A and B are independent if
what happens to A doesn’t affect B and vice versa
P(A|B)
The conditional probability of A on B; given the information about event B, what’s the probability of A occurring
P(A|B) =
P(A ∩ B) / P(B)
P(Ac) =
1 - P(A)
mean
the average; add all data, divide by the amount of data
median
the middle point; sort data, and find middle number. if theres an even number of data points, find the mean of the 2 middle numbers
mode
the number that appears most often
range
the largest value - the smallest value
Inner quartile range
median of the 75th percentile (2nd half) - median of the 25th percentile (1st half); find the median of the entire set, then find the median of the 2 halves
Variance of data
1/n (xk - m)²
how much the values in a dataset deviate from the average
n = number of data points, xk = data point, m = mean
Standard deviation of data
√1/n (xk - m)² (square root of variance)
how dispersed the data is in relation to the mean
Normal distribution
a probability distribution that appears as a "bell curve" when graphed
low standard deviation
most of the points are very close to the mean; thin tails; cluster / high concentration
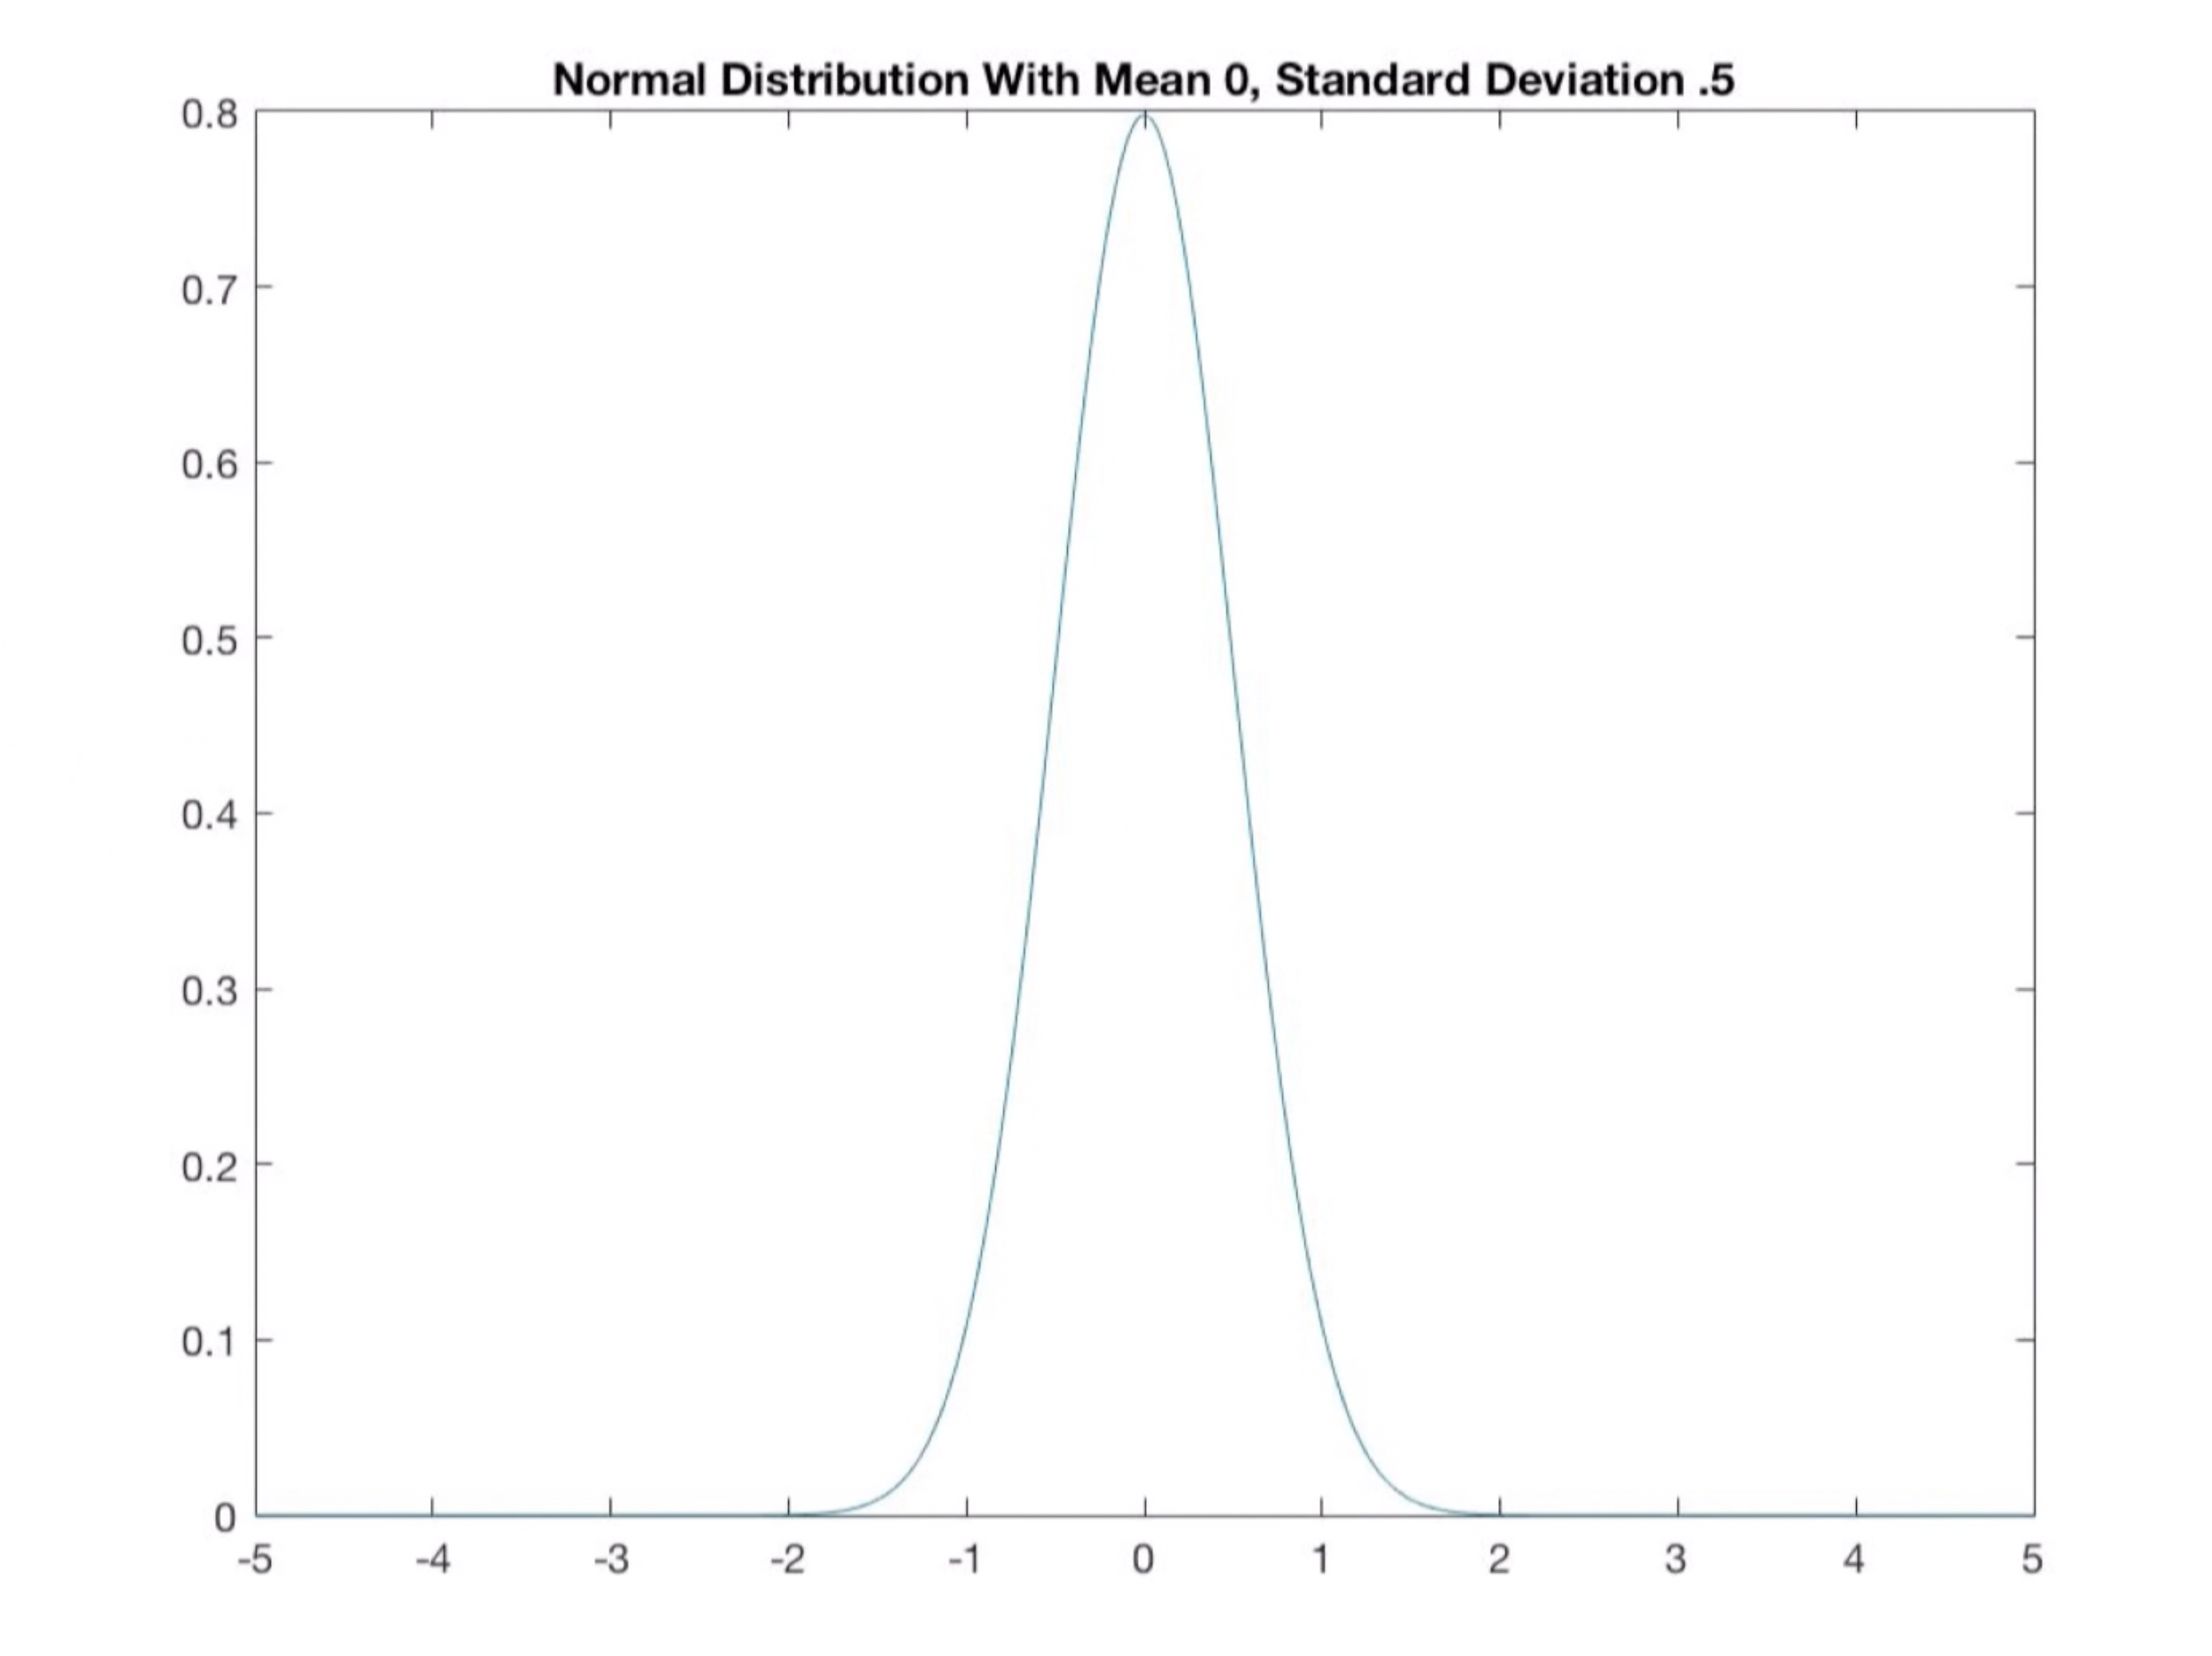
low standard deviation
high standard deviation
most of the points are spread out relative to the mean; fat tails; diffused / low concentration
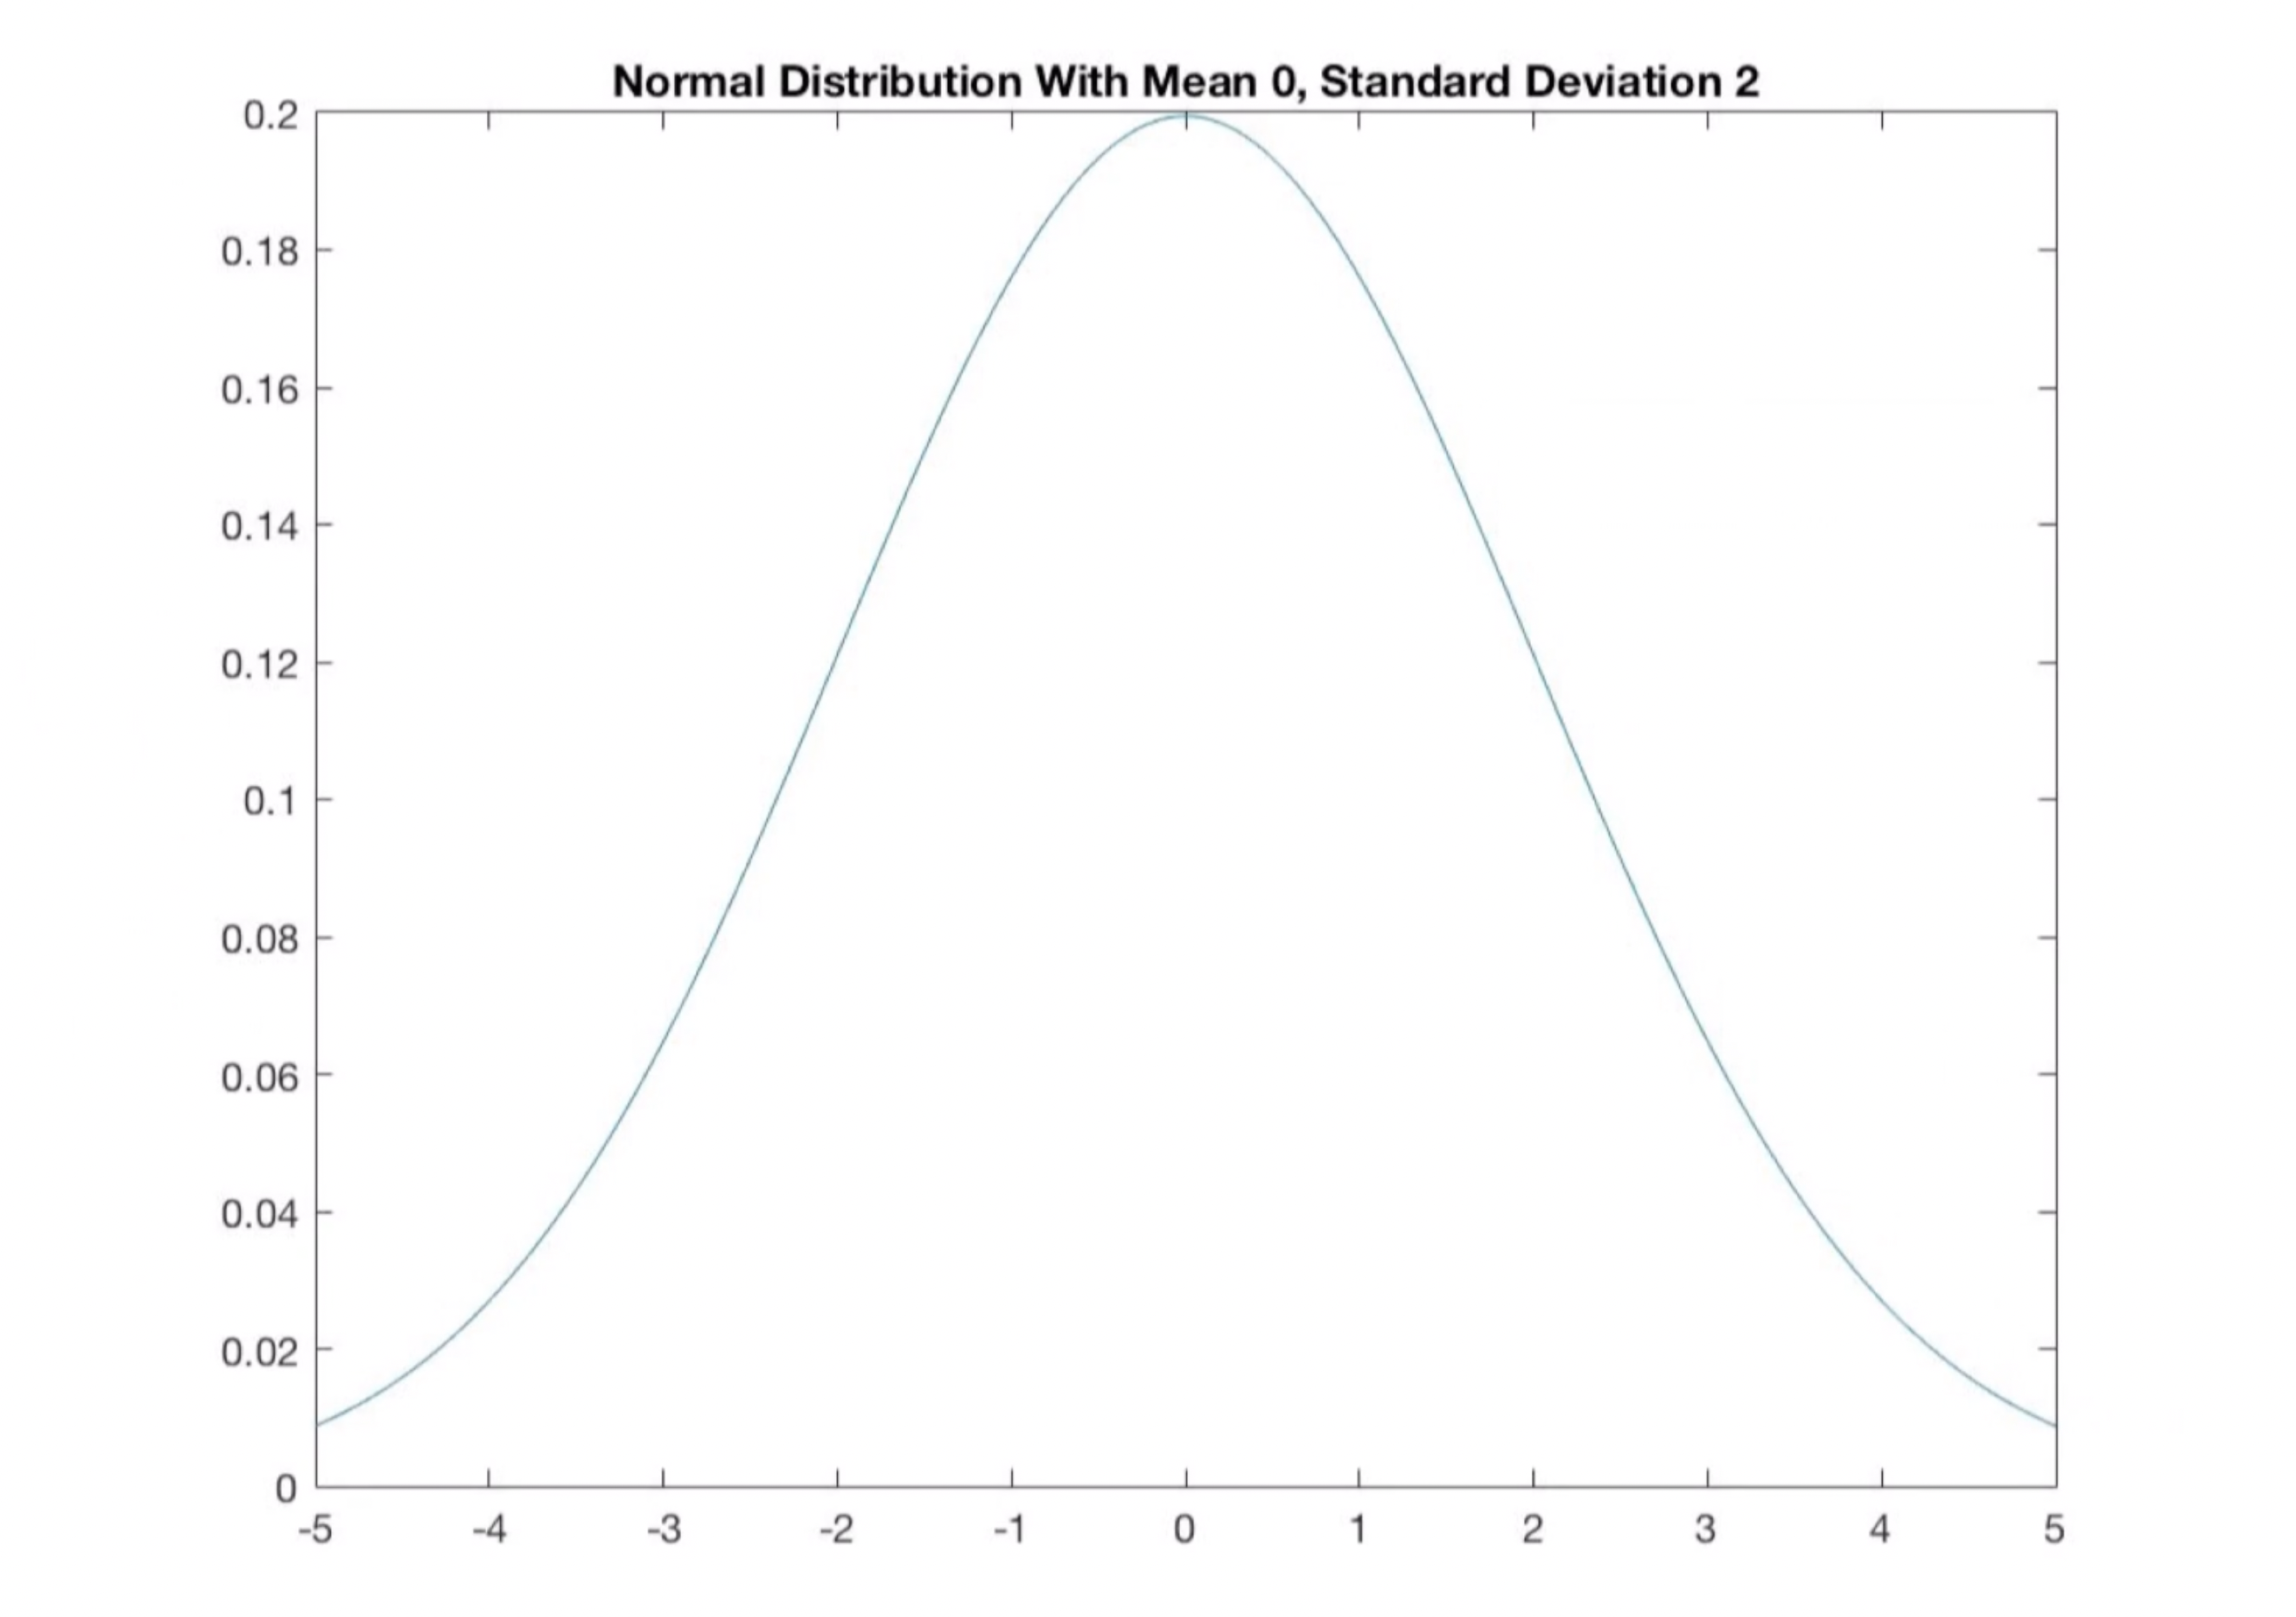
high standard deviation
Positive regression line slope
(line goes up) - positive correlation between the two variables; if one variable increases, the other will also increase
Negative regression line slope
(line goes down) - negative correlation between the two variables; if one variable increases, the other will decrease
Nonlinear association line slope
Unable to draw a line through the data; usually a curve
No association line slope
No clear pattern
effective rate
tax paid / principal amount
the actual percentage of income that an individual or corporation pays in taxes
Relative Mark up/down
Total Mark up/down / Original Price
the increase/decrease in price of a product or service compared to its original cost or cost of goods sold
simple interest
I = P x R x T
I = interest, P = principal amount, R = rate of interest, T = time
Compound Interest
A = P (1 + r/n)nt
n = compounding rate; how many times the interest on the interest is collected
ex; yearly, n = 1. daily, n = 365, quarterly, n = 1
Compounding continuously
A = Pert
Effective Annual Yield
EAY = (1 + r/n)n - 1
Parallel lines
lines that never intersect
how to know if 2 lines (y = m1 + b1, and y = m2 + b2) are parallel
if m1 = m2
Perpendicular lines
lines that intersect at a 90° angle
how to know if 2 lines (y = m1 + b1, and y = m2 + b2) are perpendicular
if m1 = -1/m2
perimeter of a triangle
a + b + c
area of a triangle
½ bh
angles of a triangle sum up to
180°
Equilateral triangle
triangle with equal length on all sides; same angles of 60°
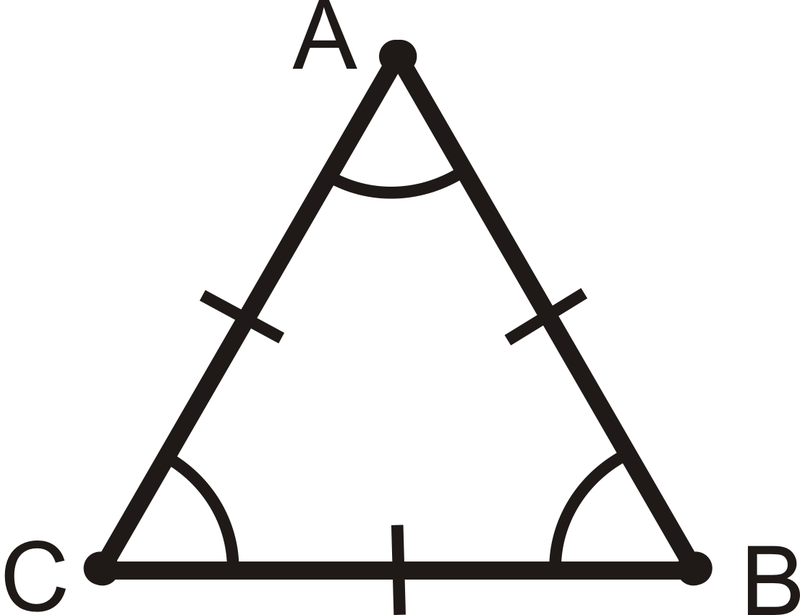
equilateral triangle
Isosceles triangle
triangle with equal length on 2 sides; 2 of the same angles
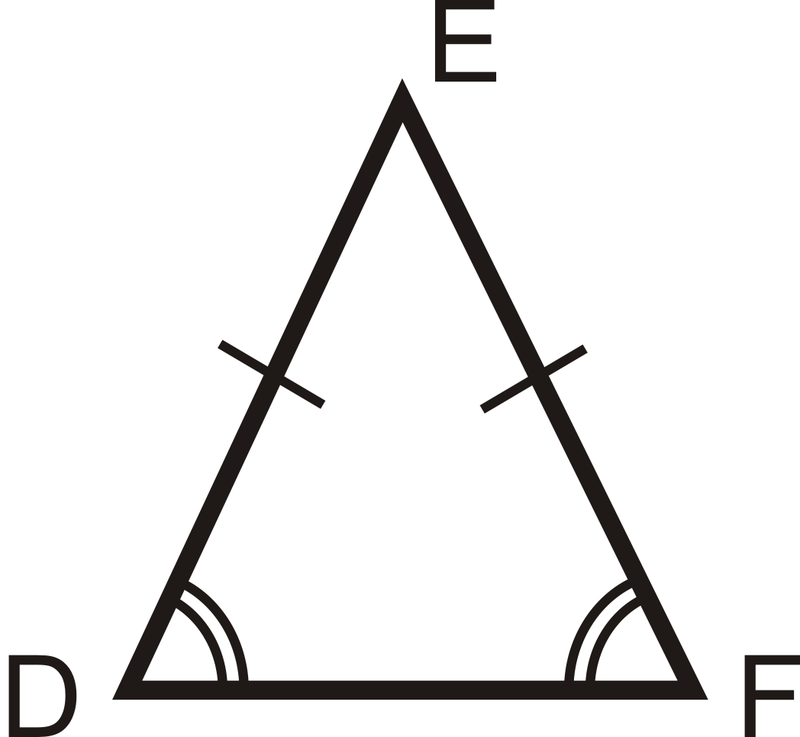
Isosceles triangle
Scalene triangle
triangle with all different lengths; all different angles
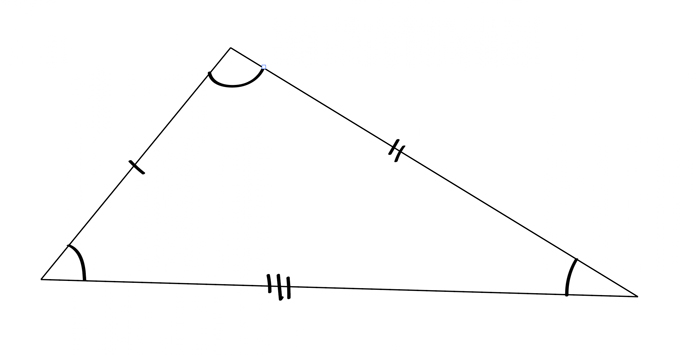
Scalene triangle
pythagorean theorem
a² + b² = c²
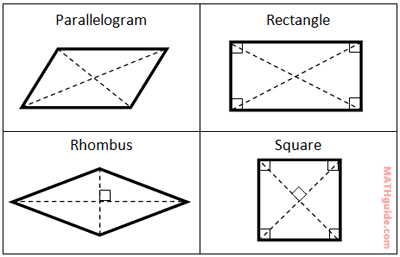
Parallelograms
quadrilaterals with opposite sides parallel
area of a parallelogram
Area = BH
Trapezoids
quadrilaterals with one pair of opposite sides parallel
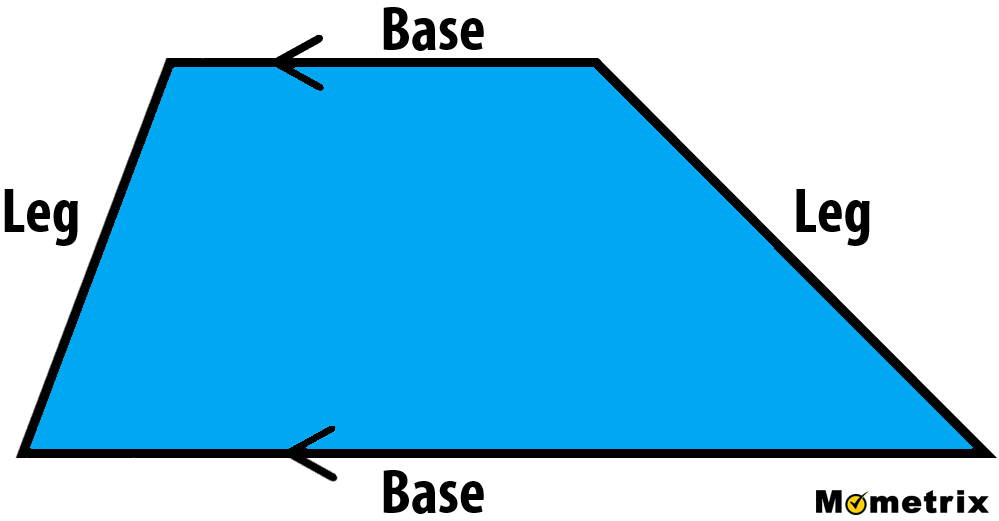

Trapezoid
area of a trapezoid
Area = (B1 + B2 / 2) x H
Radius
R = D/2
distance from the center
area of a circle
Area = πr²
π =
3.14
Circumference
C = 2πr
“length” of the circle (perimeter)
Diameter
D = 2r
the distance of a line going across the circle through the center
To find the area of one piece of a circle
Area of arc = 𝚹 / 360° x πr²