Psycstat #3
1/53
There's no tags or description
Looks like no tags are added yet.
Name | Mastery | Learn | Test | Matching | Spaced | Call with Kai |
|---|
No analytics yet
Send a link to your students to track their progress
54 Terms
Repeated-Measures Designs
Evaluates mean diff between two measurements from one sample
AKA within-subject, related-samples, or dependent-samples dependent
calculations done with sample of difference scores
Advantage of Repeated-Measures Designs
fewer participants than independent measures design
can see changes over time
ex: learning or development
disadvantages of repeated-measures designs
testing effects
floor & ceiling effects
testing effects
exposure to first condition may influence scores in second condition
ex: practice on an IQ test in first condition may cause improved performance in second condition
floor effects
when individual’s score is so low in condition 1, they have nowhere to go but in condition 2
ceiling effects
when individual has such as high score in condition 1
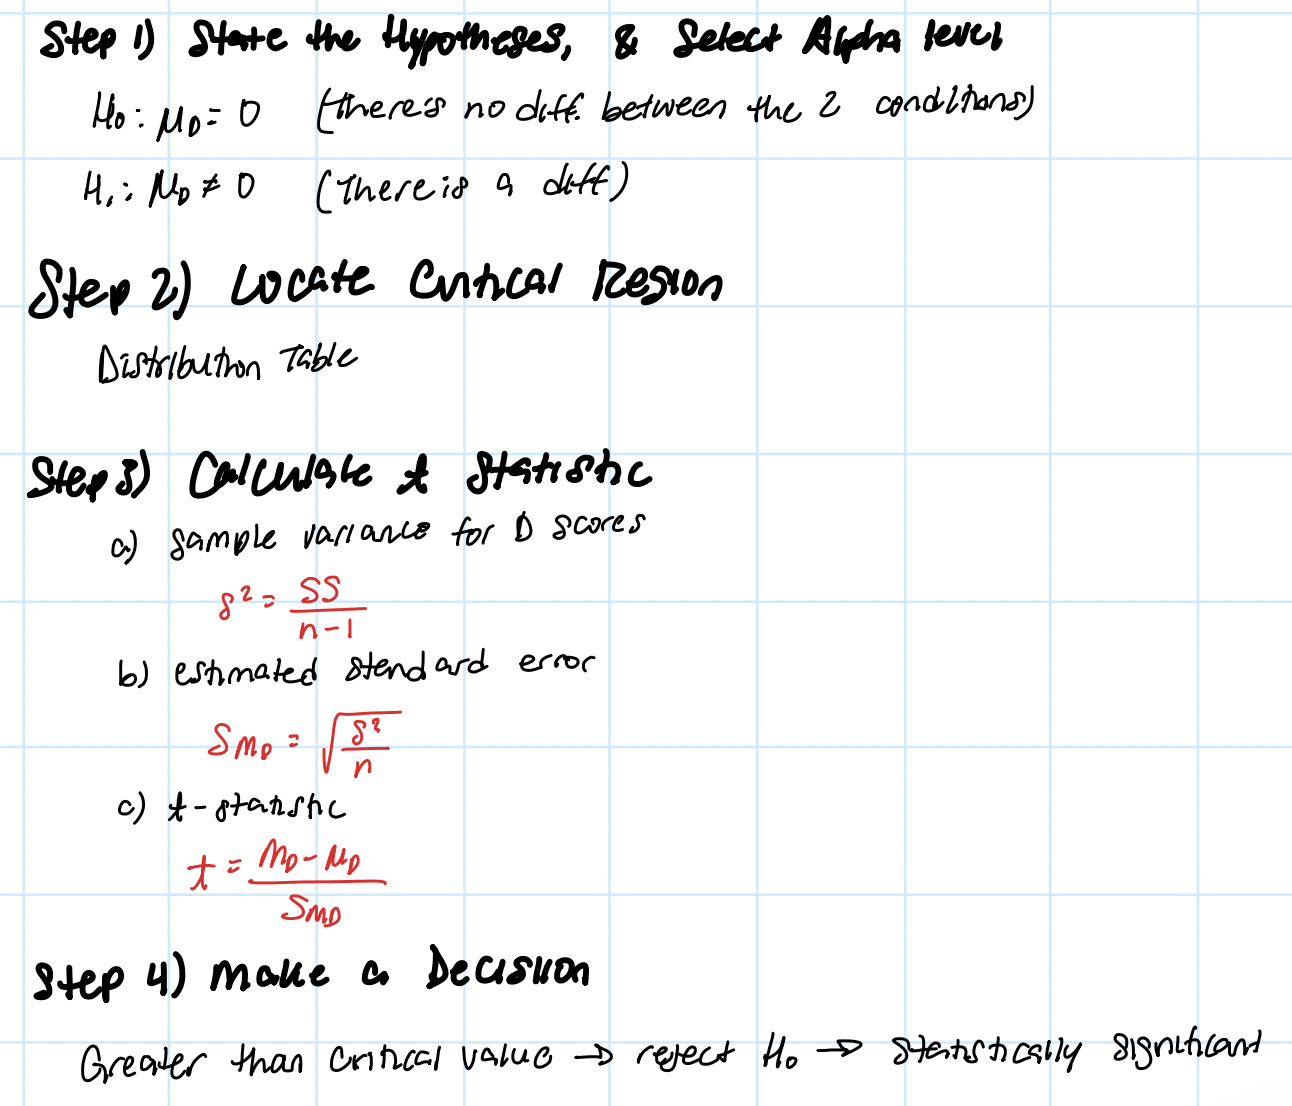
repeated measures t-test Null Hypothesis
H0: μD = 0
two tailed
no consistent or systematic diff between two conditions
repeated measures t-test Alt. Hypothesis
H1: μD ≠ 0
systematic diff. between conditions produces a non-zero mean diff.
differences scores (D)
D = X2 -X1
finding critical value using df
df = n - 1
calculating repeated-measures t-stat
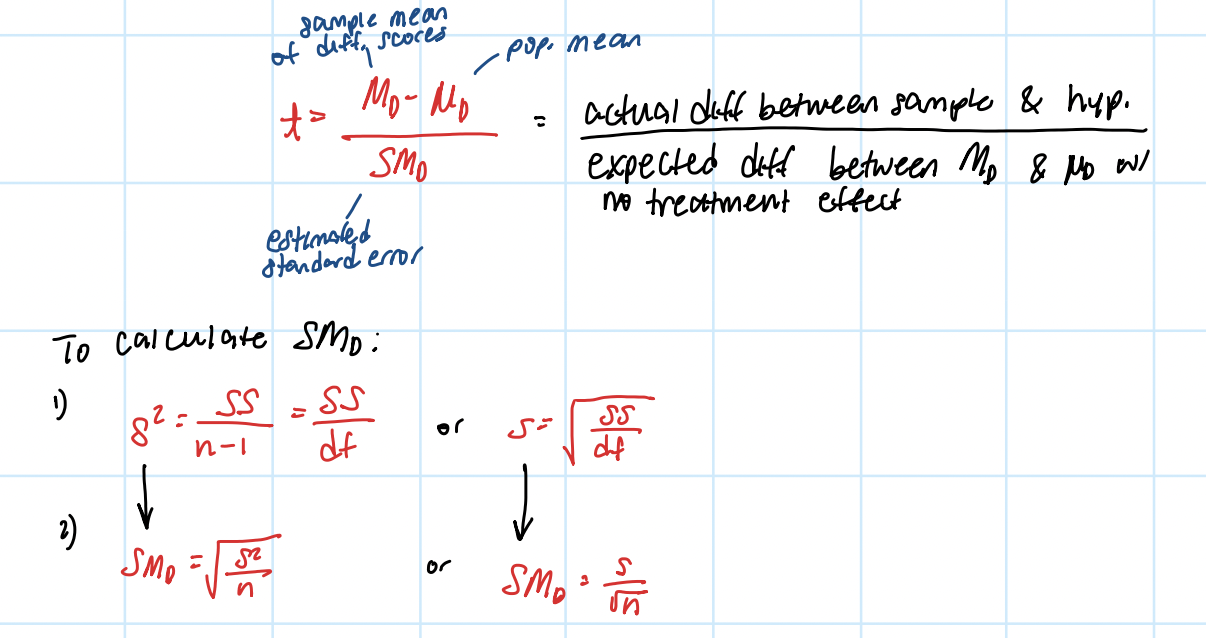
hypothesis tests for repeated-measures design
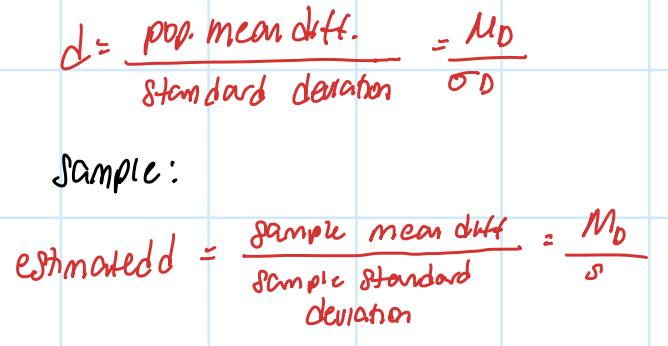
cohen’s d
standardized mean diff. between treatments
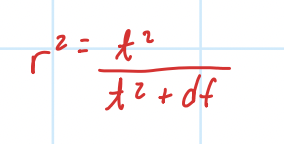
r²
percentage of variance accounted for
effect of variance on measures of effect size (cohen’s d & r²)
larger variance → smaller cohen’s d & r²
sample size → no effect on cohen’s d & small influence on r²
SPSS output for repeated measures t-test
sig. (p-val) < .05 , reject null hyp.
Repeated Measures vs. Independent Measures
repeated measures - one sample w/ same individuals in both treatments, fewer subjects, eliminates individual diff., higher liklihood of detecting real treatment effect
independent measures design - two separate samples (one in each treatment), more subjects, every score represents diff person
ANOVA
hypothesis testing procedure used to evaluate mean diff. between two or more populations
strength of ANOVA over multiple t-tests
tests for 2+ groups at once
avoids Type I error inflation (multiple t-tests)
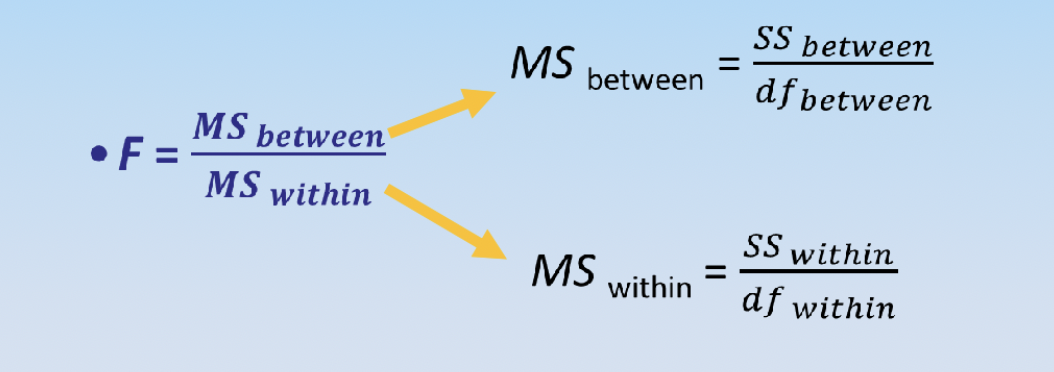
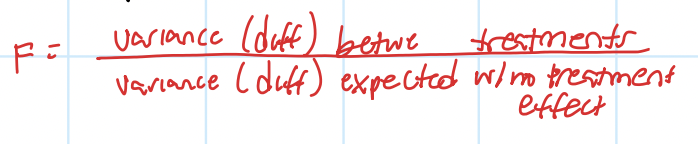
F-ratio logic
F-ratio: ratio of sample’s systematic variance to its random variance
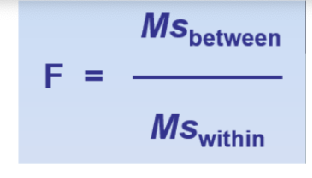
MSbetween
mean differences between samples (treatment effects)
(Signal/Systematic variability)
from effects of IV and/or chance/sampling error
ex: diff mean levels
MSwithin
diff expected by chance (w/o treatment effects_
(Noise/Random variability)
from random chance or sampling
ex: variability for people who got 5 hours of tutoring
null hypothesis for one way ANOVA
H0: μ1 = μ2 = μ3
all groups are equal
no diff between levels (AKA groups)
F-ratio ~ 1.00
no significant effect of IV
alt. hypothesis for one-way ANOVA
H1: μ1 ≠ μ2
at least one diff mean
large F-ratio
reject null & conclude significance
all hypothesis in ANOVA are
non-directional
can never have negative F
Critical region (One-Way ANOVA)
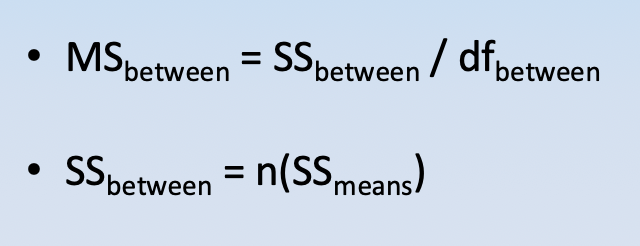
dfbetween = k - 1
columns
dfwithin = N - K
rows
F-ratio (One-way ANOVA)
SStotal
provided
G
grand mean
SSwithin
ΣSS inside each condition
SSbetween
SStotal - SSwithin
SPSS output for ANOVA
if sig <.05 , proceed to hoc tests
making a decision for One-Way ANOVA
compare F-value to critical value, if F more extreme → reject H0
ANOVA simply states that
a difference exists
doesn’t indicate which levels are different
post-hoc tests
determine exactly which groups are diff. & which aren’t
after ANOVA where H0 rejected
compares treatments, two at a time, to test mean diff. while correcting for concerns about experiment-wise Type I error inflation
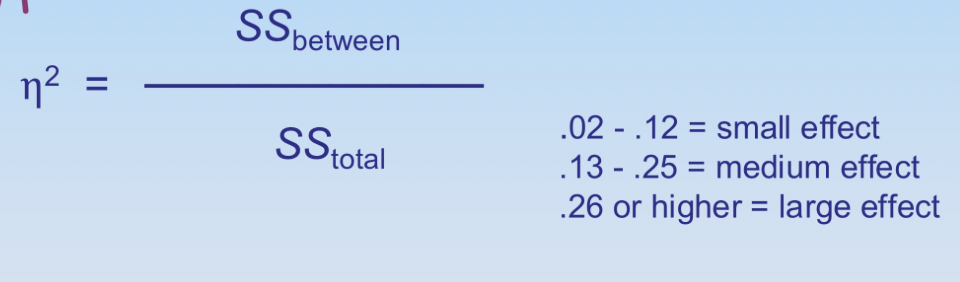
effect size
η² (eta squared)
two-factor ANOVA
examines effects of 2+ IV or quasi-IV on dependent variable
separate Hyp tests for same data
seperate F-ratios
main effect
mean diff. among levels of a factor
ex: flashcards & age - Main effect of B: Do young students perform better than older students regardless of method?
interaction
“extra” mean diff. not explained by main effects
occurs when mean diff. between cells (individual treatment) are diff. from predicted from overall main effects of factor
non-parallel lines on graph
Combined impact of A and B
ex: Does method effectiveness change by age group?
null hypothesis Two Factor ANOVA
h0: no interaction between factors A & B.
mean diff between treatment conditions explained by main effects of two factors
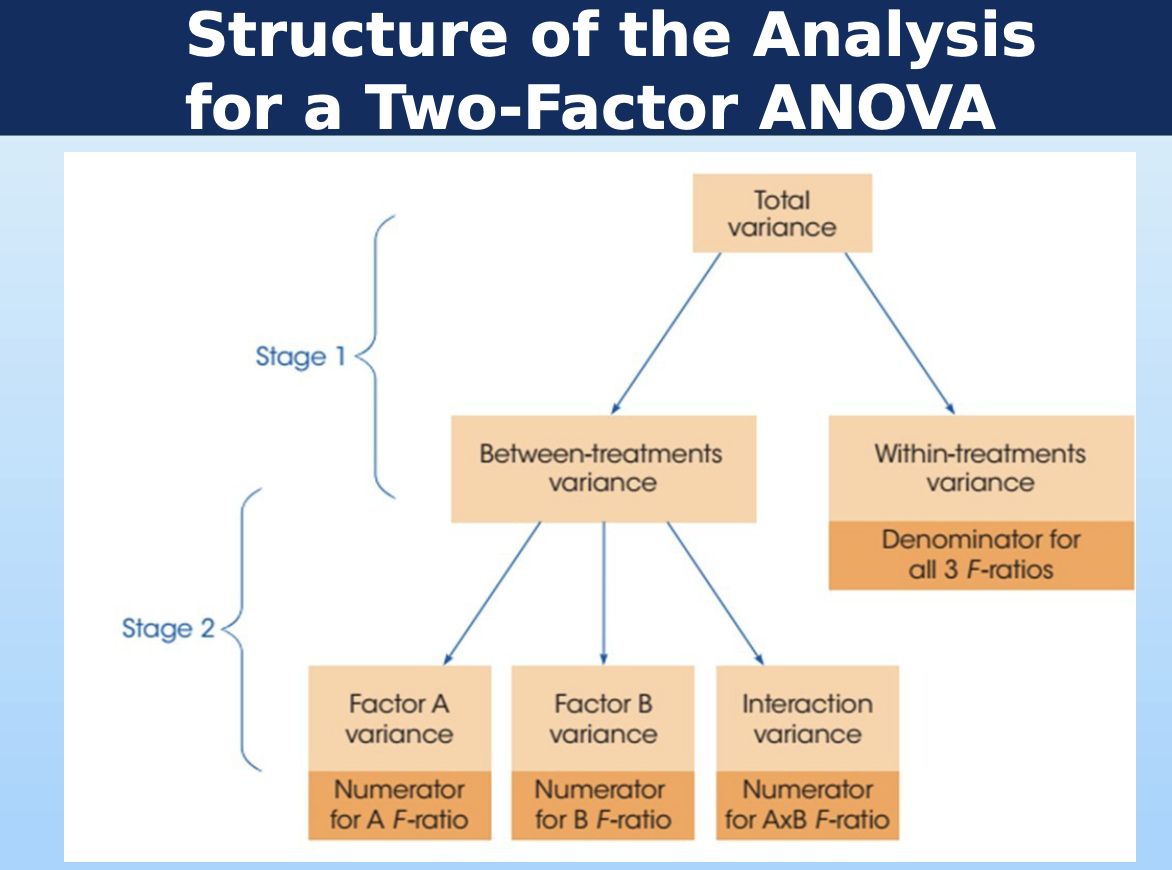
structure of two-factor ANOVA
alt. hypothesis Two-factor ANOVA
h1: interaction between factors
mean diff. between treatment conditions not predicted from overall main effects of two factors
SStotal
Σ(X - G)²
will be provided
SSwithin
ΣSS inside each condition (AKA cell)
SSbetween
SStotal - SSwithin
SSA
SSB
SSAxB
SSBetween - SSA - SSB
extent to which cells are diff. from total/grand
higher if main effects don’t explain/predict cell means
F-ratio (Two-Factor ANOVA)
Significant interaction (Two-Factor ANOVA)
main effect becomes meaningless
Non significant interaction (Two-Factor ANOVA)
interpret main effects as normally
Simple Main effects
impact of one factor on dependent variable at specific level of other factor
specifics of interactions
description - both of the IVs and DV
Reporting results of Two-Factor ANOVA (each test include)
F (df, p-value)
F greater than critical value → p < alpha value (a = .05) → effect is significant (reject null hyp.)
interpreting results of two-factor ANOVA
main effects of factor A & factor B & sig
significant if F > crit. val
A x B interaction
significant if F > crit. val
do indepdent effects (main effects) explain data → NO if sig.