Unit 3: National Income and Price Determination (Princeton Review AP Macroeconomics 2023 [21st Edition])
1/87
There's no tags or description
Looks like no tags are added yet.
Name | Mastery | Learn | Test | Matching | Spaced |
|---|
No study sessions yet.
88 Terms
Aggregate Demand
the total demand for good and services in an economy
The AD curve illustrates…
inflation, unemployment, relative value of national currency
The AD curve is the relationship between…
Price level and real GDP
The AD curve reflects changes in the demand for…
all goods and services
Price and GDP relationship type
indirect
For AD, when price decreases, GDP…
increases
For AD, when price increases, GDP…
decreases
The indirect relationship between price level and GDP are determined by which three primary effects?
the foreign trade effect, the interest rate effect, and the real wealth (real balances) effect
The Foreign Trade Effect
when the price level in one country increases, the prices of imports from other countries become relatively less expensive
How does the foreign trade effect impact imports and exports in a country when price level increases?
The country buys more imported goods, and sells fewer exports.
The Interest Rate Effect
when price level increases, purchasing power decreases, leading to higher interest rates and reduced investment
An increase in price level…
increases interest rates and decreases real GDP
Why does an increase in price level increase interest rates and decrease real GDP?
An increase in price level leads to a decrease in the purchasing power of money, causing lenders to demand higher interest rates to compensate for inflation. This results in reduced borrowing and investment, ultimately decreasing real GDP.
A decrease in price level…
dcereases interest rates and increases real GDP
The Real Wealth (Real Balances) Effect
when the price level imcreases, the value of assets such as cash and checking account balances falls
Aggregate Demand Equation
AD = C + I + G + Xn
What does C represent in the aggregate demand equation?
consumption
What does I represent in the aggregate demand equation?
investment (business spending)
What does G represent in the aggregate demand equation?
government purchases
What does Xn represent in the aggregate demand equation?
net exports
Net Export Equation
(X - M) exports minus imports
Indirect Relationship between Price Level and Real GDP acronym
Friends (Foreign Trade Effect) Inspire (Interest Rate Effect) Relationships (Real Wealth Effect)
The AD curve shifts to the right due to…
consumption increases, investment increases, government carries out expansionary policy, or net exports increase
The AD curve shifts to the left due to…
consumption decreases, investment decreases, government carries out contractionary policy, or net exports decrease
Consumption increases due to…
expectations of inflation or shrtages in the future, increased income or wealth, optimism about jobs and income
Investment increases due to…
interest rates dropping, investors gaining optimism
Government carries out expansionary policy means…
increased spending, increased money supply, and/or decreasing taxes
Government carries out contractionary policy means…
decreased spending, decreased money supply, and/or increasing taxes
Net exports increase due to…
the exchange rate decreases (imports decrease), foeign income increases (exports increase)
SRAS curve horizontal represents
depression or Keynesian stage
SRAS curve upward sloping represents
intermediate stage
SRAS curve vertical represents
classical stage
During a depression, firms have _______ inventories
large
Why is the depression or Keynesian stage on the SRAS curve horizontal?
large inventories mean firms will be glad to sell more at an existing price level and workers being plentiful means there is less upward pressure on prices or wages
If a firm sees the price of its product going up and does not realize that all prices are increasing at the same time, the firm might think the relative value of its good has _________ and may be fooled into producing ____
increased; more
If a firm sees the price of its product going down and does not realize that all prices are decreasing at the same time, the firm might think the relative value of its good has _________ and may be fooled into producing ____
decreased; less
The SRAS curve shifts in response to…
changes in input prices and availability, technology, public policy, and other macro disturbances
The SRAS curve shifts to the right due to…
inputs becoming cheaper, more productive, or more plentiful, government policies reducing production costs, or macro disturbances being absent
The SRAS curve shifts to the left due to…
inputs becoming expensive, less productive, or less plentiful, government policies increasing production costs, or macro disturbances like wars and natural disasters
Inputs becoming cheaper, more productive, or more plentiful is due to…
new discoveries of raw materials, increases in labor supply, decreases in wages or other input prices, improvements in education or training, decrease inflationary expectations, increased investment (more capital), technological advances, or predictable and beneficial weather conditions
Government policies reducing production costs is due to…
tax cuts, deregulation, reform in welfare or unemployment insurance programs
The LRAS curve is vertical because…
when price level increases, there is no incentive to produce more
Yf indicates
full employment on the LRAS curve
Yf and LRAS shift right due to…
increased skill levels, increased capital levels, improved technology, or increased resource availability
An inital negative demand shock decreases aggregate demand to the left, resulting in…
higher unemployment in the short run and shifting equilibrium to a lower output level and price level.
An inital positive demand shock increases aggregate demand to the right, resulting in…
less unemployment in the short run and shifting equilibrium to a higher output level and price level.
When the price level is above equilibrium, surpluses lead to price level…
decreasing
When the price level is below equilibrium, shortages lead to price level…
increasing
Inflation is a result of…
AS decreasing or AD increasing
When prices rise due to an increase in the costs of the factors of production, this is called…
cost-push inflation or supply-side inflation
Cost-push inflation pushes SRAS to the…
left
Stagflation
inflation is concurrent with relatively high unemployment and a reduction of GDP
Demand-pull inflation
AD shifts to the right relative to the AS curve
Demand-pull inflation pulls AD to the…
right
Creeping Inflation
inflation the remains steady for a long period of time at a low rate
Galloping Inflation
unsteady inflation that exceeds 10% per year and grows month after month
Hyperinflation
very rapid price increases in excess of 50% per year
Recessionary gaps are indicated by…
high unemployment and LRAS being right of equilibrium
Inflationary gaps are indicated by…
low unemployment and LRAS being left of equilibrium
Recessionary Gap Inequality
Ye < Yf
Full Employment Equation
Ye = Yf
Inflationary Gap Inequality
Ye > Yf
According to classical theory, the recessionary gap results in…
the surplus of workers will causes wages to fall, shifting AS to the right, lowering price level and increasing real GDP until equilibrium is at Yf
According to classical theory, the inflationary gap results in…
the shortage of workers will causes wages to rise, shifting AS to the left, increasing price level and decreasing real GDP until equilibrium is at Yf
Keynesian theory counters classical theory by stating…
wages are not flexible enough to respond quickly to inflation and recession, needing government to step in
Spending (Expenditure) Multiplier
the number by which the inital amount of new spending should be multiplied to find the total resulting increase in real GDP
How is the spending multiplier visualized?
an additional dollar of spending adds more than one dollar to real GDP because the initial dollar ends up in someone’s pocket as income, and that person will turn around and spend some of it, creating more income and spending (and the cycle goes on…)
MPC (Marginal Propensity to Consume)
the amount by which consumption increases for every additional dollar of real income
MPC Formula

MPS Formula
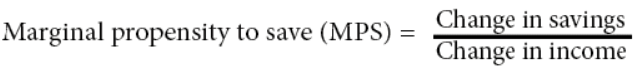
MPS (Marginal Propensity to Save)
the fraction of each additional dollar of income that is saved
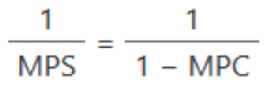
MPC + MPS = 1
MPS = 1 - MPC
Spending (Expenditure) Multiplier Formula
Automatic Stabilizers
ongoing governmental policies such as unemployment insurance, welfare, social security, personal income tax, payroll tax, and corporate income tax
How do automatic stablilizers work?
they protect individuals and businesses from routine fluctuations in the economy by automatically adjusting government spending and taxes based on economic conditions
Fiscal Policy is exercised by the…
government
Expansionary Fiscal Policy
increasing government spending, increasing transfers, decreasing taxes
Contractionary Fiscal Policy
decreasing government spending, decreasing transfers, increasing taxes
Expansionary fiscal policy shifts AD
to the right and boosts real GDP
Contractionary fiscal policy shifts AD
to the left and diminished real GDP
The government spending multiplier is the same as the…
autonomous spending multiplier
Tax Multiplier Formula
Tax Multiplier
indicates the total change in real GDP resulting from each $1 change in taxes
Balanced Budget Multiplier
when government spending change is accompanied by a tax change
Balanced Budget Multiplier Formula
When real GDP increases, the demand for money
increases
When real GDP decreases, the demand for money
decreases
Supply-side economists believe
changes in tax rates change aggregate supply and aggregate demand