Distributions: normal and skewed distributions; characteristics or normal and skewed distributions
1/6
Earn XP
Description and Tags
Name | Mastery | Learn | Test | Matching | Spaced | Call with Kai |
|---|
No study sessions yet.
7 Terms
What is a distribution?
The way scores are spread out and arranged across a data set.
It shows: the pattern of scores, how often different scores occur and whether most scores are high, low or in the middle
E.g. Imagine test scores out of 20:
- Many people score around 10–12
- Fewer people score very low or very high
That pattern of how the scores are spread out is the distribution
When is distribution used in A-level Psychology?
When describing results - whether scores are symmetrical or skewed, or whether they’re high, low or around the middle
With graphs - histograms, frequency polygons, bar charts
When choosing measures of central distribution - the shape of the distribution helps decide which average is most appropriate: normal distribution and skewed distribution
When interpreting data - spot outliers, see patterns or trends, understand whether results are typical or unusual
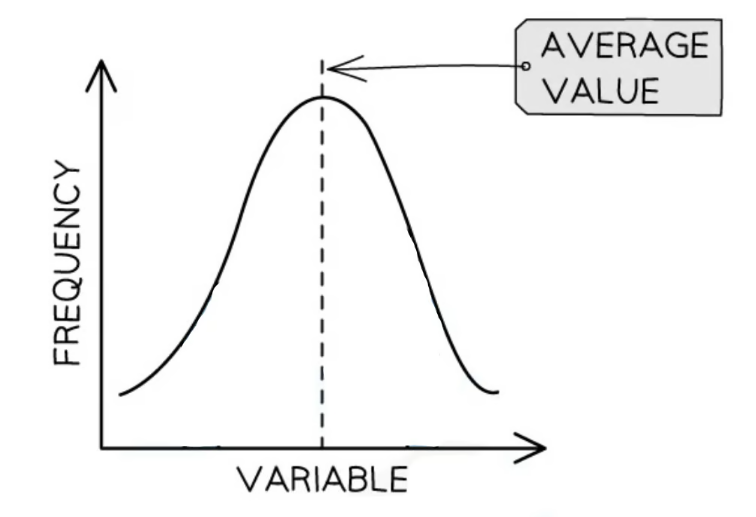
What is normal distribution?
A symmetrical bell-shaped frequency distribution, in which most scores cluster around the midpoint, and the mean, median, and mode all occur at the same value. The distribution occurs when certain variables are measured, such as IQ or the life of a light bulb.
What is skewed distribution?
When the scores are not symmetrically distributed, with one tail longer than the other due to extreme values pulling the distribution in one direction.
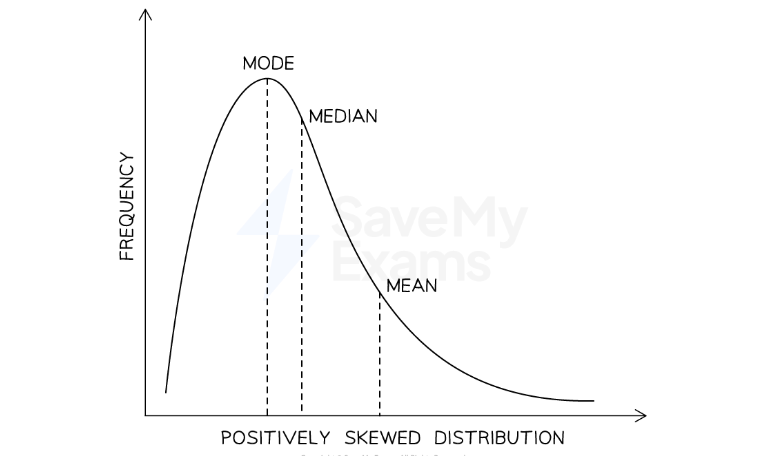
What is positive skewed distribution?
Most of the scores are bunched to the left. The mode is to left of the mean because the mean is affected by the extreme scores tailing off to the right.
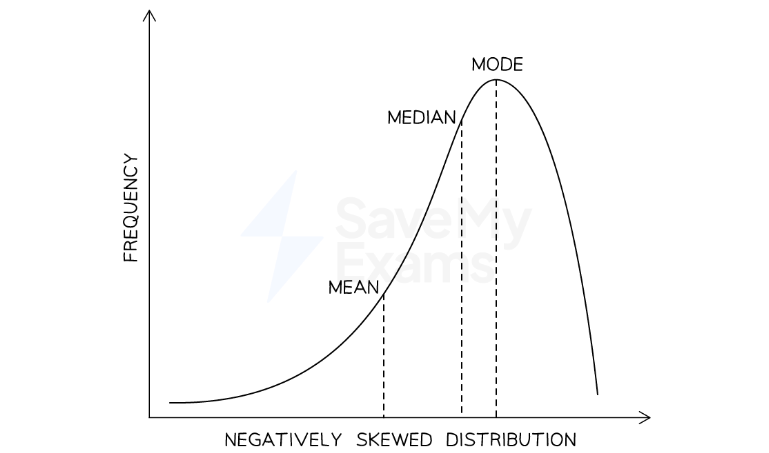
What is negative skewed distribution?
Most of the scores are bunched towards the right. The mode is to the right of the mean because the mean is affected by the extreme scores tailing off to the left.
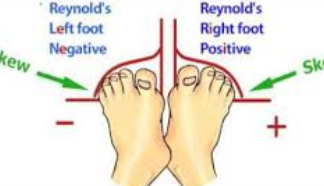
How to remember the direction of skewed distribution?