Fertility
1/24
There's no tags or description
Looks like no tags are added yet.
Name | Mastery | Learn | Test | Matching | Spaced | Call with Kai |
|---|
No analytics yet
Send a link to your students to track their progress
25 Terms
Fertility
Actual reproductive performance or the total number of liveborn offspring per woman aged 15-44 (or 15-49), usually calculated as the average number of children per woman
Fecundity
Maximum biological capacity for reproduction from menarche to menopause, usually 15 per woman but can be between 0 (some infecund, permanent or temporary) to 30 (multiples)
Natural fertility
The level of fertility that would prevail in a population that makes no conscious effort to limit, regulate, or control fertility through birth control, or social norms regulating age at intercourse or birth spacing
(number of live births/midyear estimate of females aged 15-49)×1000
General fertility rate equation
(number of live births/midyear estimate of total population)×1000
Crude birth rate equation
(number of live births to mothers aged 20-24/midyear estimate of females aged 20-24)×1000
Age-specific birth rate (ASPR) equation
(number of live births to married women aged 20-24/midyear estimate of married females aged 20-24)×1000
Marital fertility rate equation
ASPR for age 15+ASPR for age 16…+ASPR for age 49×1000
Total fertility rate equation
Rate of replacement
2.1 children per woman
What are sources of information about fertility and what do they show?
Sources of information about fertility depends on the population but it can come from censuses (only shows survivors), vital statistics, surveys (only contemporary), and family reconstitution (only micro-level to understand motivations behind individuals’ behaviour)
What things can cause issues with the sources of fertility information
Cultural differences about what constitutes marriage or a child, language/definition barriers, cultural taboos, political and cultural barriers, and a lack of prior relationship, etc
What is the general trend in fertility currently internationally and in New Zealand?
There are big differences within and between societies around the world regarding fertility, overall it seems to be going down but to different extents
New Zealand is well below replacement
What are the two approaches to measuring fertility?
A period approach, counting the number of births that occur within a short time interval (E.G. age specific fertility rates, that help to control for differing population structures during comparisons)
A cohort approach, the average number of children women bear in a lifetime, which is a longitudinal approach but requires detailed data
What factors impact fertility?
Probability of coitus (frequency, abstinence, age at marriage, extramarital intercourse, and spousal separation)
Probability of conception (illness impacting sperm count and ovulation, malnutrition, breastfeeding, age, STIs, contraception)
Probability of fetal growth and survival (abortion, miscarriage and stillbirth, infanticide, maternal and infant mortality, stress)
Cultural factors with indirect impacts (age at marriage, polygamy, culturally prescribed abstinence, increasing desire for smaller families)
What did Krause (2005) find in their investigation into declining fertility in Italy
It was an outward expression of class and gender relations
Smaller families came to symbolise higher class, modern, sensible families, versus the very large peasant families of the past
People were marrying later and children living at home longer
A new, more egalitarian family and women in the workforce more, with few social services to support them
These factors were expressed eventually in the fertility rates of Italian women
According to Townsend (1997), why does demography as a social science have ambition reaching beyond the formal modelling of population processes?
Models and descriptions can be helpful in understanding and making predictions about population demographics and trends, but they don’t give info into how cultural, economic, and social factors impact trends
According to Townsend (1997), why is it problemtatic to equate fertility with biological reproduction?
Fertility is culturally and socially constructed, not just an attribute (giving birth)
Decisions regarding fertility are influenced by economic, social, religious, cultural, and political factors, norms, and constraints
According to Townsend (1997), why is parenthood a social phenomenon?
Because the parental role is defined by cultural and social factors that vary/are shaped by cultural norms and children define a parent by accepting someone into that role
Parenthood (Townsend, 1997)
The role and responsibility of raising/caring for children, involving nurturing them in development and passing on cultural and social information
According to Townsend, how should parenthood as a social phenomenon impact views on fertility?
Because fertility is also a social phenomenon, so demographers should look at new variables, like the cost and benefits of children, and encourages them to include others like men and non-biological relations
This can prevent distortion, provide insights into why fertility rates change, and how societal factors and non-biological relationships can influence fertility
What did Pool et al. (2013) find about New Zealand family structures and fertility in early New Zealand?
Pakeha families went from high fertility, probably because of less family support and a younger marriage age, unlike Britain
This changed towards lower fertility, likely due to more family support, movement away from rural areas, and changing marriage norms, more like Britain
Māori families shrank, likely due to European colonisation, loss of land, disease, etc
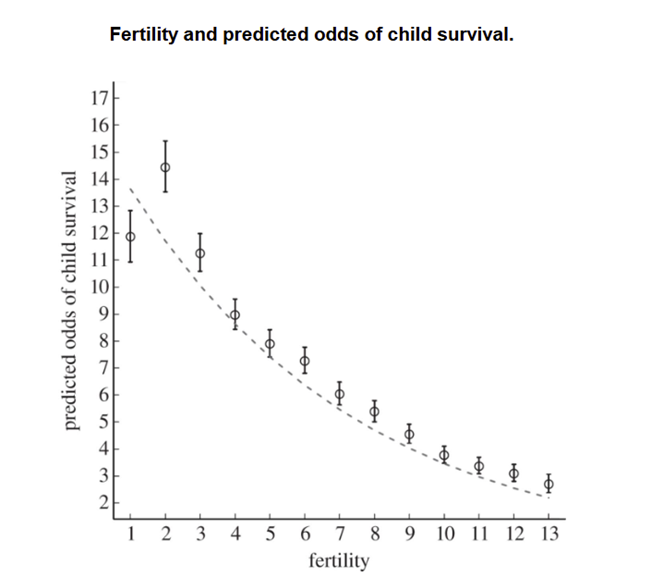
What does this graph depict?
As fertility (number of children) increases, the predicted odds of child survival decreases
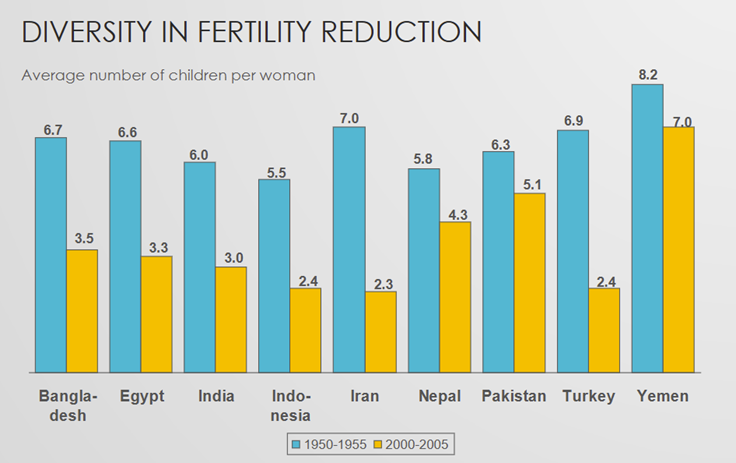
What does this graph depict?
Variation in the number of children per woman in different countries in two different periods, it varies depending on the country, but all show a decrease
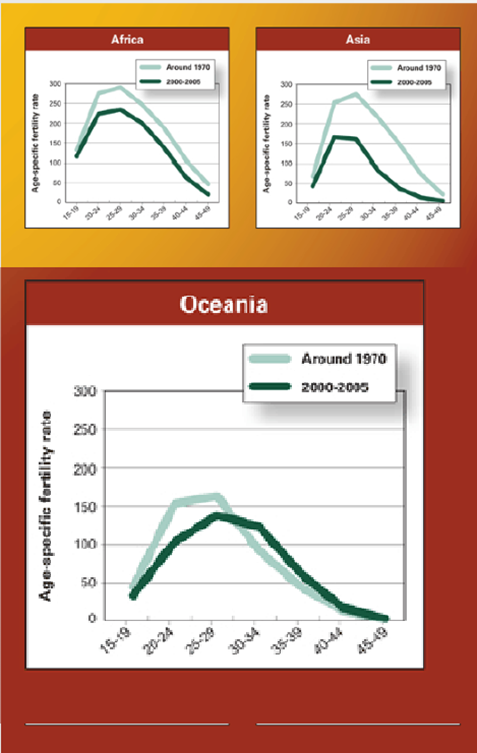
What do these graphs depict?
Trends in age-specific fertility in different regions, shifting towards older ages of having children and a general decrease in the number of births per woman, industrialisation can also impact this
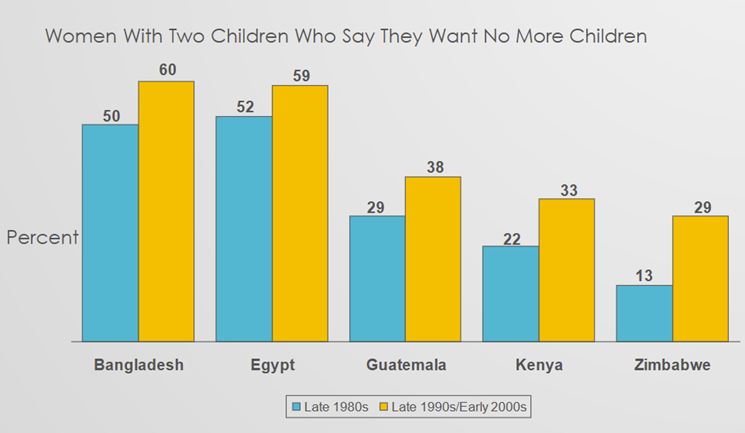
What does this graph depict?
The shift towards more women only wanting two children