STATS 250: Exam 2 Learning Objectives
1/64
Earn XP
Description and Tags
Lectures 08-14
Name | Mastery | Learn | Test | Matching | Spaced |
|---|
No study sessions yet.
65 Terms
Explain the limitations of reporting statistics and 𝑝-values when drawing conclusions about null and alternative hypotheses.
Only provides info about magnitude of evidence, making it unclear if magnitude is due to large sample size, large null error, or both.
Explain the limitations of reporting statistics and 𝑝-values when drawing conclusions about null and alternative hypotheses: Test-statistics and p-values are influenced by
True discrepancy b/t true parameter value and null value claimed to be correct by Ho and amount of data sampled at random from pop.
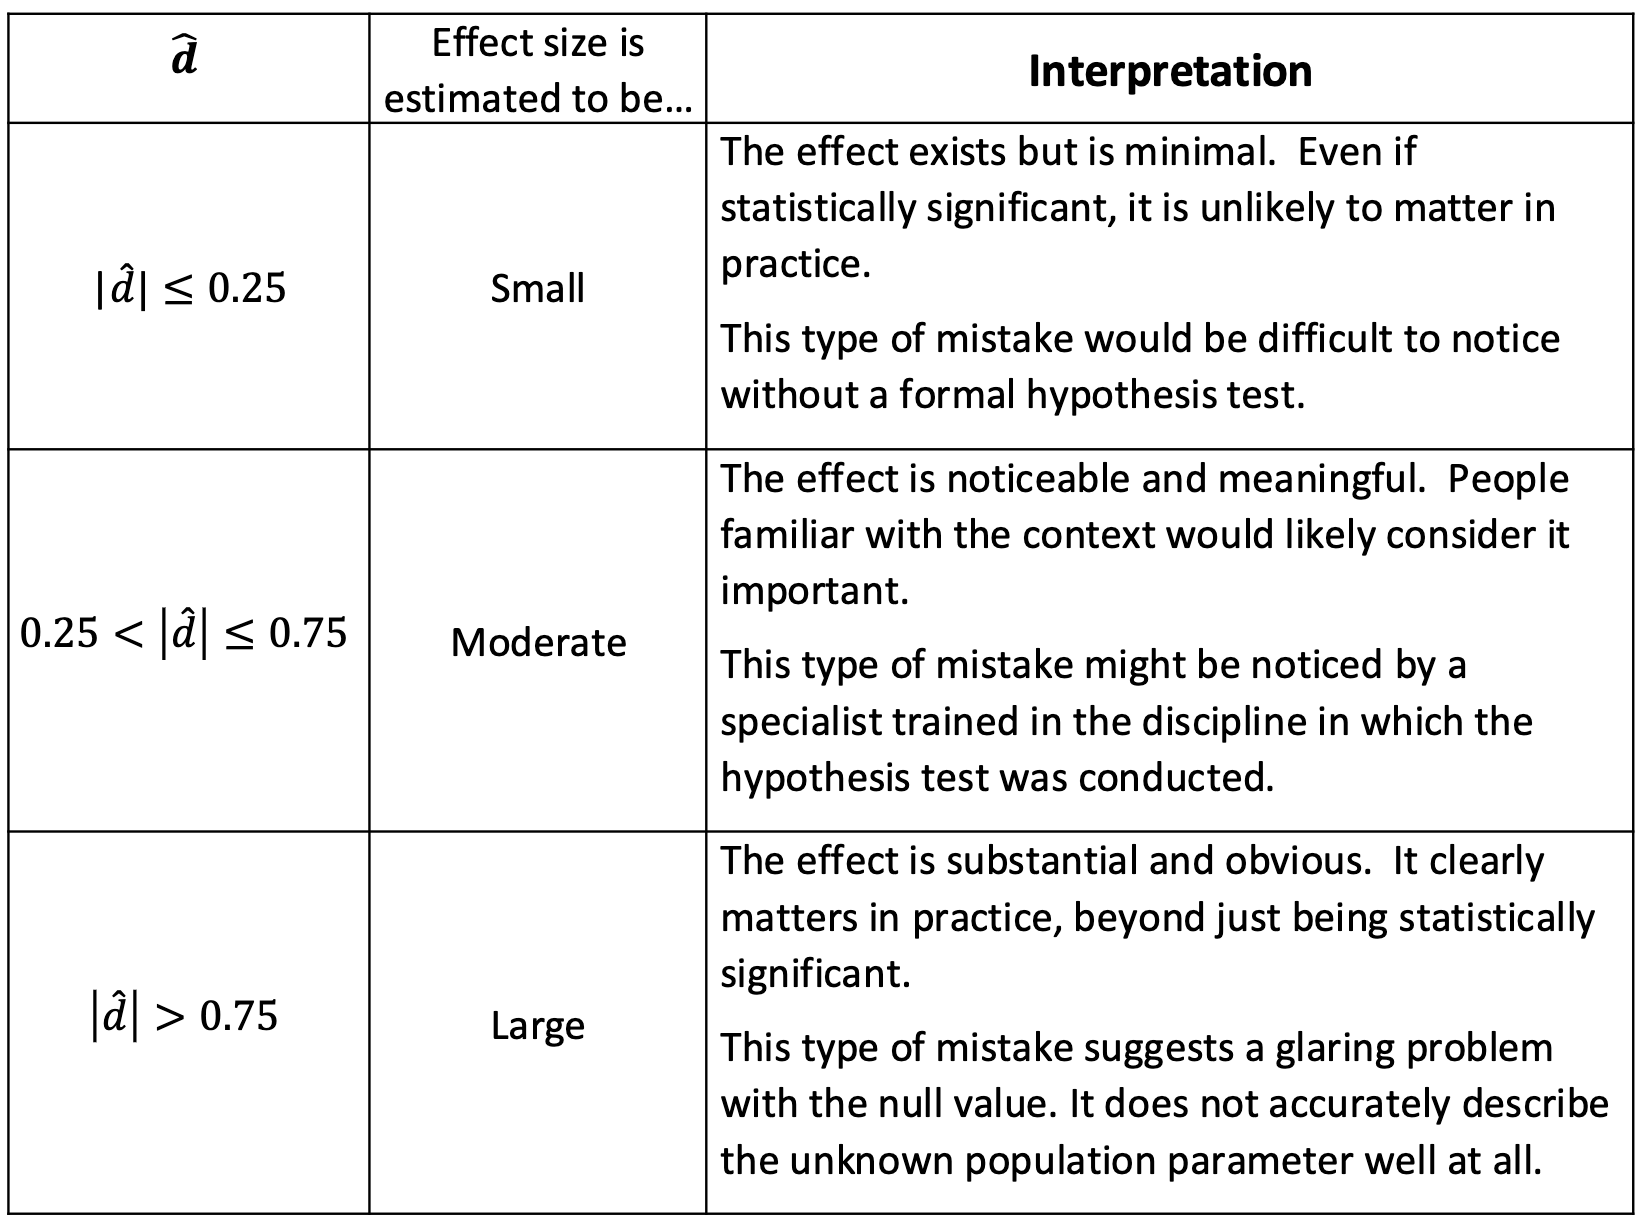
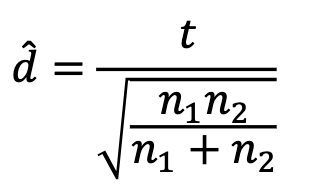
Interpret estimated effect sizes for tests of a single proportion 𝜋 and a single mean 𝜇:
The estimated effect size of d, suggests context (increase/decrease/diff.) is (minimal/noticeable/substantial) in magnitude for observ. unit.
Explain the relation between test statistics, p-values, sample sizes, and estimated effect sizes:
Diff. sample sizes influence samples to have almost identical test statistics and p-values. Larger sample sizes make it easier to spot small effect size diffs.
Explain the relation between test statistics, p-values, sample sizes, and estimated effect sizes: Big mistakes require less data
The more wrong the claimed null is, the less data needed to detect it. The closer the claimed null is to being correct, the more data needed to tell the diff.
Power Definition:
Prob. that a test generates (very) strong evidence against Ho when Ha is true (able to detect effect size when one truly exists).
Power Equation:
(# values w/ strong + # values w/ very strong evidence)/total values.
Power Interpretation:
In the long run, when test is conducted of the claim that mu=X, and the true value of mu is actually mu-hat. This mistake is detected about power% of the time.
Explain how the power of a testing procedure is influenced by sample size. Predict how a test’s power is affected by changes in sample size.
Direct relationship.
Explain how the power of a testing procedure is influenced by true effect size. Predict how a test’s power is affected by changes in true effect size.
Direct relationship. Larger true effect sizes make it easier to detect mistakes.
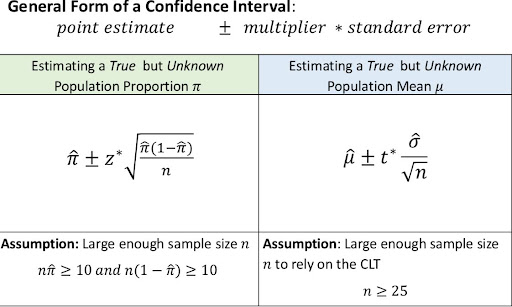
Construct confidence intervals to estimate population proportions 𝜋 and population means 𝜇: Formula
PE +/- MOE.
Construct confidence intervals to estimate population proportions 𝜋 and population means 𝜇: Lower bound
PE - MOE.
Construct confidence intervals to estimate population proportions 𝜋 and population means 𝜇: Upper Bound
PE + MOE.
Construct confidence intervals to estimate population proportions 𝜋 and population means 𝜇: Point estimate
Sample statistic.
Construct confidence intervals to estimate population proportions 𝜋 and population means 𝜇: Margin of error
Quantifies precision of PE.
Construct confidence intervals to estimate population proportions 𝜋 and population means 𝜇: Multiplier interpretation
CL% of area beneath curve falls b/t multiplier=lower bound and multiplier=upper bound.
Construct confidence intervals to estimate population proportions 𝜋 and population means 𝜇: Point estimate: Multiplers that should NEVER exist
Multipliers should never be 0 (0% confidence) or infinity (100% confidence) b/c they don't provide meaningful info about true parameter value. This leads intervals that just include PE or are too wide.
Define confidence intervals:
Provides range of plausible values in favor of unknown parameter value.
Explain CI purpose in statistical inference:
Used b/c hyp. tests are limited by their disconfirmatory nature, generating evidence against a claim about an unknown parameter but not for it. Helpful when asked for an unknown value not a yes/no question.
Define confidence intervals and explain their purpose in statistical inference: CI Interpretation
The true (averg./prop.) of CONTEXT parameter is unknown, but we are CL% confident that parameter falls b/t lower and upper bounds.
Define confidence intervals and explain their purpose in statistical inference: Impact of SD on CI
As SD increases, CI widens, needing to account for more variability (less precise).
Define confidence intervals and explain their purpose in statistical inference: Impact of sample mean on CI
Change in sample mean shifts center of CI.
Explain what the confidence level of an interval represents in terms of the long-term success rate of the method used to construct it: Controllable Confidence Interval Formula Components
Multiplier and sample size.
Explain what the confidence level of an interval represents in terms of the long-term success rate of the method used to construct it: Random Confidence Interval Formula Components
PE and SE.
Explain what the confidence level of an interval represents in terms of the long-term success rate of the method used to construct it: Long Run Success Rate Interpretation + Formula
CL*(total # intervals) = # intervals expected to successfully contain parameter.
Recognize common misinterpretations of confidence intervals (Confidence vs. Probability): Confidence
Measures degree of uncertainty about outcomes of present/past events, used to quantify reliability of interval ests. (level of uncertainty). It's not possible for CI to have a chance of containing parameter (single interval). Either it's successful (1) or not (0), there is no prob.
Recognize common misinterpretations of confidence intervals (Confidence vs. Probability): Probability
Measures likelihood that specific event will occur in future. Ranges from 0-1 and describes chance behavior of many random outcomes.
Describe how confidence level influences the width (precision) and reliability of confidence intervals
Frequency of interval failures (don’t contain parameter) decreases as CL increases (inverse relationship). However, as CL increases, intervals widen, needing to account for more variability (less precise).
Describe how sample size influences the width (precision) and reliability (confidence) of confidence intervals
As sample size increases, precision also increases (intervals become narrower) b/c size decrease SE in MOE. Increasing size doesn't make interval more reliable than one w/ smaller sample size.
Explain and apply the connection between confidence intervals and non-directional hypothesis tests (1-level means α = 0.001):
If tested null value lies inside CI w/ a specific CL, the non-directional hyp. test will produce a p-value > 1-level. If tested null value lies outside CI w/ a specific CL, the non-directional hyp. test will produce a p-value < 1-level.
Identify whether two variables are associated using visual summaries:
Overlapping boxes.
Identify whether two variables are associated numerical summaries:
Diff. in means, medians, SD, and IQR.
Describe the role of explanatory variables:
Var. used to explain another.
Describe the role of response variables:
Var. outcome explained.
Build intuition for inference by connecting observed differences to the idea of population parameters and interpreting visual evidence: Inference Intuition with visual summaries - If Mean Group 1 > Mean Group 2 (Ha: u1 - u2 > 0 (right tail)
Will only include + values.
Build intuition for inference by connecting observed differences to the idea of population parameters and interpreting visual evidence: Inference Intuition with visual summaries - If Mean Group 1 < Mean Group 2 (Ha: u1 - u2 < 0 (left tail):
Will only include - values.
Build intuition for inference by connecting observed differences to the idea of population parameters and interpreting visual evidence: Inference Intuition with visual summaries - If Mean Group 1 = Mean Group 2
Will include + and - values.
Apply inference methods—Use hypothesis tests to make conclusions about population difference (2-sample t-test), considering both statistical and practical significance: Start with a question - Parameter of interest (mu1 - mu2) Interpretation
True but unknown diff. in averg. observ. units across two pops.
Apply inference methods—Use hypothesis tests to make conclusions about population difference (2-sample t-test), considering both statistical and practical significance: Start with a question - Statistic of interest (mu-hat1 - mu-hat2) Interpretation
Observed diff. in averg. observ. unit in sample data.
Apply inference methods—Use hypothesis tests to make conclusions about population difference, considering both statistical and practical significance (2-sample t-test):
Start w/ question. Collect data. Analyze data. Draw conclusion.
Apply inference methods—Use hypothesis tests to make conclusions about population difference (2-sample t-test), considering both statistical and practical significance: Start with a question
Define true, but unknown parameter of interest. State Ho and Ha claims about that parameter.
Apply inference methods—Use hypothesis tests to make conclusions about population difference (2-sample t-test), considering both statistical and practical significance: Analyze the data
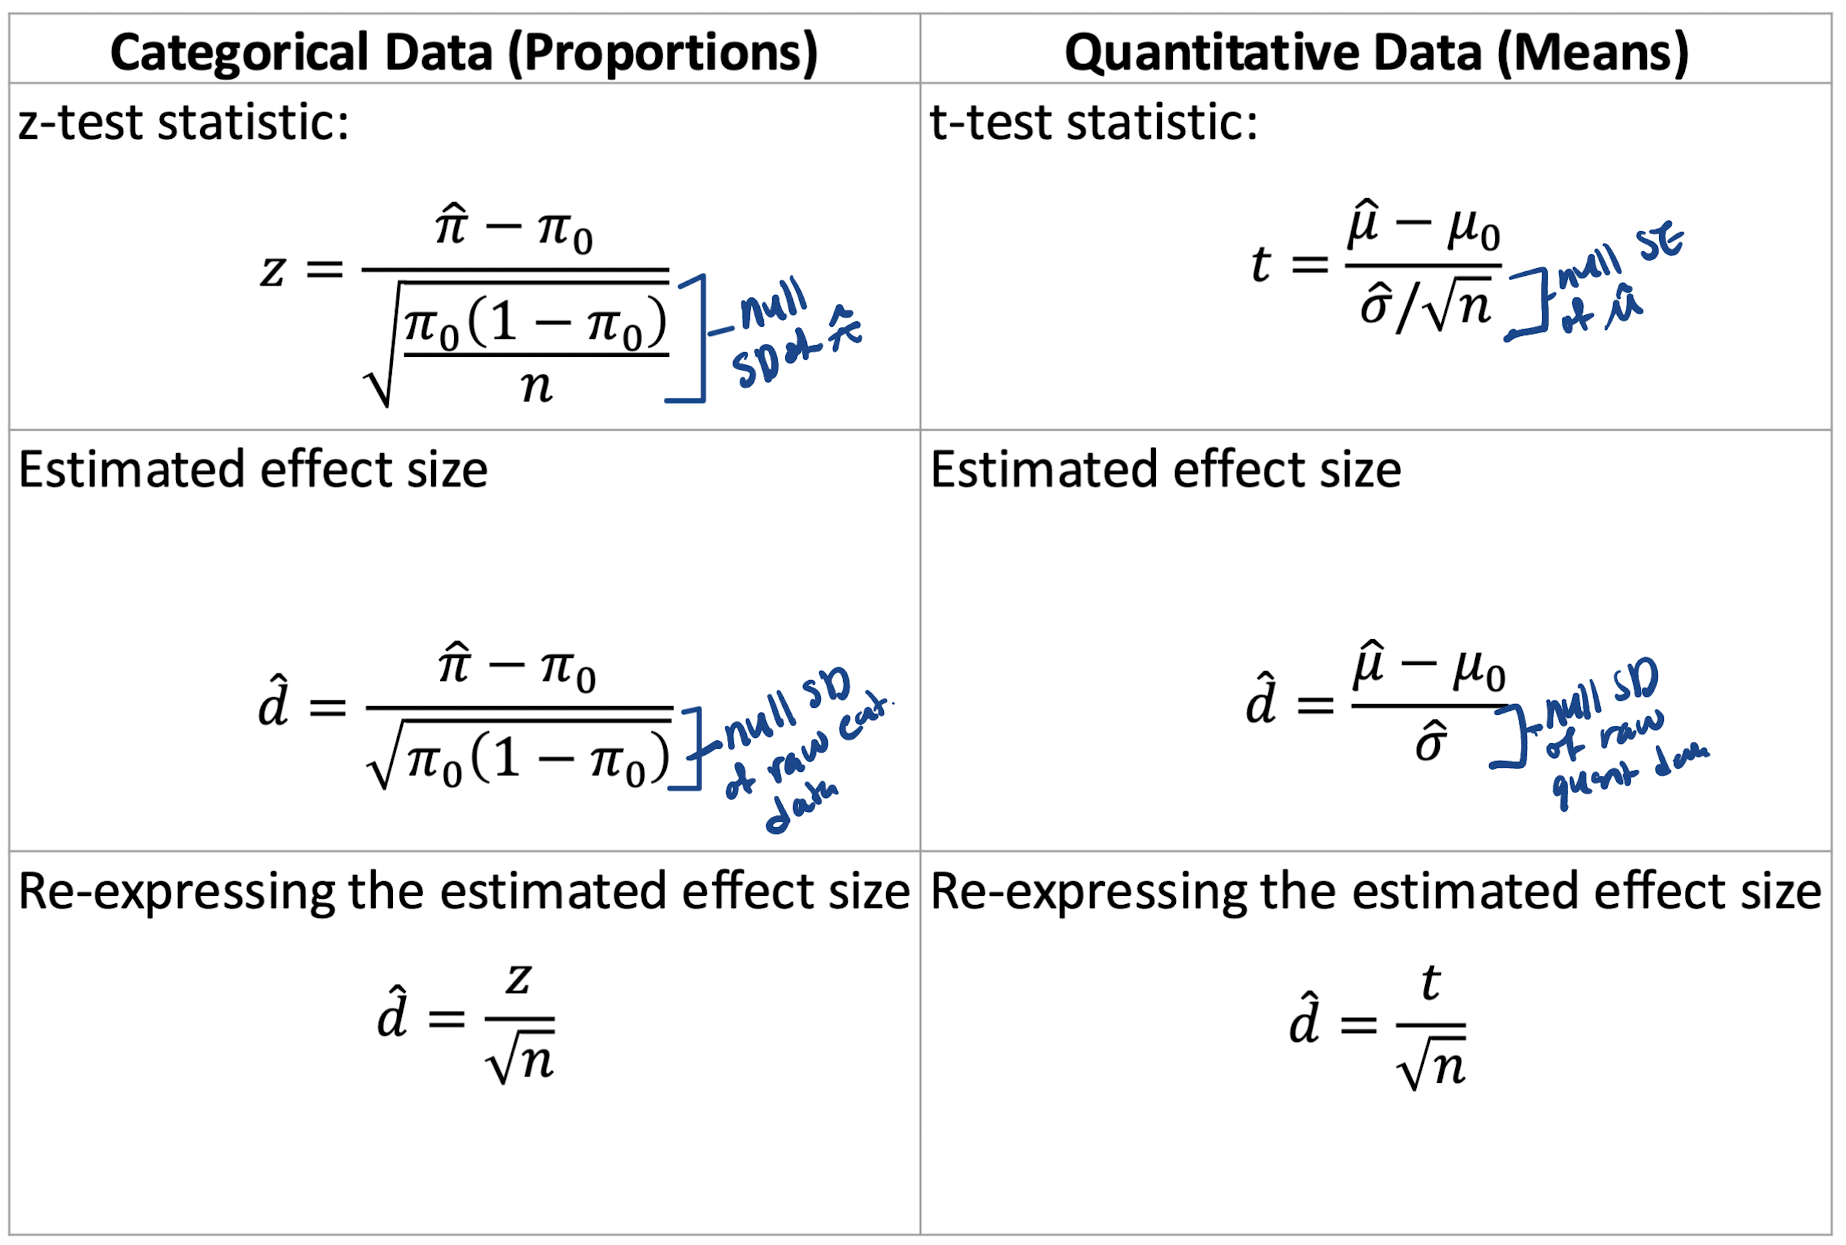
Make t-distribution graph. Calculate observed statistic, test statistic, p-value, and effect size.
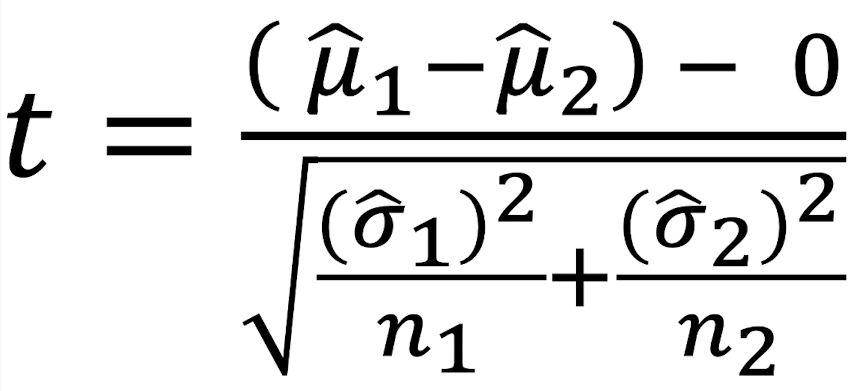
Apply inference methods—Use hypothesis tests to make conclusions about population difference (2-sample t-test), considering both statistical and practical significance: Analyze the data - t-test statistic interpretation
The observ. diff. in sample averg. was t-test SE (below/above) the hypothesized by the null.
Apply inference methods—Use hypothesis tests to make conclusions about population difference (2-sample t-test), considering both statistical and practical significance: Analyze the data - effect size interpretation
The effect size of d suggests explanatory var. is (not) ass. w/ (magnitude; increase/decrease) in response var.
Apply inference methods—Use hypothesis tests to make conclusions about population difference (2-sample t-test), considering both statistical and practical significance: Analyze the data - Computing p-value
(2*)pt(test statistic, df, lower.tail=T/F).
Apply inference methods—Use hypothesis tests to make conclusions about population difference (2-sample t-test), considering both statistical and practical significance: Analyze the data - p-value interpretation
If in fact, null context were perfectly independent, we’d expect to witness a test statistic (more/less) than X SEs away from the null value of 0 in only about p-value% of repeated random samples of this size.
Apply inference methods—Use hypothesis tests to make conclusions about population difference (2-sample t-test), considering both statistical and practical significance: Draw conclusion interpretation
The p-value provides (level) evidence against null and in favor of alt. claim. Thus it can be concluded there is an ass. b/t var. 1 and 2. The estimated effect size of d suggests that var. 1 has (magnitude) ass. on 2 and thus may have (magnitude) real-world impact.
Distinguish between informal and formal methods for assessing associations between variables: Formal - qt() function in R to find t* multiplier
qt(area, df, lower.tail=T). Area=CL+(1-CL/2).
Explain the results of a two-sample t-test and the corresponding confidence interval, including what each reveals about statistical and practical significance: If effect size is -
Explanatory sample group 2 is ass. w/ response var.
Explain the results of a two-sample t-test and the corresponding confidence interval, including what each reveals about statistical and practical significance: If effect size is +
Explanatory sample group 1 is ass. w/ response var.
Explain the results of a two-sample t-test and the corresponding confidence interval, including what each reveals about statistical and practical significance: Prediction that a CL will not contain 0 (independence):
P-value < X% (100% - CL%).
Explain the results of a two-sample t-test and the corresponding confidence interval, including what each reveals about statistical and practical significance: Prediction that a CL will contain 0 (independence)
P-value > X% (100% - CL%)
Explain the results of a two-sample t-test and the corresponding confidence interval, including what each reveals about statistical and practical significance: Common misinterpretation of CL
A CL doesn't imply bounds have CL% chance of capturing true parameter. Instead, it describes that in the long run, CL% of future intervals computed using the same method will successfully capture the parameter est.
Explain the results of a two-sample t-test and the corresponding confidence interval, including what each reveals about statistical and practical significance: CL Interpretation
With CL% confidence, we estimate the difference in averg. context b/t these two pops. is a plausible value b/t lower and upper bounds.
Evaluate whether an observed association may be confounded by a third variable and explain how controlling for that variable affects interpretation: Explanations for associations - Sampling Variability
There is no relationship at pop. level. Diffs. seen in sample happened by chance b/c of sampling variability.
Evaluate whether an observed association may be confounded by a third variable and explain how controlling for that variable affects interpretation: Explanations for associations -Confounder
The groups defined by explanatory var. differ in some other important way that also affects response var. such as confounder being responsible for observed pattern.
Evaluate whether an observed association may be confounded by a third variable and explain how controlling for that variable affects interpretation: Explanations for associations - Cause-and-effect
There is a true cause-and-effect relationship. Changes in explanatory result in changes in response var.
Evaluate whether an observed association may be confounded by a third variable and explain how controlling for that variable affects interpretation: Confounders definition
Vars. ass. w/ explanatory and response var. Inability to make causal conclusions.
Evaluate whether an observed association may be confounded by a third variable and explain how controlling for that variable affects interpretation: Confounder effect ≠ casual relationship
While existence of confounder shows ass., it doesn't mean that it's causal w/ vars.
Differentiate between study design and its implications for inference: Observational Studies
Researcher recruits participants and collects data in a way that doesn't directly interfere w/ how data arises, so the study isn't balanced and only reveals patterns/ass.
Differentiate between study design and its implications for inference: Randomized Experiments
Researcher directly influences process by which data arise. By randomly assigning observ. units to 1+ treatments, study is balanced and increases likelihood of causal connection.
Identify and evaluate potential confounding variables: Design-based control (before data collection)
When participants are randomly assigned to conditions any existing diffs. among individuals are balanced on averg. to establish causal conclusions.
Identify and evaluate potential confounding variables: Analysis-based control (after data collection)
Stat. methods that address confounders by comparing groups similar w/ respect to confounder or include var. in analysis. Helps to separate effect of explanatory var. from confounder, leading to more accurate understanding of relationship.
Explain how a study’s use of random assignment supports generalizable and causal claims: Random Assignment
Process where observ. units are placed into diff. groups through random chance rather than by a pre-existing characteristic.
df for two-sample t-tests
sample size w/ smaller df.