Intro to Business and Economic Statistics
1/53
There's no tags or description
Looks like no tags are added yet.
Name | Mastery | Learn | Test | Matching | Spaced |
|---|
No study sessions yet.
54 Terms
population
a collection of individuals or objects that is under study
sample
a subset of the population
variable
a characteristic of interest about each individual element of a population or sample
data
numbers or information with a context
different characteristics are measured for different individuals in the population or in the sample
quantitative data
variables that can assume numerical values
qualitative data
variables that are not numerical
observations are categorized into various groups or categories
data collection
obtained from...a published source, designed experiment, survey, observational study
sampling
-representative of the population
-have characteristics typical of the target poulation
simple random sample
sample in which each element in the population has an equal change of being selected
systematic sample
sample in which the first element is picked at random, and then every kth element is picked
-there should be an ordering among the elements for us to use this
stratified random sample
sample obtained by stratifying the sampling frame and then selecting a fixed number of elements from each strata by simple random sampling
cluster sample
sample obtained by sampling some of, but not all of, the possible subdivisions within the population
frequency distribution
tabular summary of data showing different classes and the frequency (or number) of items in each of several non-overlapping classes
shows how the observations in the sample are distributed
objective is to provide insights about the data that cannot be quickly obtained by looking only at the original data
relative frequency
total number of observations belonging to the class
distribution
describes how the observations are spread over the range of the data
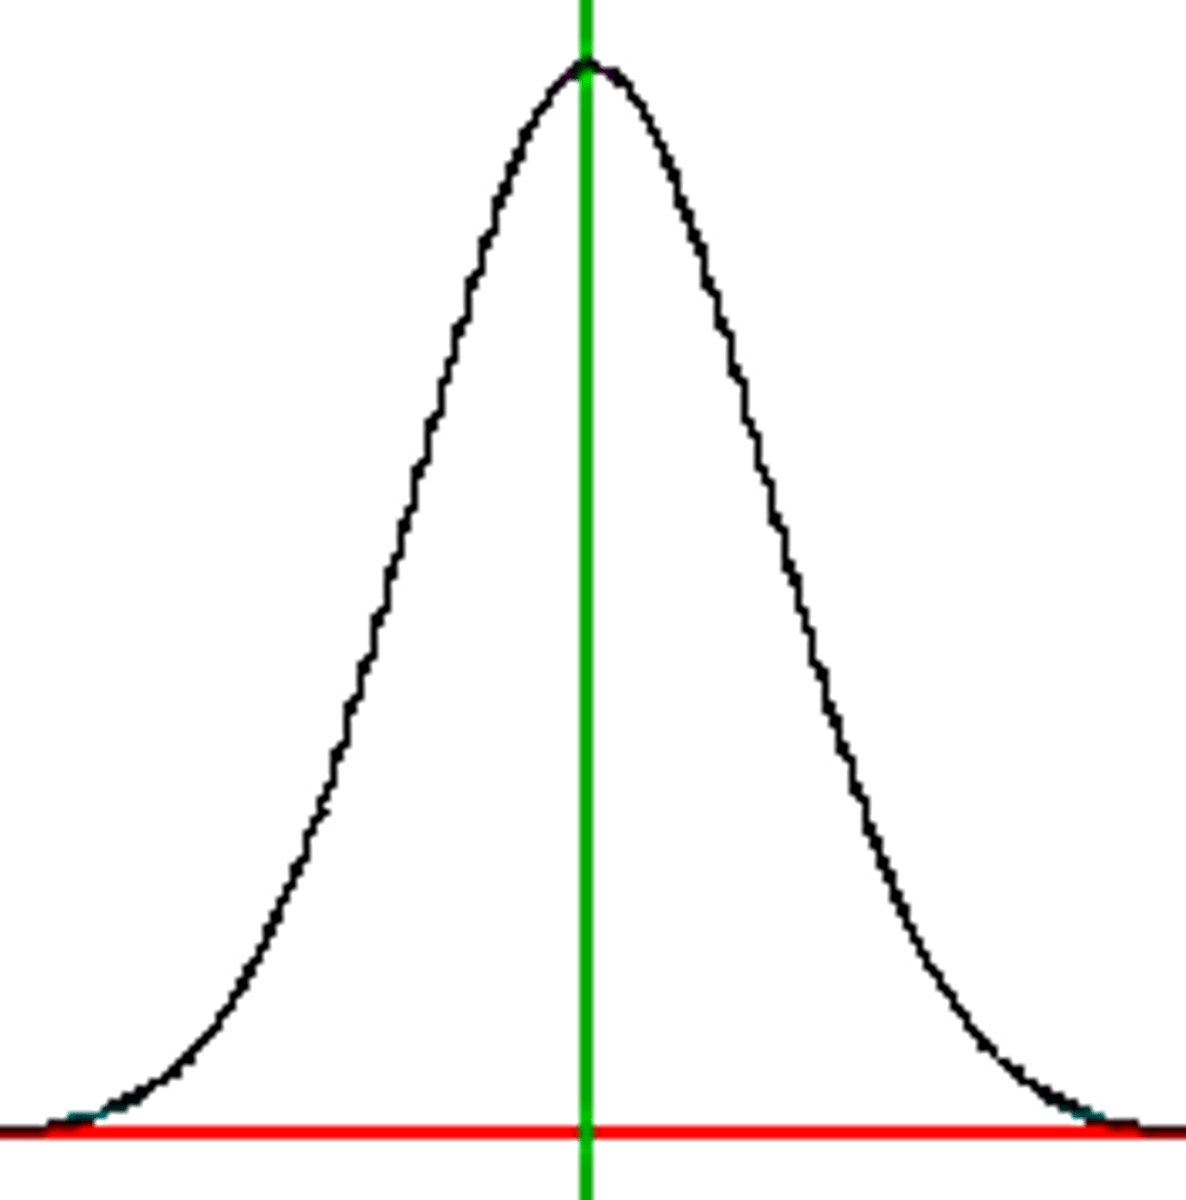
Symmetric distribution
mount shaped
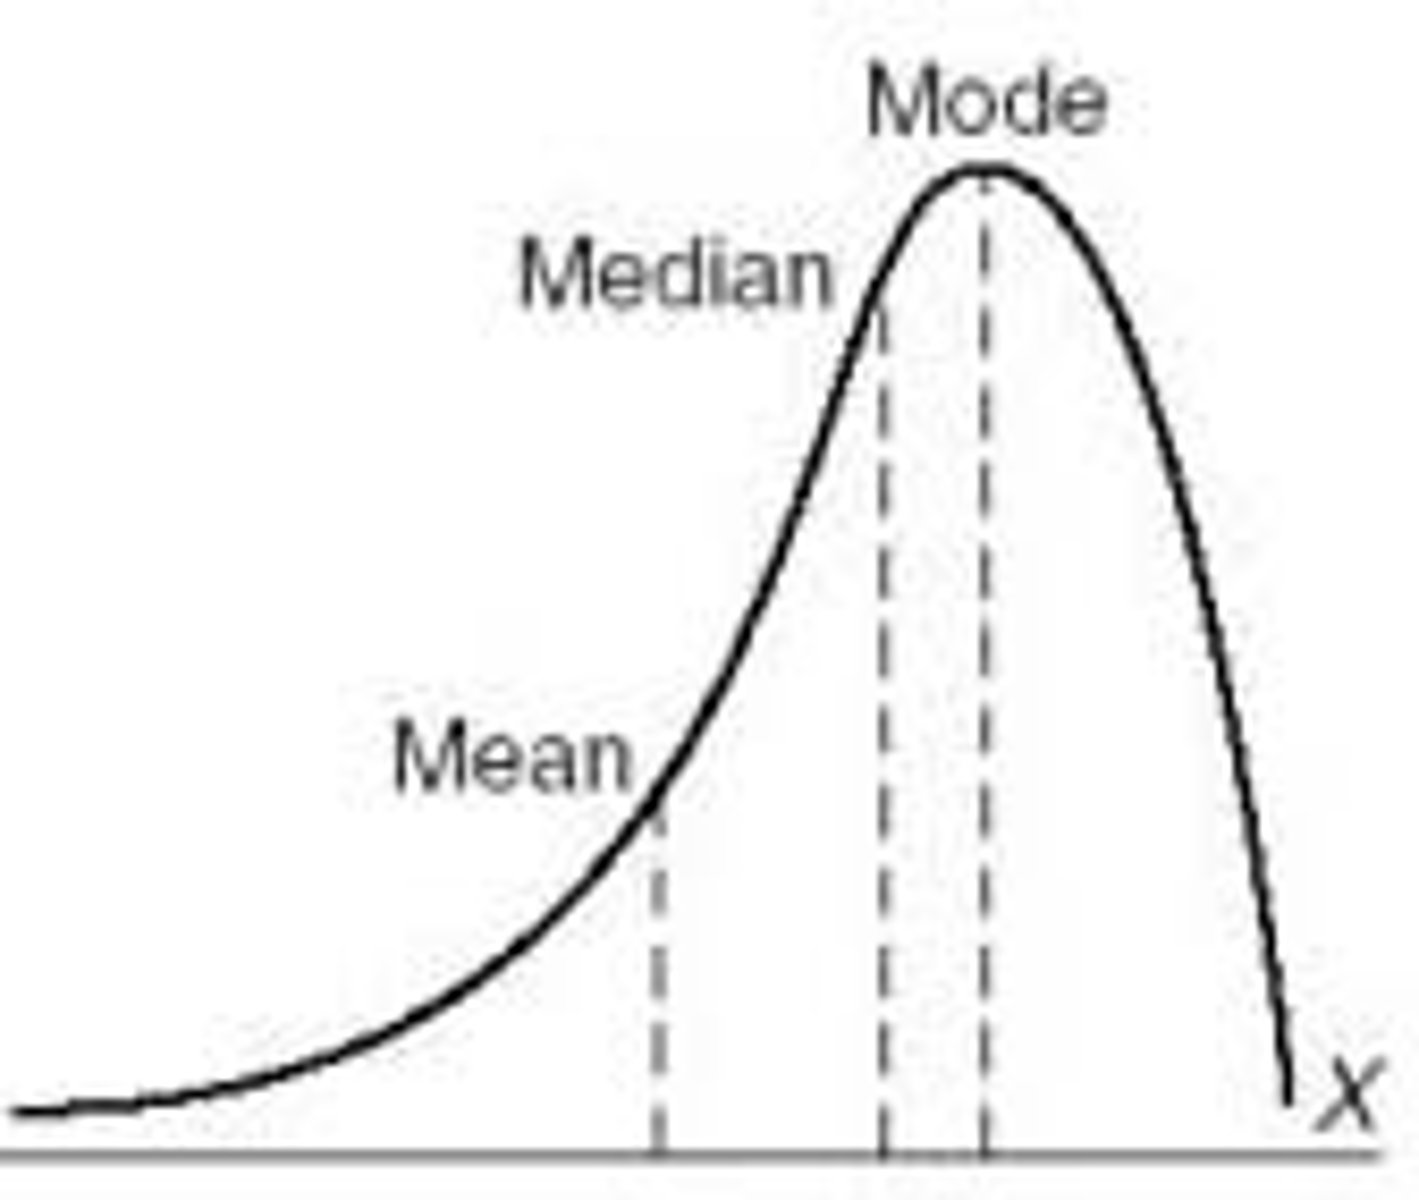
Negatively skewed/skewed to the left
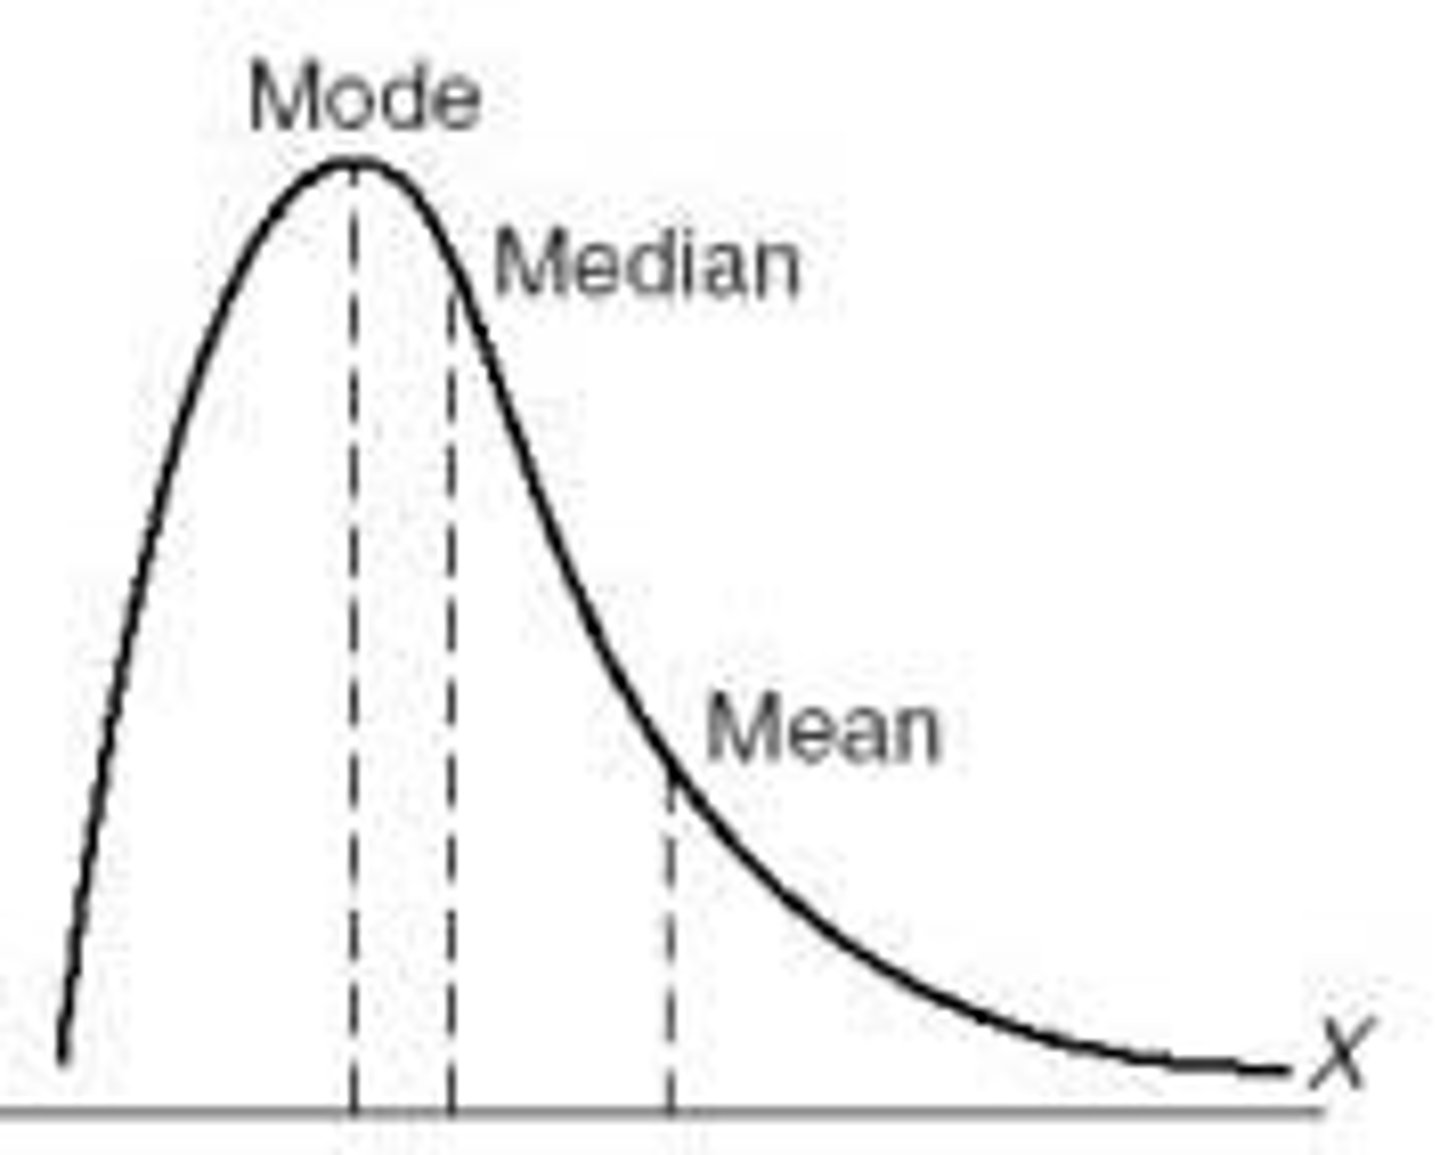
positively skewed/skewed to the right
center
measure of the central tendency
variability
spread of the data
mean
average of a group of numbers
mode
most frequent observation
median
most middle observation
range
maximum - minimum
variance
tells us the squared distance between a typical observation and the mean of the data
standard deviation
gives the average distance between a typical observation and the mean of the dataset
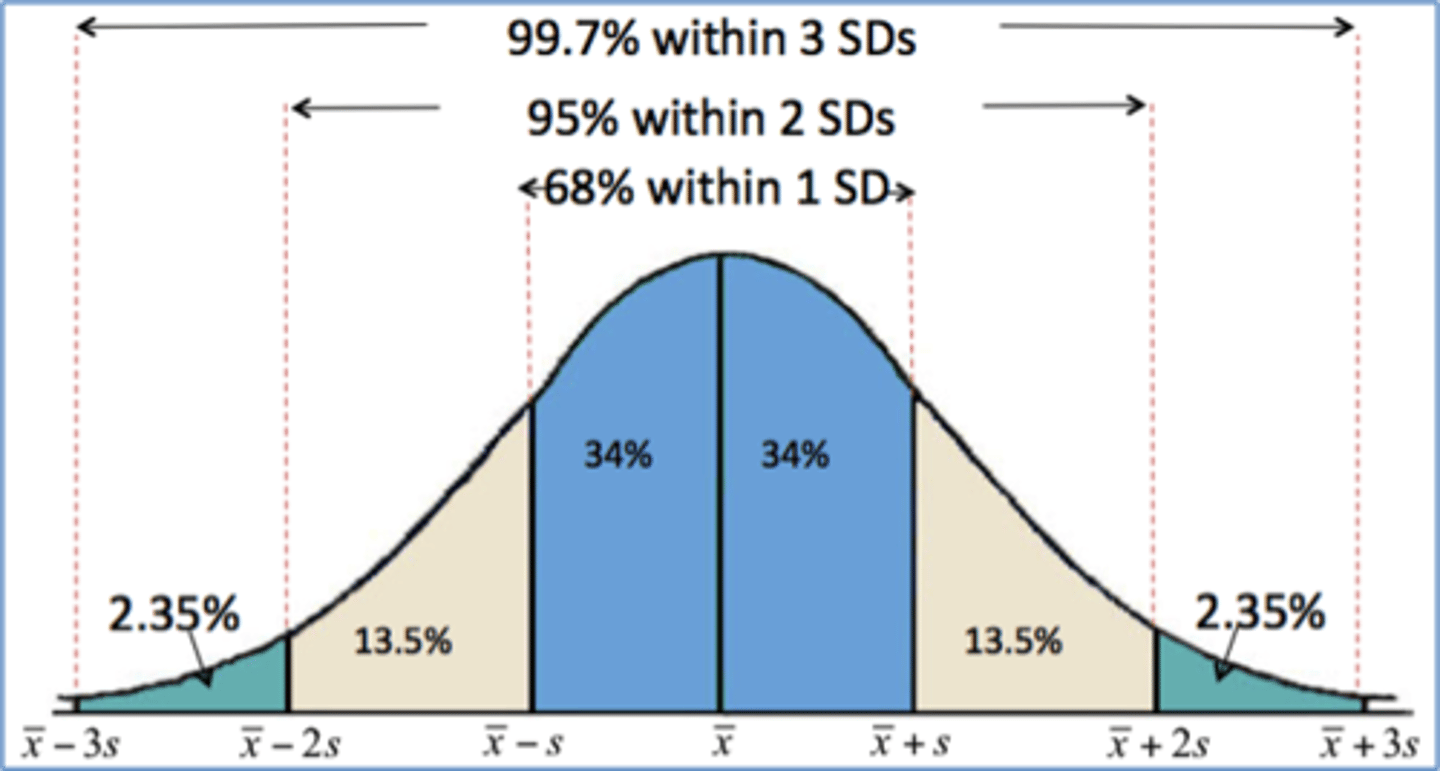
empirical rule
Chebyshev's rule
for any number k > 1, at least (1-1/k^2) fraction of the data will like within k standard deviations of the mean
z-score
measures the relative position of an observation in comparison to the mean
outliers using z-score
z-score bigger than 3 or less than -3
Lower Quartile (Q1, QL)
25% of the observation are below this
Median (M, Q2)
same as median
Upper quartile (QU, Q3)
75% of the observations lie below this
5 number summary
minimum, lower quartiles, median, upper quartile, maximum
probability
study of randomness and uncertainty, numerical measure of change
law of large numbers
when an experiment is repeated a large number of times, under identical conditions, then the relative frequency of a particular "outcome" approached the actual probability of that "outcome"
Subjective Probability
probabilities are assigned on the basis of subjective judgment/belief of an individual
theoretical probability
basic outcomes of the process are defined
probabilities are assigned to the basic outcomes
using these, probabilities of compound events are computed
experiment
a process that yields a single outcome that cannot be predicted with certainty
sample point
basic outcome of an experiment
sample space
set up all possible outcomes of an experiment, denoted by S
event
any subset of the sample space
compound event
a composition of 2 or more events
venn diagrams
pictorial diagrams where the sample space is represented by a rectangle with sample points represented by solid dots inside the rectangle
events are drawn as circles within the rectangle
Mutually exclusive events
events that share no sample points
multiplicative rule
used to find probability of two events happening at the same time
independence
if probability of event A does not depend on whether event B has occurred or not
random variable
a variable that assigns a unique value to each outcome of the Sample space
discrete random variable
variable that takes either finitely many values or a countably infinite set of values
countable set
a set in one to one correspondence with integers
continuous random variable
set of possible values consist of one or more intervals on the number line
Probability Distribution
specification of the possible values and probability associated with each possible value of the discrete random variable
bernoulli
random variables can assume only two possible values 1 (success) and 0 (failure)
binomial experiment
identical trials are repeated and we are interested in number of certain outcomes