Experimental
1/83
There's no tags or description
Looks like no tags are added yet.
Name | Mastery | Learn | Test | Matching | Spaced |
|---|
No study sessions yet.
84 Terms
What is the Belmont Report
A document with a set of rules made to protect people who take part of a research study
What are the 3 main principles of Belmont report?
1) Beneficence
Maximize benefits, minimize cost
2) Respect for persons
Informed consent
They have autonomy and can choose to be part of study
3) Justice
Researchers should be fair/ equal treatment
No group should be targeted or excluded
What are the 5 principles of the APA Ethics cod
1) Beneficence and Nonmaleficence
2) Fidelity and responsibility
Establish relationship and trust
3) Integrity
Don’t lie, cheat, steal, or commit fraud
4) Justice
5) Respect people’s rights & Dignity
what 7 things should a consent form have?
1) Purpose of study
2) Procedure + time
3) Risks and benefits
4) Compensation
5) Confidentiality
6) Contact info (for questions)
7) Voluntary act & can withdraw
what are the 4 levels of IRB review? (which is more than minimal risk?)
1) Exempt Review
2) Expedited Review
3) Limited Review
4) Full review (greater than minimal risk)
What is another way of saying:
Reliability & Validity
Reliability = Consistency
If I weigh myself and use that number to represent my IQ Validity= Accuracy
If I weigh myself now and get 170, and weigh myself 10 min later, and it still says 170 (rather than 230)
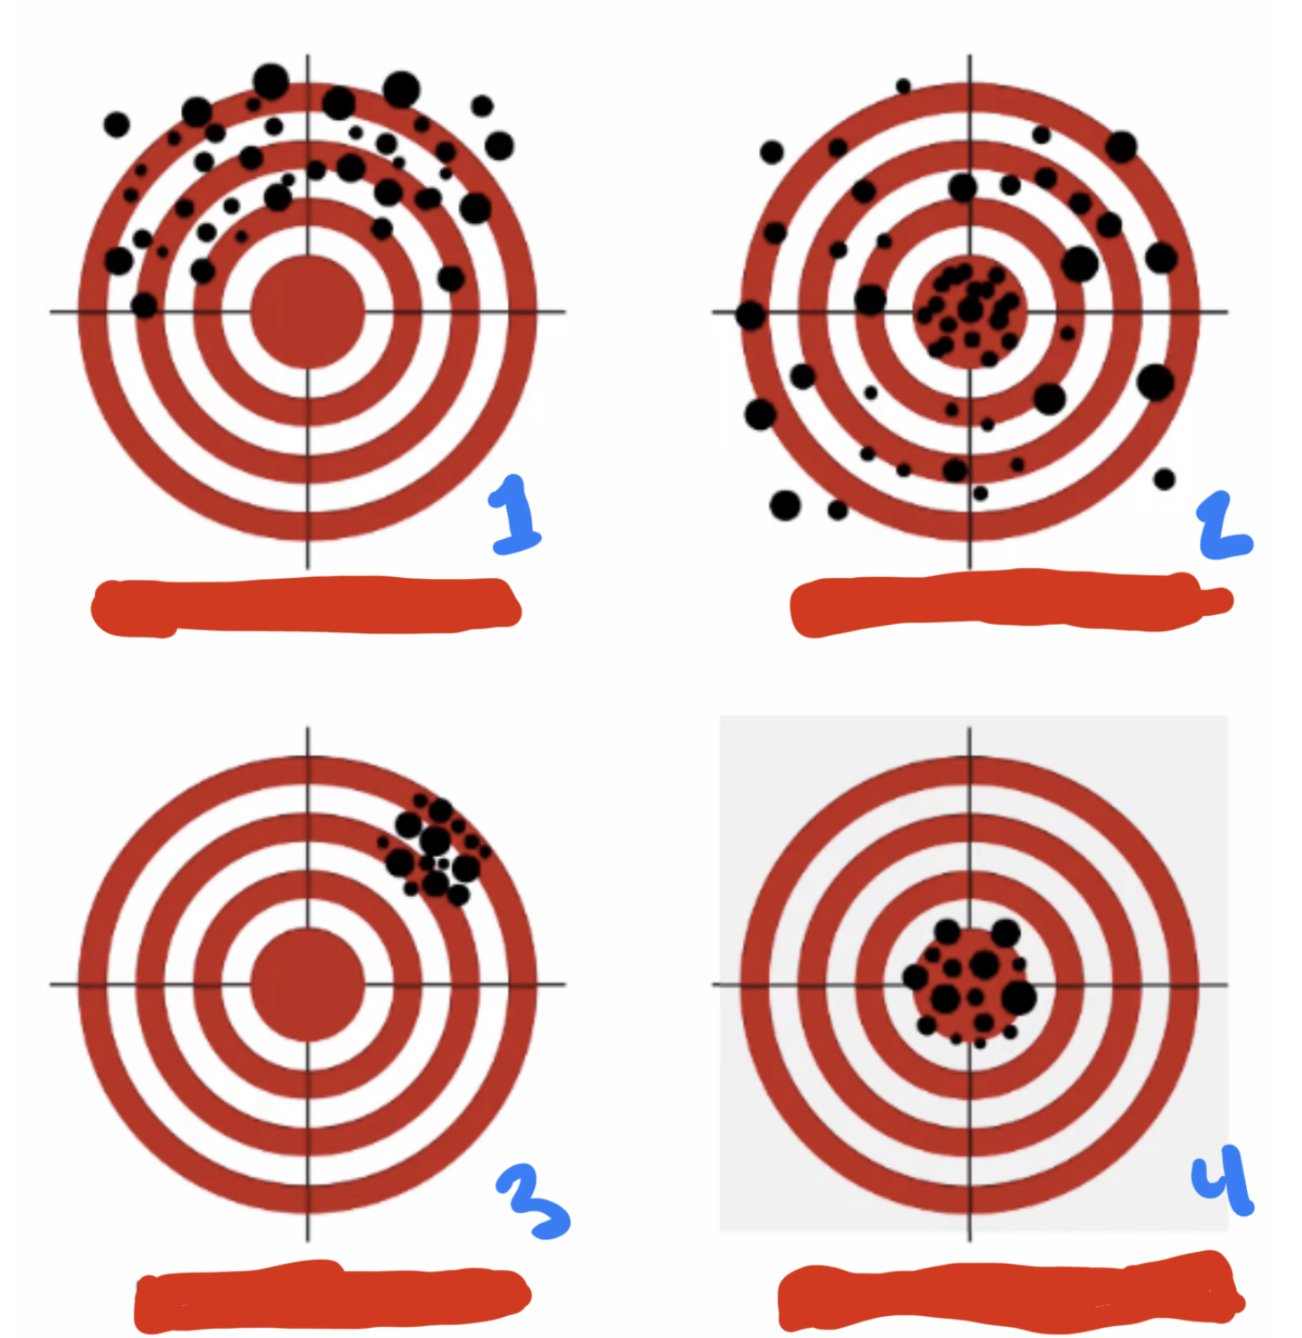
1: Unreliable & unvalid
2: Valid, but unreliable
3: Reliable, but not valid
4: Both Reliable & valid
Reliability: 3 categories + subsections
1) Internal Consistency
a) Item total correlation
b) Split-half reliability
c) Cronbach’s Alpha
2) Reliability Across Time
a) Test-retest
b) Alternate form
3) Reliability Across People
a) Inter-rater Agreement
Internal Consistency
How do the INDIVIDUAL items relate to one another
How well the items on a test or survey measure the same concept or idea, showing that the items are reliable and consistent with each other
[Ex]
(G)A depression survey asks 10 questions about sadness
(B)A depression survey asks 10 questions about your fave color
Internal Consistency:
1) Item total correlation
2) Split-Half reliability
3) Cronbach’s Alpha
How well each individual question (item) on the test correlate to the overall score of all the other items
r (correlation coefficient) shows how strong 2 items’s are related
Internal Consistency:
1) Item total correlation
2) Split-Half reliability
3) Cronbach’s Alpha
Results are split into two halves—odd vs. even questions—and the scores from each half are correlated (using r) to see if they produce similar results
Compare the 2 different groups
What is the flaw in the split-half reliability?
The 2 groups can be rearranged to provide a higher r
(can result in different correlation resulte)
Easier to manipulate and generate results that lean towards one direction
Internal Consistency:
1) Item total correlation
2) Split-Half reliability
3) Cronbach’s Alpha
Uses ALL possible Split-half combinations instead of just one way of dividing the test
alpha > .8
(Reliability Across Time)
Test-retest reliability
How well does the SAME person agree with themselves at MULTIPLE TIME POINTS
Administer the same test at 2 points in time
(Reliability Across Time)
Alternative form of reliability
Examine the correlation between the MULTIPLE MEASURES of the same construct
Measures how consistent test results are across two different versions of the same test that are designed to measure the same content and skills
→ Administer 2 different forms of the same test at 2 time points
Reliability Across People
(Inter-rater Reliability)
How well do MULTIPLE individuals agree in their observations of the same thing?
Cohen’s Kappa (used to calculate their match)
What is Cohen’s Kappa
Calculation for how much 2 or note observations agree when classifying items, beyond what we would expect by chance
-1 to +1
K<0 → Less than chance agreement
k< 0.6 → Good agreement
Used to compare how well two observers agree in their observations
(Part of Inter-rater reliability)
What are the 6 types of Validity measures?
(FCCCDP)
1) Face Validity
2) Construct Validity
3) Concurrent Validity
4) Convergent Validity
5) Divergent Validity
6) Predictive Validity
Face validity
On the surface, how much a test appears to measure what it’s intended to measure
(Subjective)
Construct Validity
How well a test is measuring the theoretical concept it’s intended to assess
Concurrent Validity
Tells us if the measure differentiates people who are theoretically supposed to be different
Differentiates people who are sad vs happy (Differentiating)
The extent to which a new test or measure aligns with a known measure (result)
Convergent Validity
measure SHOULD be related to other measures that assess a similar construct
2 different tests or measures that are supposed to assess the same thing actually show similar results
E.g.,
→ If your happiness questionnaire has low correlation with a stress scale, that shows divergent validity — happiness and stress are different constructs, so the test is measuring what it’s supposed to.
Divergent Validity
Our measures should NOT be related to other measures that assess different constructs
If your happiness questionnaire has low correlation with a stress scale, that shows divergent validity — happiness and stress are different constructs, so the test is measuring what it’s supposed to
Predictive Validity
How does our measure predict scores on another measure assessed at a future time
True Score vs Error of Measurement
True score:
actual, real value of what you are trying to measure
→ If someone’s true level of math ability is 85/100, that’s their true score.
Error of Measurement:
difference between the observed score and the true score.
→ If the person scores 80/100 on a math test because they were tired, the 5-point difference is measurement error.
What is cognitive Dissonance
Mental discomfort or tension we feel when our beliefs, attitudes, or behaviors conflict with each other
Naturalistic vs Systemic Observations
Naturalistic:
observations in a natural settings over a period of time
Systemic:
observations of one or more specific behaviors in a particular setting
Features of naturalistic Observations
Generate hypothesis AFTER looking at data/results
Describe settings, events, and persons
Data = qualitative/descriptive
These studies aren’t done to test pre-existing hypothesis, but rather gather other data to create a NEW hypothesis
[E.g., observing people at a concert]
Features of Systemic Observations
START WITH HYPOTHESIS
Typically involves a carefully crafted coding system used to record behavior/data/observations
Observations are QUANTIFIABLE
[E.g., how does the amount of alc you drink impact how long you dance?]
what are 5 features of systemic observations
1) Prevalence
2) Frequency
3) Duration
4) Intensity
5) Category of behavior
What are the CHALLENGES of observational research?
1) Role of observer can cause REACTIVITY (Pt changes their behavior)
2) Bias of observer
3) Concealment issues
4) Ethical Concerns
What is fidelity in research?
How closely a study follows its planned procedures or intervention — ensuring that what was intended to happen actually happens as designed
how “fiel”/ loyal are you to following the original rules/plans
What is a problem and solution to fidelity issues
Problem:
Subjective bias (note-taking/Coding)
Solution:
Multiple observers
Careful training
Utilize methods that don’t rely only on observers
What are 6 challenges in observations?
(EDSRRR)
1) Equipment
2) Data Coding
3) Sampling
4) Reactivity
5) Reliability
6) Role of observer
what are 3 possible solutions to the 6 issues of observations?
1) Multiple Observers
2) Careful training
3) Utilizing record methods that don’t rely on observations
What are the goals of observations?
1) Describe behavior
2) Identify patterns/Relationships
3) Generate hypothesis
4) Understand context
What is the purpose of surveys?
1) Describe behavior
2) Test Hypothesis
3) Assess psychological/mental health
4) Gather information to inform policy
What are the 3 types of questions in questionnaires?
1) Facts & Demographics
What is your gender? When did you take Intro to Psych?
2) Behaviors
How do you prepare for class?
3) Attitudes & Beliefs
What do you think is the best way to learn?
What are the 5 weaknesses of questionnaire’s?
1) Double Barreled
2) Complicated vocab/questions
3) Loaded question
4) Negative wording
6) Yea-saying/Nay-saying
What are the weaknesses of self-report?
1) Social desirability
2) Problems with survey (e.g. Wording issues)
3) Memory inaccuracies
4) Inattentive responding
Solutions to Self-report issues?
1) Anonymous questionnaire
2) Real-time questionnaire ( Experience-sampling method, ESM)
3) Psychometrics (tests & questionnaures)
4) Multiple items (for answer options)
Close-ended vs Open-ended
(Strengths and weaknesses)
Close-ended
Easier to respond & ENCODE
Open-ended:
HARDER to code
more details for interpretations
Rating scale (response option)
sale from 0-7 (standard)
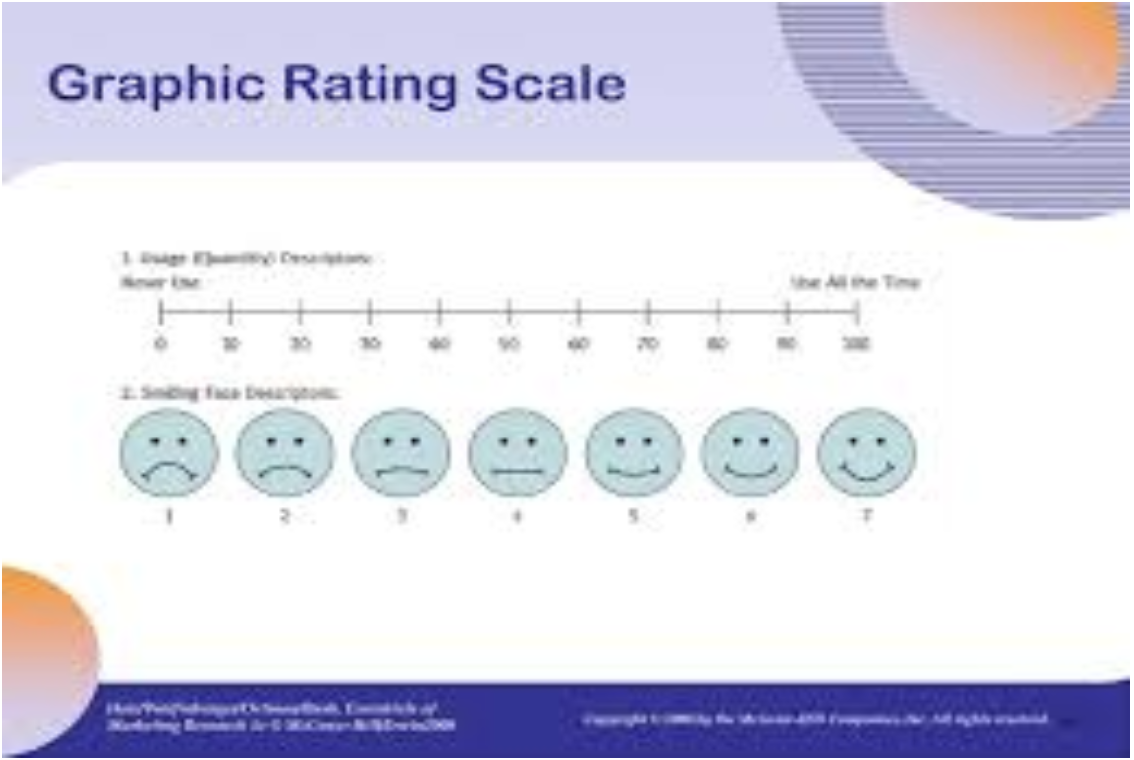
Graphic Rating Scale
requires a 100-millimeter line anchored with descriptions to each end
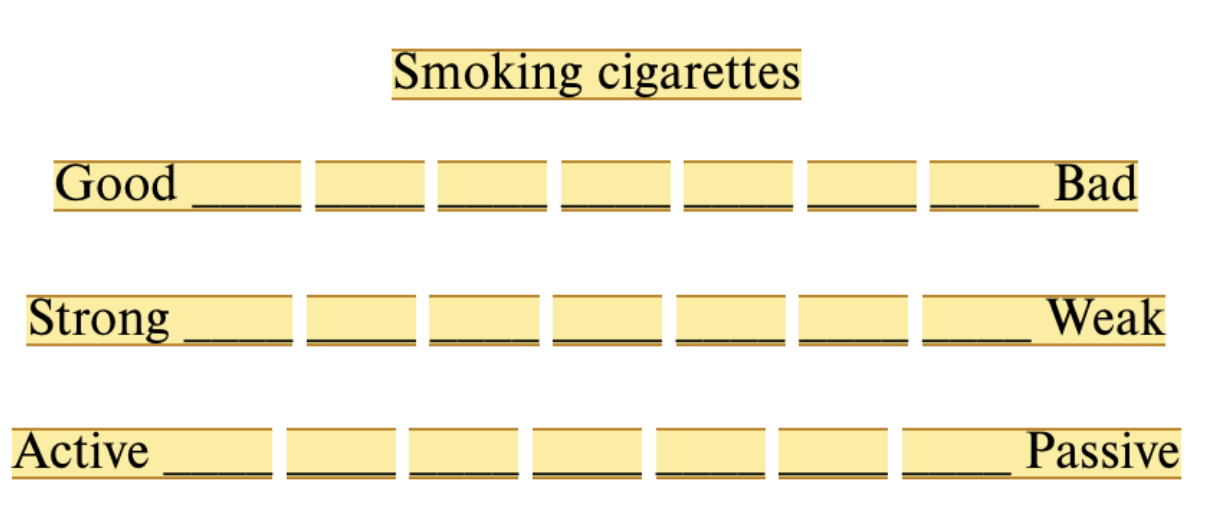
Semantic Differential Scale
Scale items differentiate 3 dimensions (evaluation, activity, and potency) on a series of bipolar adjectives using a 7-point scale
Pictorial Scale
Used when studying young children or adults with problems understanding verbal instructions
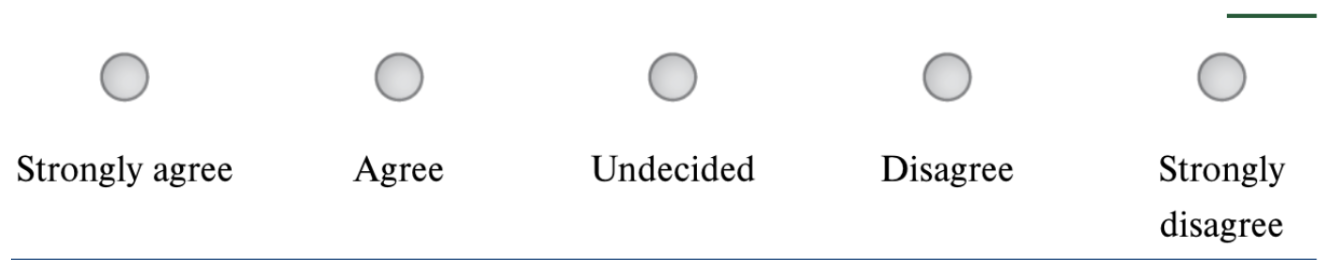
Labeling Response Alternatives
Giving each survey answer choice a clear, descriptive label (e.g., “Strongly agree,” “Agree,” etc.) instead of just numbers—this helps respondents interpret the scale consistently
What are the 3 steps of manipulating an IV?
1) Operational definition
2) Manipulate variable
3) Define DV
Probability vs Non-probability SAMPLING
Probability:
Every member of the population has an equal chance of being selected
Good for generalization
Non-probability:
Not all members have an equal chance of selection
Bad for generalization
Straightforward manipulation vs Staged manipulation
Straightforward:
Researcher manipulates variables the way they planned it
Staged:
Manipulation of IV using complex situations
Stimulating real-life interaction
Requires “Acting” ability
The strength of manipulation is tempered by 3 factors:
1) Ecological & External validity
2) Ethics
3) Curvilinear Relationship
Ecological vs External validity
Ecological:
how well the setting matches the real-world we want to apply the results to
External:
How well the results generalize other populations besides the one being studied
Strong manipulation (negative effects on) Ethics
Might replicate issues observed in Milgram experiment
A strong manipulation of IV can harm others
Strong manipulation & Curvilinear relationships
Increasing the strength of the manipulation can lead the pattern to move from one direction to the other
can reduce or reverse the desired effect, showing that more isn’t always better.
How can we make sure a manipulation worked?
Manipulation check
Include a 2nd measure (not the DV of interest) to assess whether the manipulation operated correctly
Place it after a manipulation
At the end of the experiment
Pilot study
Issue with manipulation check
Demand Characteristics
Anything about the experiment that unintentionally indicates to participants how they SHOULD act
→ TItle of the study
→ Instructions
Reactivity vs Demand Characteristics
Reactivity:
change their behavior simply because they know they are being observed.
Demand Characteristics:
guess the purpose of a study and then alter their behavior to fit what they think the researcher wants
How can demand characteristics be controlled?
1) Deception
2) Filler Items
3) Ask participant about their perception of the study
Expectancy Effect
Experimenter bias
Any intentionl/unintentional influence the experimenter exerts on participants to confirm the hypothesis of the study
what are some things expectancy effects lead experimenters to do?
1) Give a hint/highlight main idea in introduction
2) Behave friendly/cold to certain people
3) Inform pt about the putpose of the study
Solutions to expectancy effect
Double-blinded study
Neither the participant or the experimenter know what group the pt is in or the idea of the experiment
Automated Procedure:
Online instructions or brief interaction between pt and experimenter
3 types of DV measures
1) Behavioral
Recall, Recognition, Cued call
2) Self-report
How much do you think you will remember later?
3) Physiological
Measure physiological changes: (fMRI) Brain activity during reading
Floor Effect vs Ceiling Effect
Floor effect:
Extremely low scores on a measure
Measure was too hard
Ceiling effect
Extremely high scores on a measure
Measure too easy
what are the 4 frequency distributions (define them)
1) Pie Chart
Nominal
2) Bar Graph
Nominal + Ordinal
3) Frequency Polygons
Ratio + Interval
4) Historgram’s
Ratio and interval
Effect size [r] vs Cohen’s d
Effect size
How large is the effect (magnitude of effect)
small: 0.10
medium: 0.30
large: 0.50
→ Mean difference/Population SD
0 = complete overlap (supports null hypopthesis)
→ UNAFFECTED by sample size
Cohen’s d:
How FAR APART are the two group means?
Type of effect size
Small: 0.20
Medium: 0.50
Large:" 0.80
NHST (Null Hypothesis Significance testing)
How likely is it for the observed results (differences)to occur if the null hypothesis is true (no effect in the population)?
High vs Low probability of NHST
High:
Fail to reject null
NHST is true
Low:
Reject the null
p-value (definition)
Probability of observing results (or something more extreme) if the null hypothesis is true
How likely is it to get the results just by random chance if the null hypothesis is true
large vs small p value
Large:
(> 0.05) means your results are likely due to chance, so you fail to reject the null hypothesis.
Small:
(≤ 0.05) means your results are unlikely due to chance, so you reject the null hypothesis.
Alpha (Define)
Probability of making a Type I error, which occurs when you reject the null hypothesis (H₀) even though it is true.
a: 0.05
5% risk of incorrectly rejecting the null hypothesis
t-statistic & p-value
t-statistic measures the difference between a sample mean & hypothesized population mean
Large t-stat: difference between groups is large
Small t-stat: difference between groups is small
p-value expresses the probability of getting the t-statistic that we got if the null is true
What does p value of 0.07 mean
If the null is true (the groups are truly equal to the population), there is a 7% chance that we would observe these results, and that is not low enough for us to claim an effect (or a difference more extreme)
t-test vs F-test (ANOVA)
t-test | F-test (ANOVA) | |
Purpose | Compares the means of two groups/levels of 1 IV | Compares means of 3 or more groups/levels of 1 IV or more |
Testing | Whether the difference btw the 2 means is significant | Whether ANY of the group means are significantly different from each other |
Ratio | Difference between means ------------------------------- Variability within groups | Variability between groups -------------------------------- Variability within groups |
# | Large t =
| Large F:
|
main effect vs simple effect
Main effect;
overall effect of one independent variable on the dependent variable, ignoring the other variables
Simple Effect:
the effect of one independent variable at a specific level of another variable
Main effect = overall difference.
Simple effect = difference within a specific condition.
What factors affect statistical significance
1) Sample size
2) Alpha
3) Effect size
bigger effects are easier to detect
4) Measurement accuracy
Type 1 vs Type 2 error
Type 1:
“False alarm”
Rejecting the null when it was actually true
ALPHA
Type 2:
“Miss”
Failing to reject the null hypothesis when it was actually false
Exact vs Conceptual Replication
Exact:
Repeat the same study under the same conditions
Few changes
Conceptual:
test the same hypothesis, but change the METHODS
why are replications helpful?
1) Weed out false effects
2) Type 1 errors
3) Fraud detection
What are the goals of behavioral science
1) Description/Observations
2) Prediction
3) Determine cause
4) Explain
Hypothesis vs prediction
Hypothesis:
Possible answer to the question (semi-specific)
Prediction:
EXPECTED outcome of research investigation
Operational Definition
Tells you exactly how something is measured or observed in a study
External validity
Extent to which results can accurately generalize to other populations/settings
Internal validity
Results happened because of what you changed (the independent variable) and not something else
What are the principles of experimental design
Control
Randomize
Replicate
Manipulate