Experimental Psych Exam 2
1/59
There's no tags or description
Looks like no tags are added yet.
Name | Mastery | Learn | Test | Matching | Spaced | Call with Kai | Chat |
|---|
No analytics yet
Send a link to your students to track their progress
60 Terms
Statistics give us a way to tell apart ____ ____ from random individual differences.
real effects
descriptive statistics
used to describe/summarize the data.
many types: frequency distributions, summary measures, and graphical representations of the data
way to visualize the data
first step in any statistical analysis
Cross-Tabulation
a way to see the relationship between two nominal or ordinal variables
when done with score data, it is usually done as a scatter plot
create a set of cells by listing the values of one variable as columns and the values of the other as rows
histograms
can be used to graph either
data representing discrete categories
data representing scores from a continuous variable
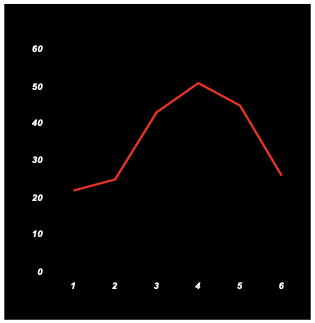
frequency polygon
like a histogram except that the frequency is shown with a dot above the score, with the dots connected.
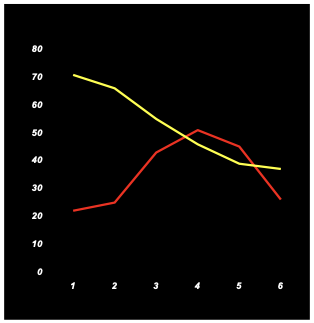
two frequency polygons
can compare two or more frequency polygons on the same scale
easier to compare groups because the graph appears less cluttered than multiple histograms.
If the tail of a distribution is on the right it is _____ skewed.
positively
If the tail of a distribution is on the left it is ____ skewed.
negatively
mode
the most frequently occurring score; easy to compare from frequency distribution.
median
the middle score in a distribution; less affected than the mean by a few deviant scores.
mean
the average; most commonly used central tendency measure.
range
lowest to highest score
average deviation
average distance from the mean
variance
average squared distance from the mean
standard deviation
square root of the variance
When is Pearson product-moment correlation used?
with interval or ratio data
When is Spearman rank-order correlation used?
when one variable is ordinal and the second is at least ordinal
When is Phi used?
when at least one variable is nominal
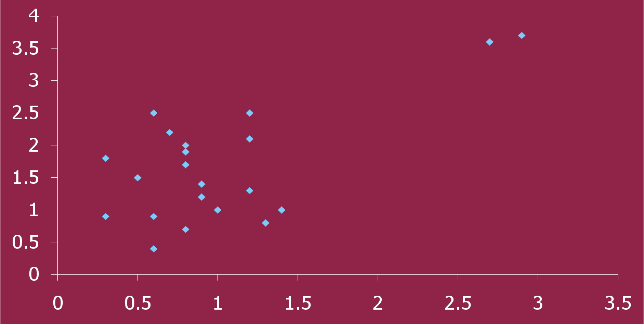
scatter plots
allow you to see the relationship of two variables and detects nonlinear relationships or correlations that are due to only a few outliers.
regression
using a correlation to predict one variable from knowing the score of the other variable; usually a linear (finding the best fitting straight line for the data); best illustrated in a scatter plot the the ___ line also plotted.
standard scores (z-scores)
a way to put scores on a common scale. tell us how much a certain score is above/below the mean. computed by subtracting the mean from the score and dividing the difference by the standard deviation.
inferential statistics
used to draw inferences about populations on the basis of samples
sometimes called “statistical tests”
provide an objective way of quantifying the strength of the evidence for a hypothesis
If the null hypothesis is true but is rejected, what type of error was made?
Type 1 error
If the null hypothesis is false but is retained or failed to be rejected, what type of error was made?
Type 2 error
t-test
tests mean differences of two groups
analysis of variance
tests mean differences in two or more groups
power
sensitivity of the procedure to detect real differences between populations; a function of both the statistical test and the precision of the research design. increasing the sample size increases this.
effect size
indication that the size of the group differences is expressed in standard deviation units; is NOT affected by the size of the sample; large ones are easier to detect than small ones.
Descriptive statistics ______ the data
describe
Inferential statistics are used to draw _____ about population parameters on the basis of sample statistics
inferences
Generalization of research findings can occur only when:
What is observed in the research sample would also be observed in any other sample from the population.
Which type of research has the lowest level of constraint?
naturalistic observation
which type of research has the highest level of constraint?
experimental
unobtrusive observation
observing behavior without participant’s knowledge
participant observation
observing behavior while participating in the situation.
The purpose of control is to:
eliminate alternative explanations for results.
archival records
exist independently of a research study
kept for purposes other than research
may be valuable in some studies
examples: gov’t records, school and hospital records, census data, etc…
access to these may be restricted by legal and ethical constraints
studies can be replicated only if:
the procedures are clearly specified
the procedures were followed exactly
Ex Post Facto Fallacy
interpreting an observed contingency (correlation) as if it represented a causal connection. low-constraint observation will never provide the controls for such strong conclusions.
correlational research
quantifies the strength of the relationship among two or more variables (usually continuous). cannot prove a theory, but could negate a theory.
differential research
compares two or more preexisting groups (e.g., male and female difference studies); variables measured but not manipulated.
developmental research
assesses change over time
longitudinal research
examining a variable over time; ex: brain development, product launches, long-term side effects of medicine.
essentially time-series designs; single subjects are tested repeatedly.
correlational in nature
cross-sectional research
data is collected in one given time point across multiple samples
can test many age groups simultaneously
are faster
but, cohort effects can be a problem.
differential in nature
cohort effects
shared life experiences of people of a given age that lead them to behave similarly to others their age and different from people of other ages.
confounding variables
occurs when two variables vary together
need to have them vary independently, usually by holding all but one variable constant
failing to provide this control could result in artifactual findings (due to the failure to control ____)
comparing groups is reasonable only if we standardized he measurement procedures.
Differential is higher constraint because:
the researcher can select the comparison group(s) to control at least some of the potential confounding variables, thus providing stronger evidence for theory.
when to use correlational method
when we are interested in knowing the strength of a relationship for predictive purposes and often included to help interpret the primary findings of a study.
when to use differential research
when the manipulation of an independent variable is impractical, impossible, or unethical; we rely of comparing preexisting groups.
the larger your sample is, the more ______ it is of the population
representative
experimenter expectancy
researchers tending to see what they expect to see
experimenter reactivity
when researchers unconsciously influence participants
measurement reactivity
participants responding differently because they know they are being observed
which of the following is always used in differential research?
random assignment of participants to groups
the Pearson r or the Spearman r
random selection of participants to ensure a representative sample
groups differentiated on the basis of preexisting variables.
groups differentiated on the basis of preexisting variables.
how to control experimenter expectancy
use more objective measures whenever possible
how to control for experimenter reactivity
minimize experimenter contact with participants
how to control measurement reactivity
use filler items to distract participants
use unobtrusive measures when possible
separate the measurements in time
moderator variable
a variable that seems to modify the relationship between other variables; acts upon the relationship between two variables and changes its direction or strength. (ex: gender, mental health status, medicine for kids but not adults)
coefficient of determination
indicates the proportion of variance accounted for
Example: How much of the variance of weight can be explained by height?

for a confound to be a confound it has to affect the scores on the _____ variable and the groups differ on this variable. (ex. attention spans could be a confound because attention affects memory.)
dependent