AP Statistics Test A - Data Analysis - Part I
1/9
Earn XP
Description and Tags
These flashcards cover key concepts from the AP Statistics Test A, Data Analysis section, focusing on variables, data plots, summaries, and statistical interpretations.
Name | Mastery | Learn | Test | Matching | Spaced |
|---|
No study sessions yet.
10 Terms

What variable is considered quantitative in the context of student data collection?
Grade point average.

Which variable is most likely to follow a Normal model?
Scores on an easy test.
What kind of plot should a professor use to examine the percentage of students receiving different grades?
Dotplot.

What is true about the data shown in the histogram?
I, II, and III are all true.

What is the overall mean score for both sections of students on the quiz?
Approximately 85.0.
If your test score was the 3rd quartile for the class, what does this imply?
You can't really tell what this means without knowing the standard deviation.

What does a z-score of +2.5 indicate about Parker's performance?
Parker is 2.5 standard deviations above average for the class.

What advantage does a stem-and-leaf display provide over a dotplot?
It preserves the individual data values.

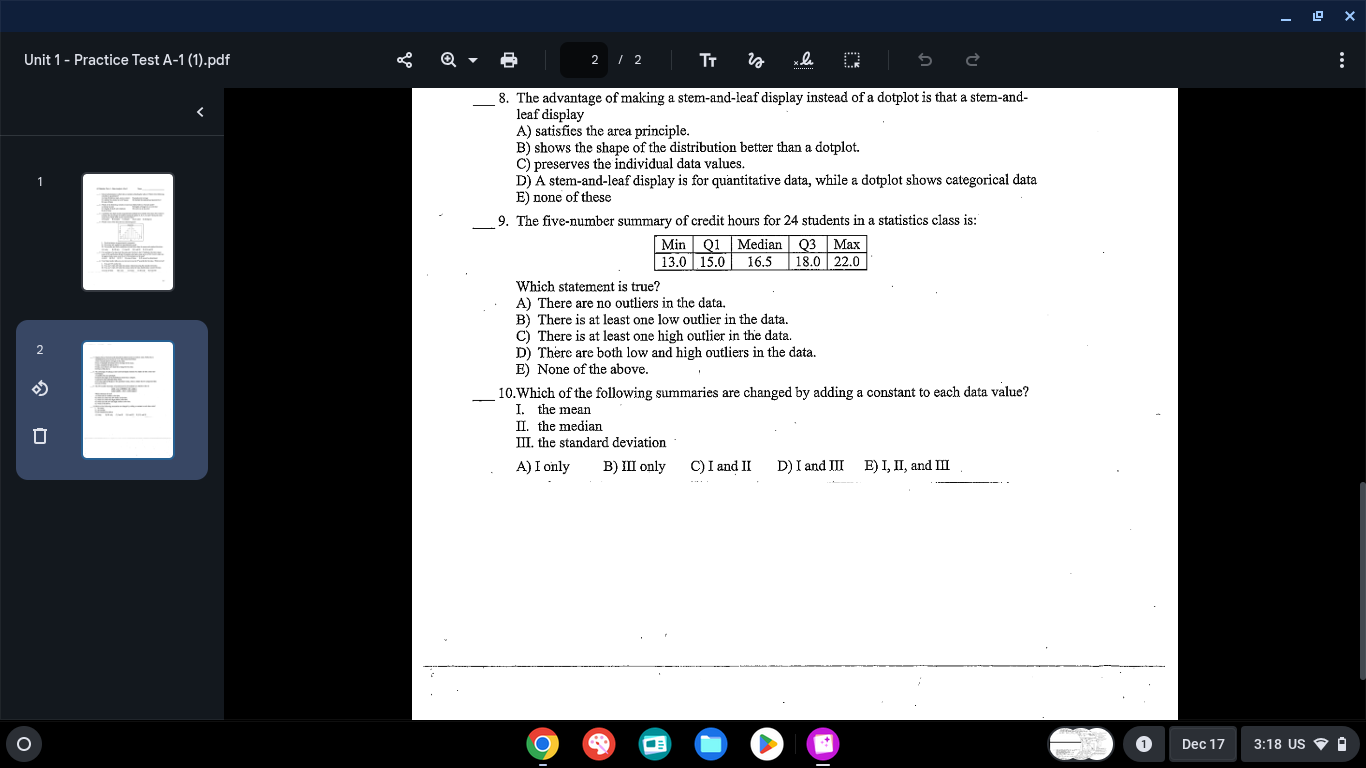
What can be concluded from the five-number summary of credit hours provided?
There are no outliers in the data.
Which summaries change when adding a constant to each data value?
The mean and the median change.