Climate Change Econ
1/45
Earn XP
Description and Tags
ECC3640 - Monash
Name | Mastery | Learn | Test | Matching | Spaced |
|---|
No study sessions yet.
46 Terms
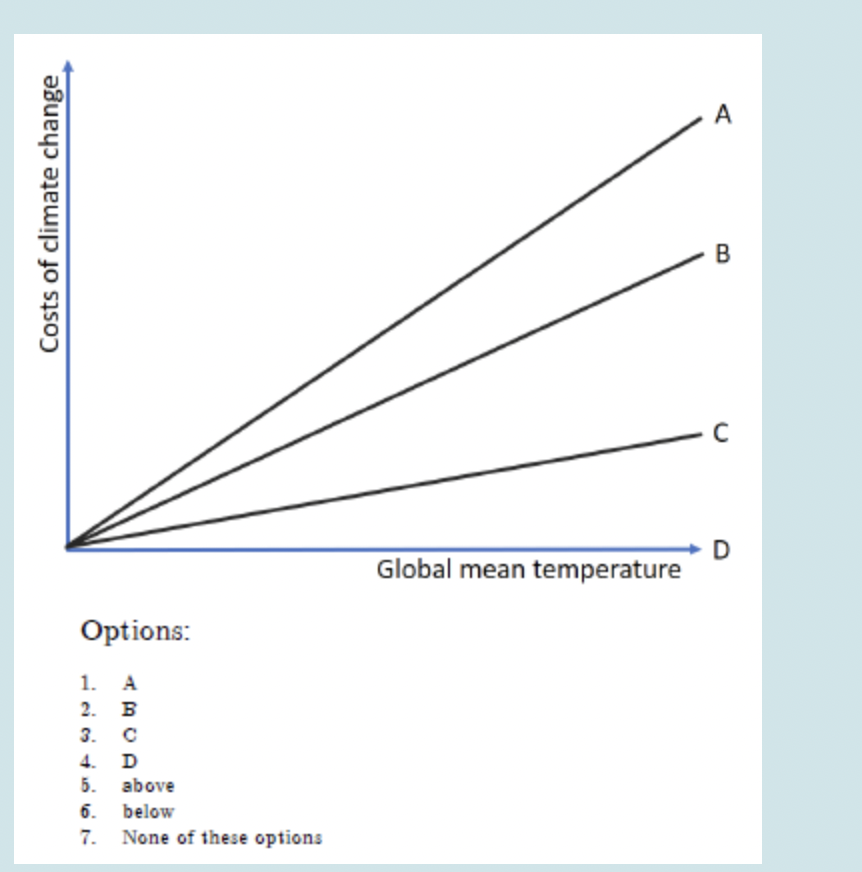
What is Line A, B and C?
A - Cost of climate change without adaption
B - Cost of adaption + residual climate change damage
C - Residual climate change damage

How do you calculate gross benefit adaption and what is it?
Calculate it between line A and C. The gross benefit of adaptation is the difference between the climate damages with and without adaptation.

How do you calculate net benefit adaption and what is it?
Calculated by the difference in line A and B
Net benefit adaptation is the process of determining the total benefits of an adaptation strategy (like protecting homes from sea-level rise) minus its total costs

What is the total cost of climate change, after adaption and how do you calculate it?
Calculated by the difference in line B and D
and its in its name haha
What is Adaptation?
Adaptation means anticipating the adverse effects of climate change and taking appropriate action to prevent or minimise the damage they can cause, or taking advantage of opportunities that may arise. Examples of adaptation measures include large-scale infrastructure changes, such as building defences to protect against sea-level rise,
What is Mitigation?
Mitigation means preventing or reducing the emission of greenhouse gases (GHG) into the atmosphere to make the impacts of climate change less severe. Mitigation is achieved either by reducing the sources of these gases — e.g. by increasing the share of renewable energies, or establishing a cleaner mobility system
What are the types of responses to climate change? (Adaption)
Short run
Long run
Autonomous
Policy Driven
What is short-run autonomous response to climate change?
Making short-run adjustments, e.g. changing crop planting dates
Spreading the loss. e.g. pooling risk through insurance
Like someone deciding a beach holiday instead of snow (lack of snow)
What is long-run autonomous responses to climate change?
Investing in climate resilience if future effects relatively well understood and benefits easy to capture fully, e.g. localised irrigation on farms
An example is In anticipation of Melbourne's summers becoming less and less bearable, your neighbours recently installed an air conditioning system
What is short-run policy-driven responses to climate change?
Developing greater understanding of climate risks, e.g. researching risks and carrying out a vulnerability assessment
Improving emergency response, e.g. early-warning systems
For example, The country fire authority implementing an early bushfire warning system
What is long-run policy-driven responses to climate change?
Investing to create or modify major infrastructure, e.g. larger reservoir storage, increased drainage capacity, higher sea-walls
Avoiding the impacts, e.g. land use planning to restrict development in floodplains on in areas of increasing aridity
For example, The establishment of a drought insurance scheme for farmers that is underwritten by the Government
What is a discount rate? And what line does it relate to? (abatement or damages?)
In climate economics, a discount rate tells us how much we devalue future costs and damages compared to costs and damages happening now. Discount rates only affect damage curves
What does a high discount rate mean? and how does it effect optimal carbon price
We care less about the future → future climate damages look small
a higher discount rate reduces the slope of the marginal damage function, thereby yielding a lower optimal carbon price.
What does a low discount rate mean? And look like on a graph?
We care more about the future → future climate damages look big
So a low discount rate means steeper marginal damage curves — because additional CO₂ in the future is considered more harmful.
What does the abatement line show?
Total cost of mitigation or the cost of reducing emissions.
What does the damages line show?
total damage (or impact) from climate change
What is Nash equilibrium?
Best individual outcome for both
How can you tell if a demand line is a private or public good?
Private good is horizontal sum of demand curves so it is further right and a public good is a vertical sum and it is higher.
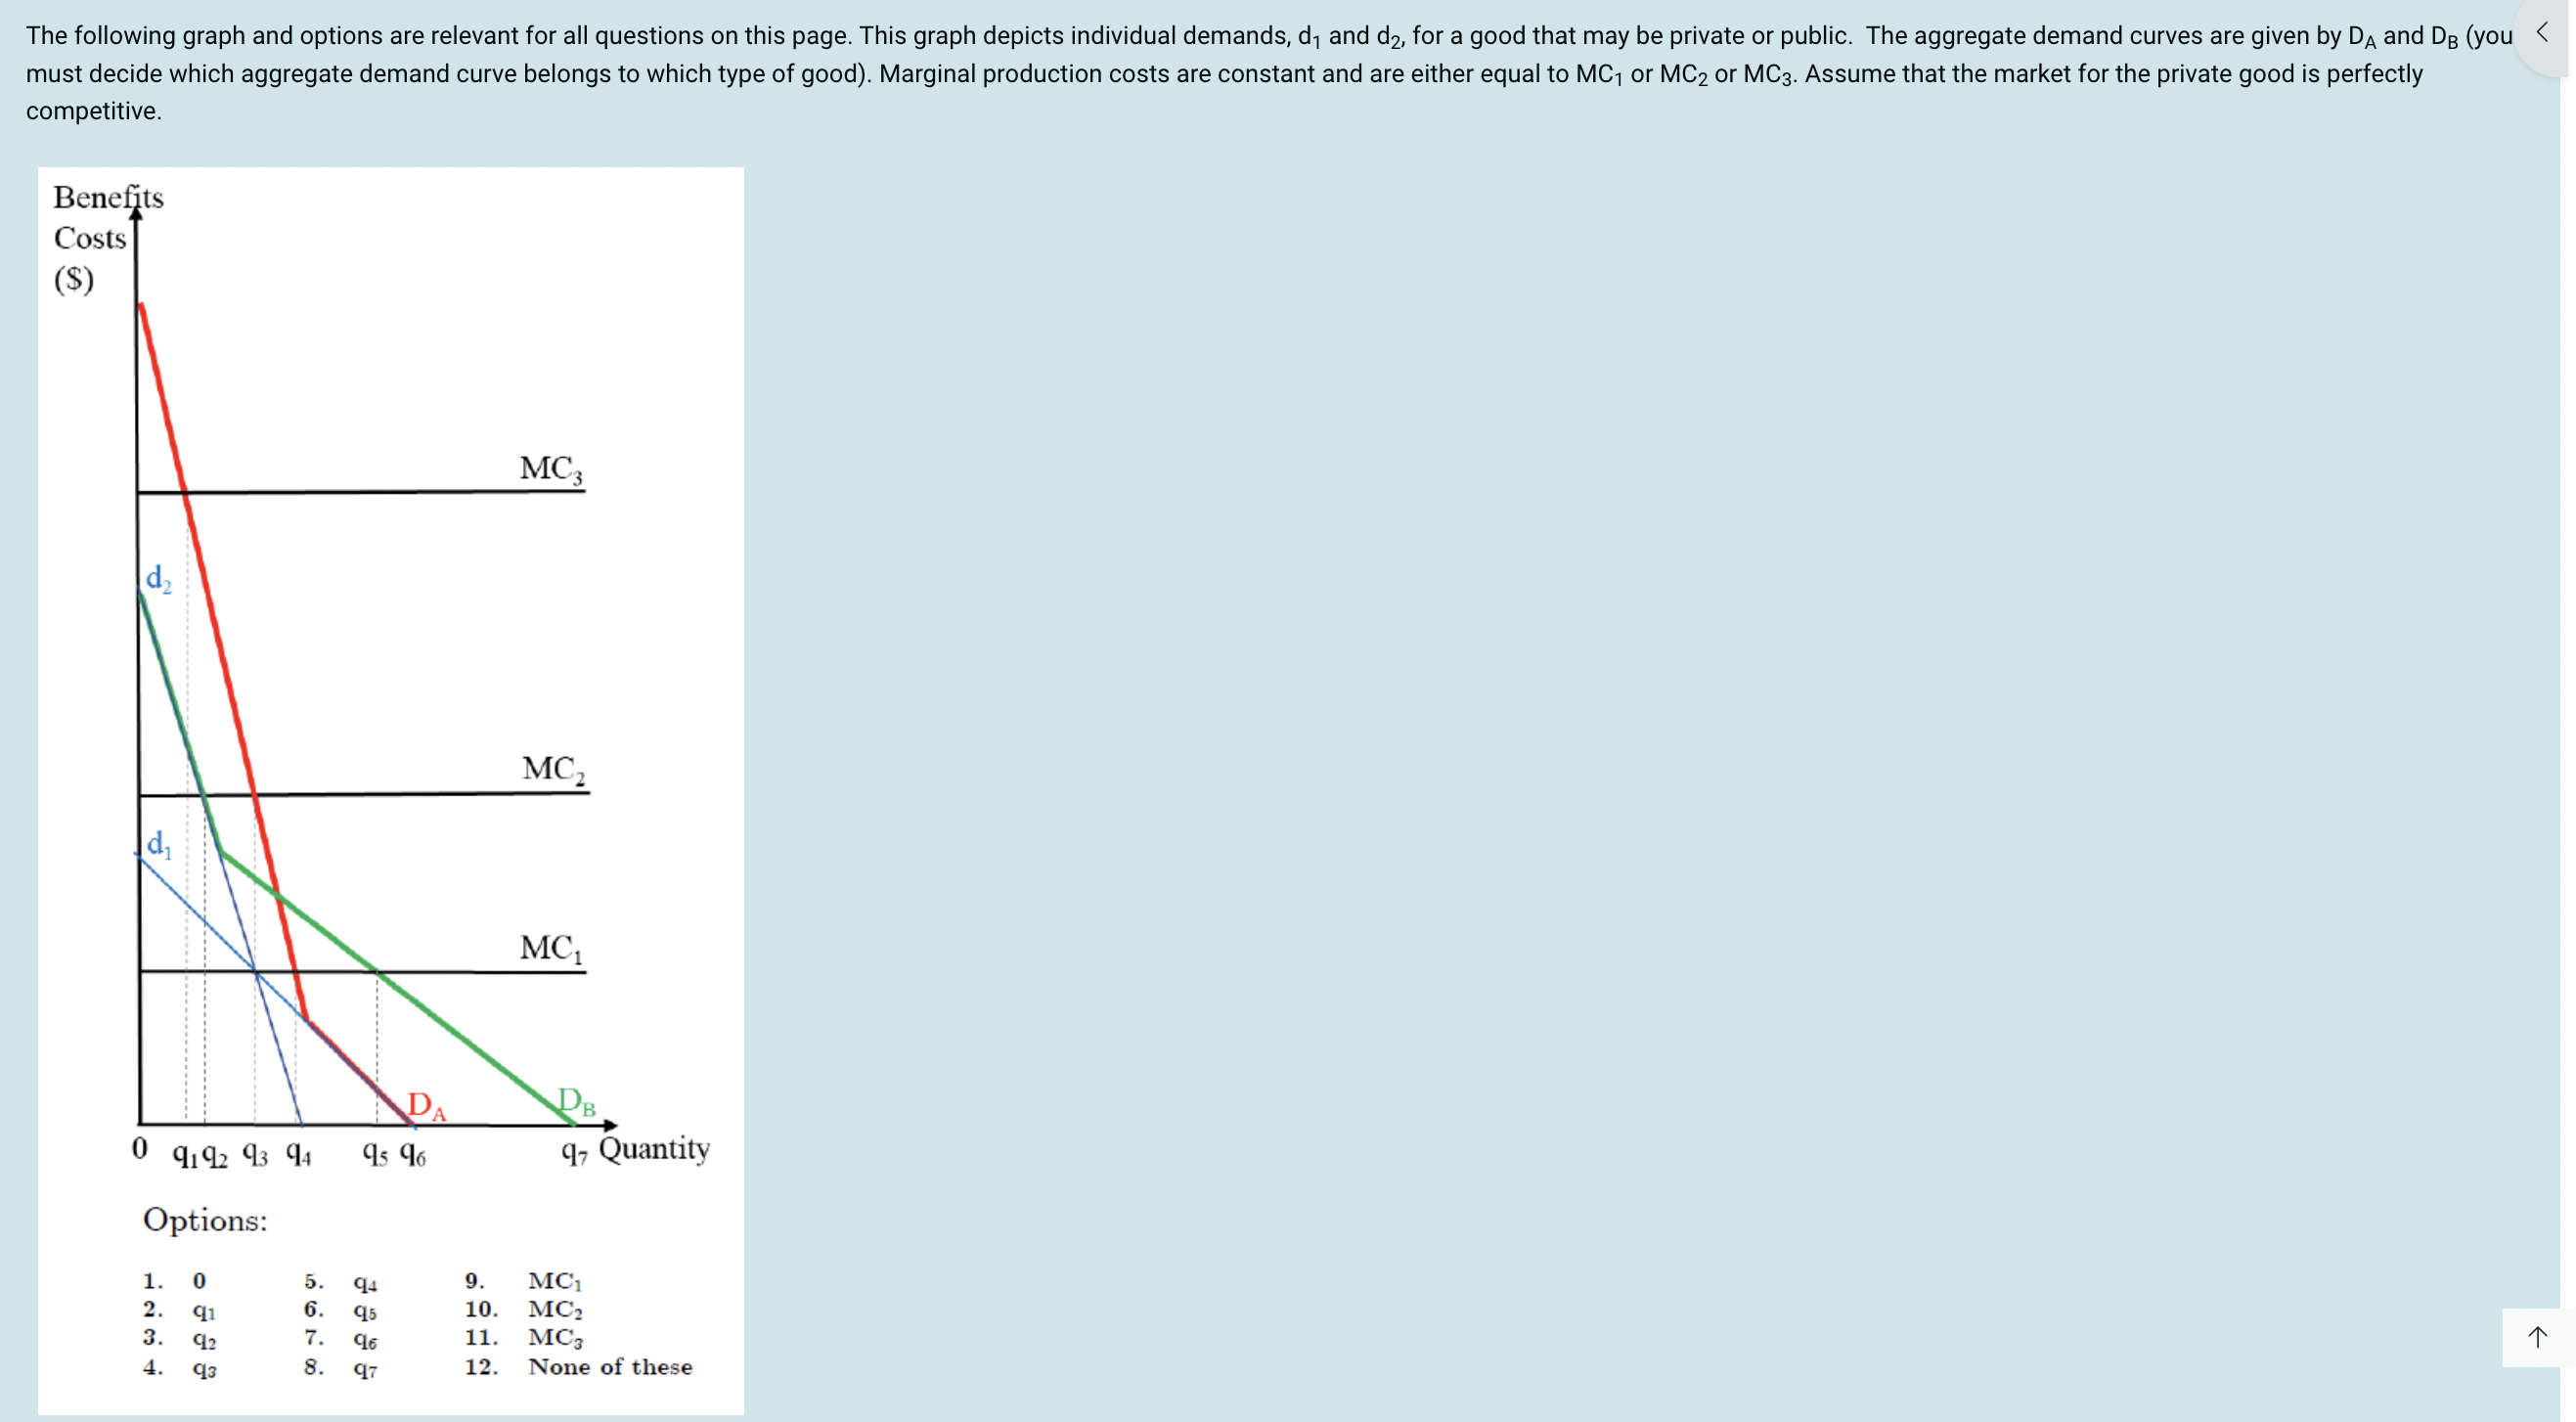
If the good is a private good and the marginal production cost is MC3, individual demands and the market provision of this good will be ____. Select 1 correct option.
DB is the private good. DB doesn’t reach the MC3 line and neither does the individual demand curves. So it is zero.

If the good is a private good and the marginal production cost is MC2 individual demands and the market provision will be ____ . Select 2 correct options.
D2 meets MC2 at q2 and D1 doest meet MC2 so it is q2 and 0

If marginal costs equal to MC1 and the good is private the market will provide _____ at price _____ , which will result in individual demands of ______. Select 3 correct options.
DB meets MC1 at q5 at price MC1. Both the individual demand curves (d1 and d2 meet MC1 at q3)

If marginal cost is MC2 and the good is a public good the socially optimal provision is _____, which results in individual demands of ______. Select 1 correct option.
DA (public good) intersects at MC2 at q3 meaning that q3 is the socially optimal provision.

If everyone else contributes G4, how much will any given individual contribute? Select 1 correct option.
Looking at the best response line, (black line going \), that shows g1 at G4.

In society 2, how much of the public good will be provided by an individual and how much by everyone else? Select 2 correct options.
Society 2 is P2. P2 intersects at the best response line at g2 and G3.
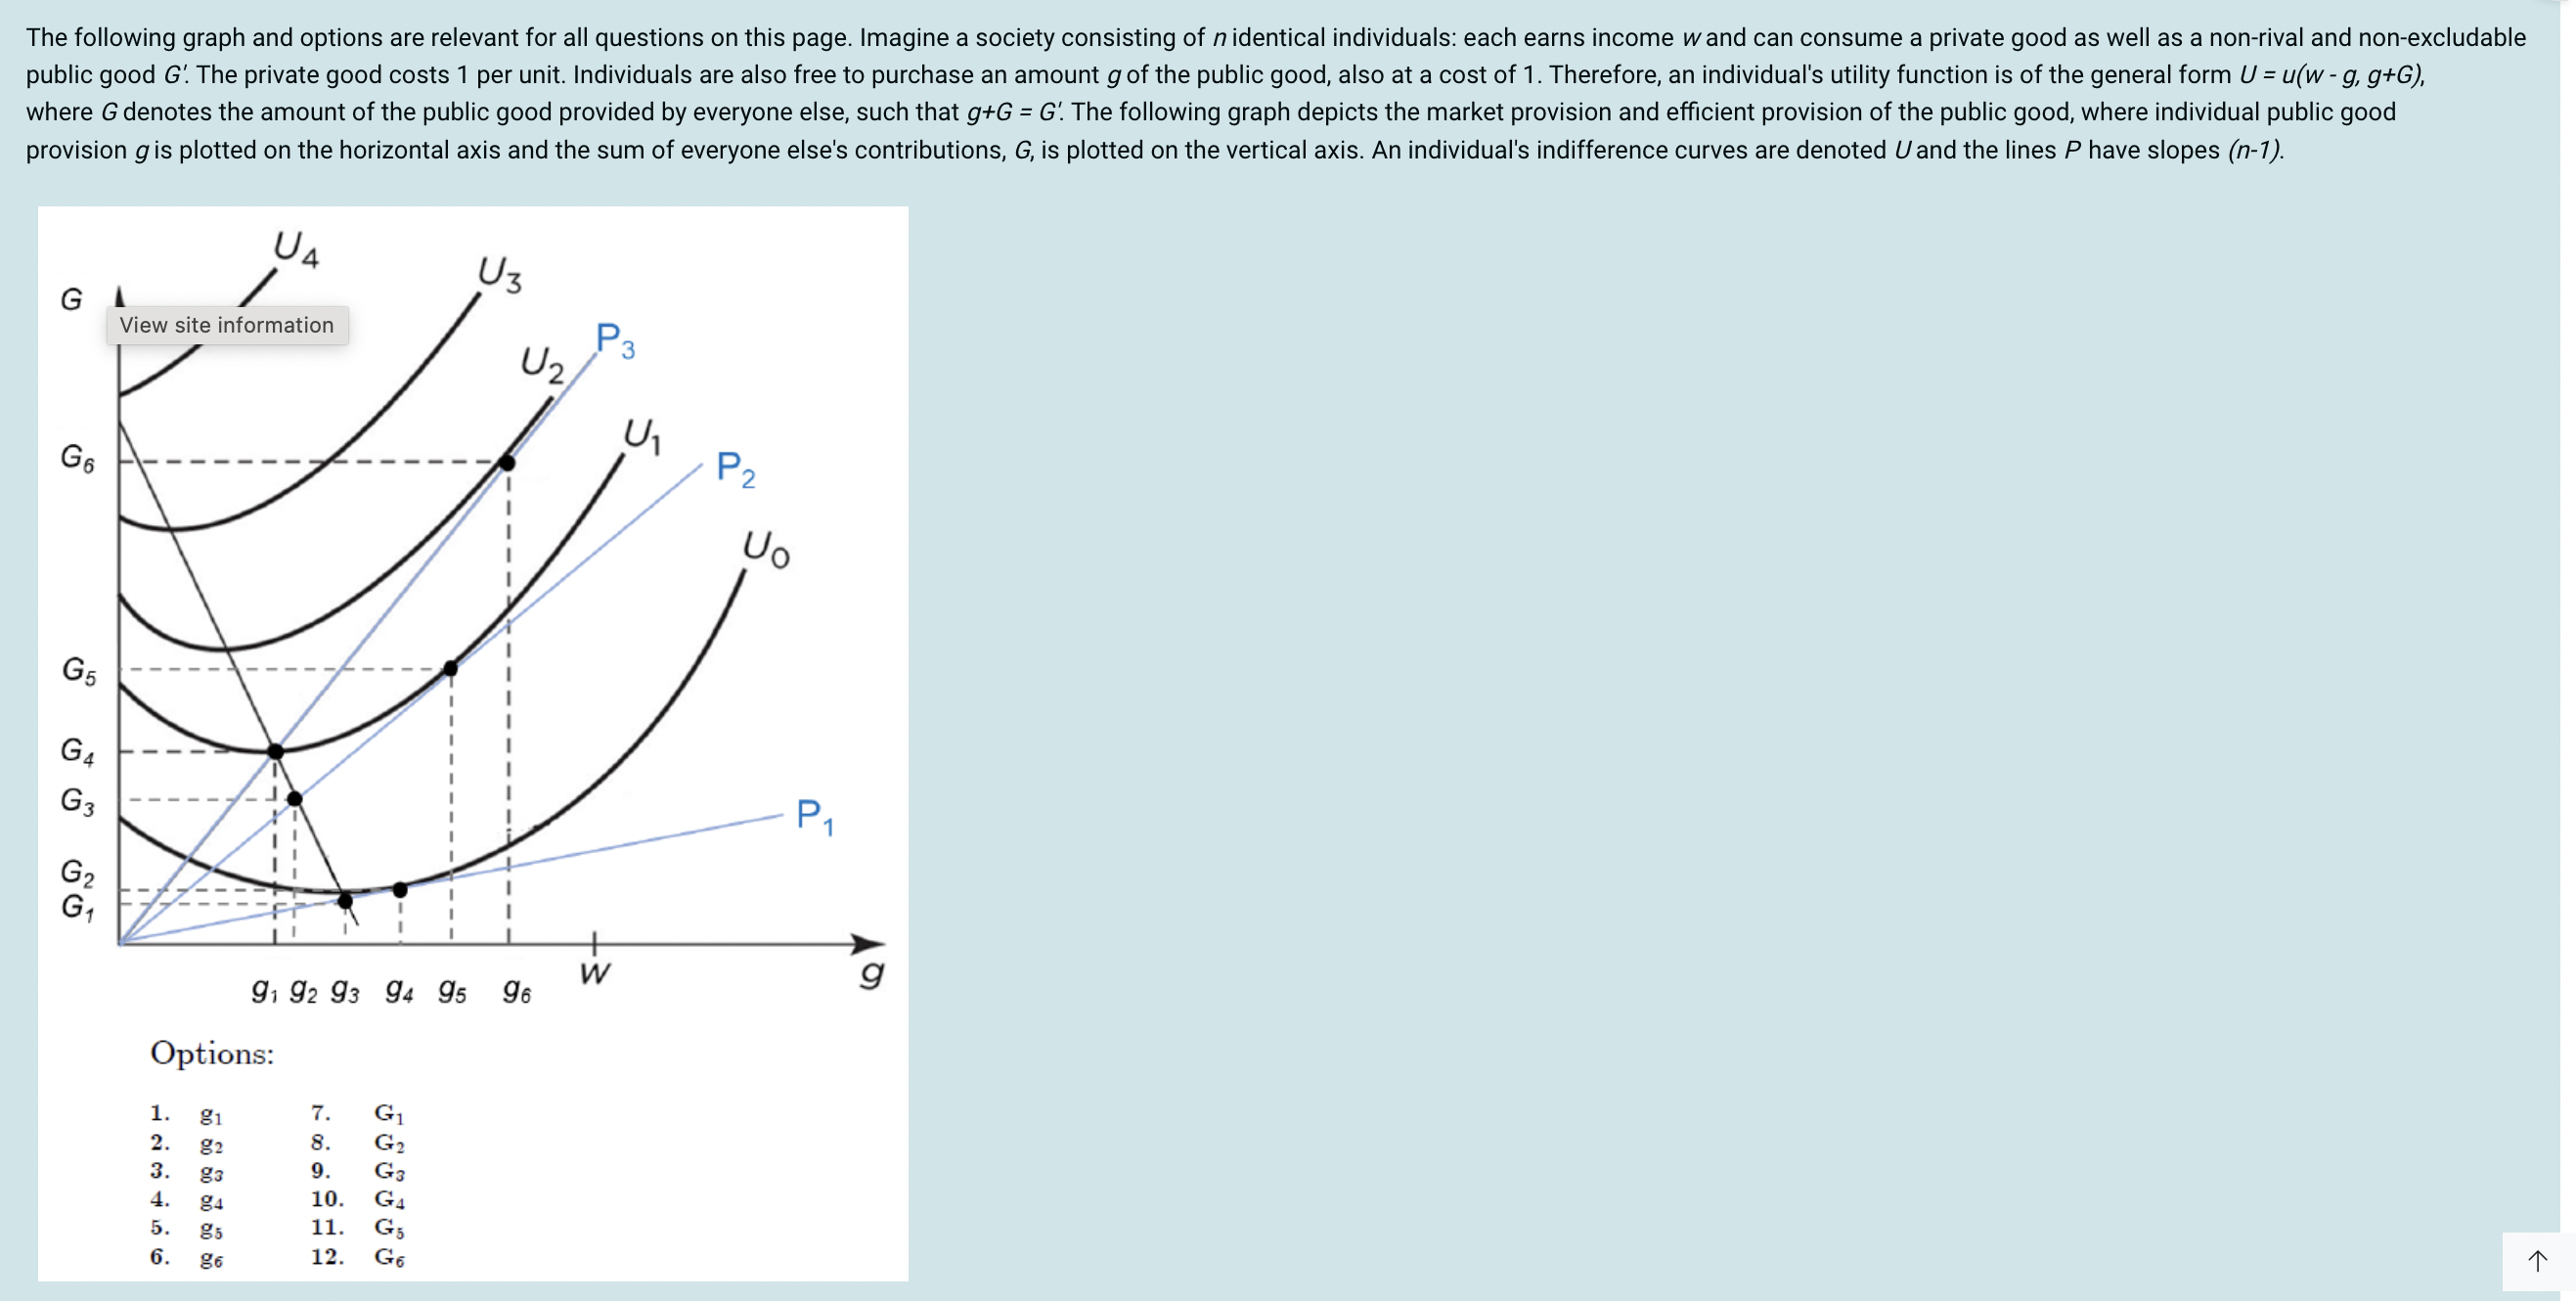
In society 2 what would be the socially efficient provision of the public good by each individual and collectively by everyone else? Select 2 correct options.
P2 touches U1 (utility curve) at q5 and Q5.

Games with a payoff structure as the one in _____ are typically used to describe global climate policy negotiations. Select 1 correct answer.
Game 1 is chosen as there is a clear benefit (1 nash equilibrium) and there are clear losses.
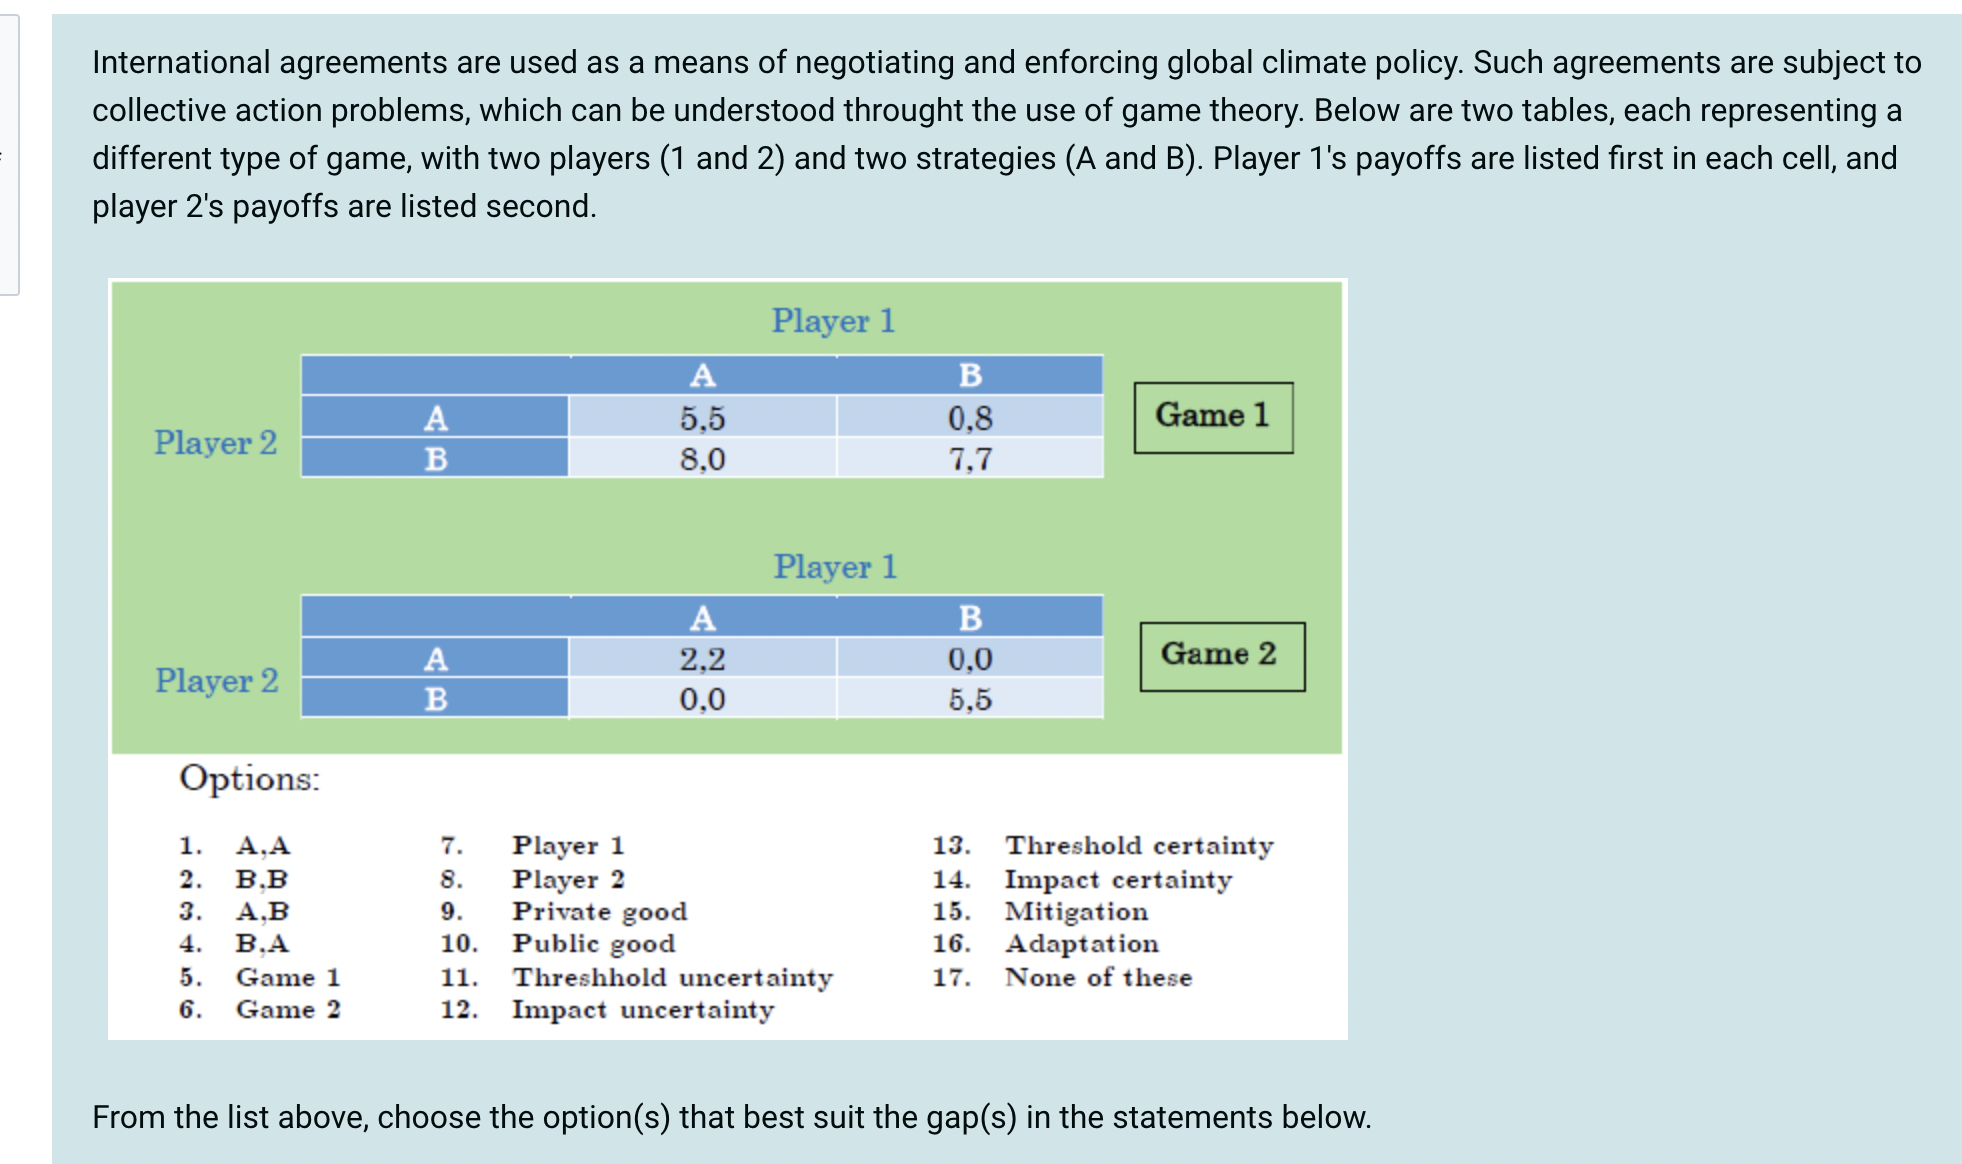
Game 1 and game 2 share a Nash equilibrium at ______, with ______ having another Nash equilibrium at ________. Select 3 correct options.
They share a NE at A,A (best outcome) and Game 2 has another NE at B,B

What are the total industry costs of abatement under an emission standard that is designed to reduce industry emissions to 10 tonnes.
Add the 2 marginal abatements triangles for firm 1 and 2 together = 107.5
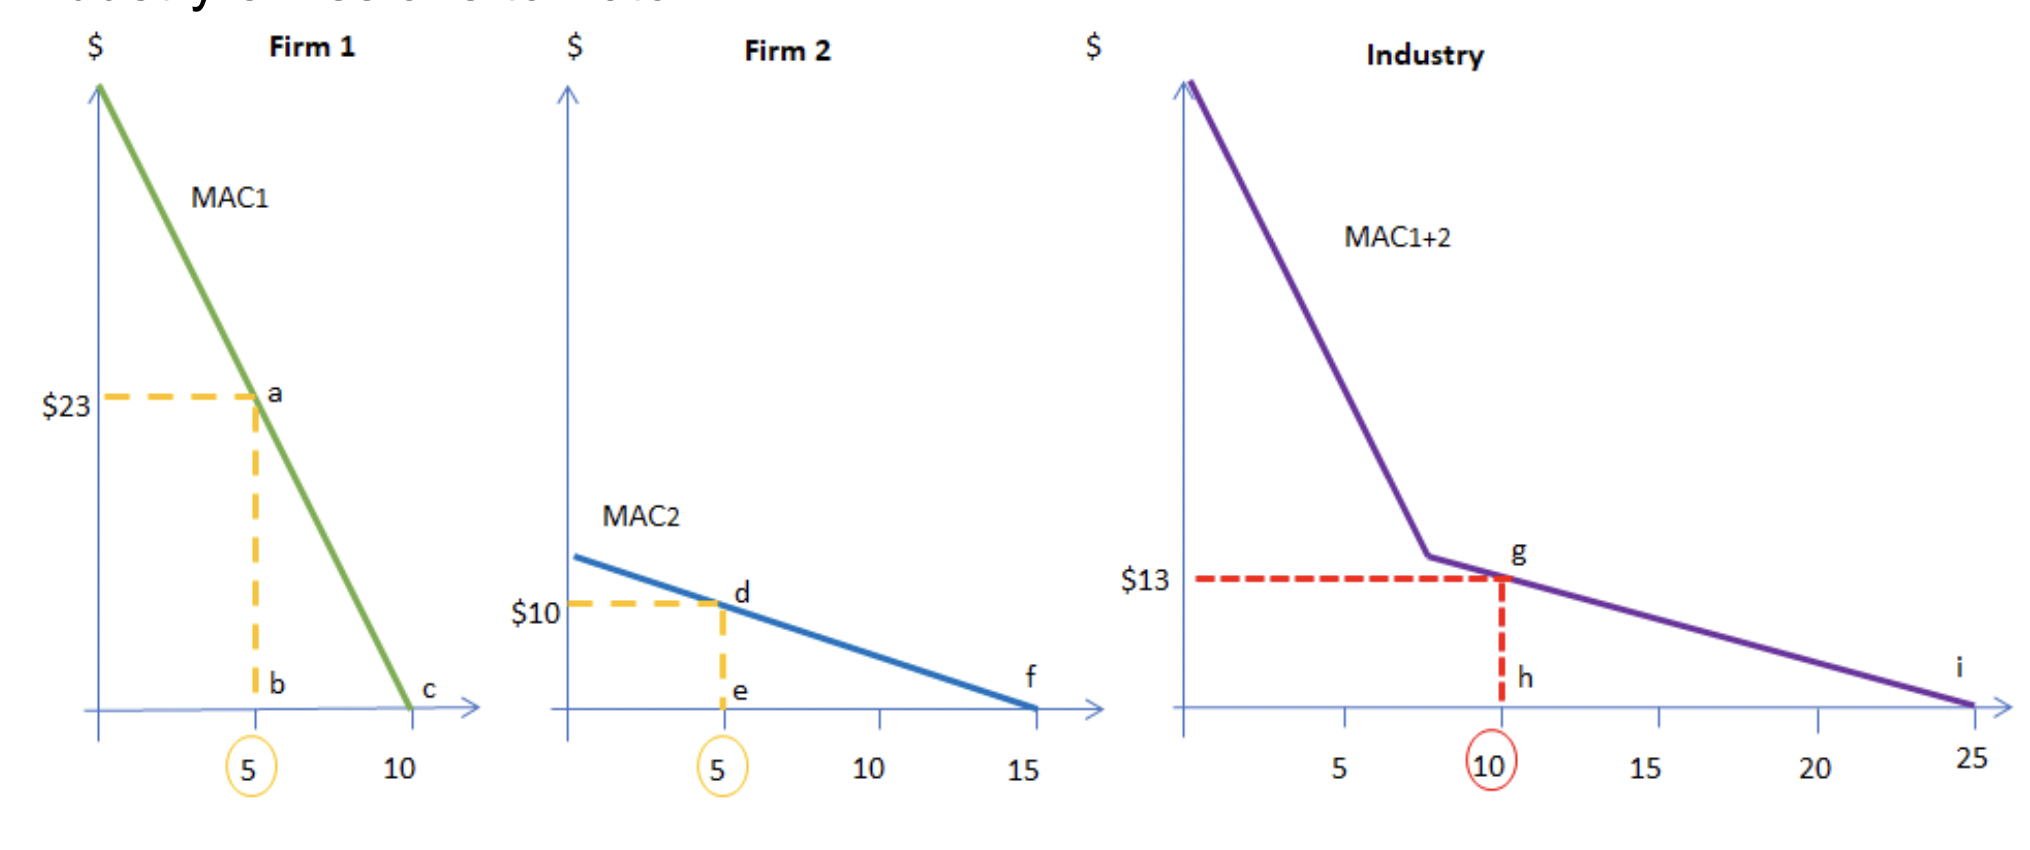
What are the total industry costs from abatement when an efficient carbon tax is imposed to reduce industry emissions to 10 tonnes
Triangle under industry, 97.5
What is a command and control?
Command and control is when emission reduction is split evenly among firms. So for example there are two firms and the industry needs to reduce 20 tonnes, each firm will need to reduce by 10 tonnes.
What is a price based mechanism/instrument?
Price-based mechanism is seeing how the reduction would be efficient for both. For example if emissions need to reduce from 50 to 30 in industry, you see the industry price and apply to firms individually.
What is grandfathering and how does it relate to a price based mechanism?
Grandfathering is when you reduce all firm emissions by the same ratio as the industry emissions. Say emissions need to reduce from 50 to 20, that is a 2/5 reduction. Both firms will receive permits for 2/5 reduction of their original emissions. Grandfathering is just the allocation of permits, price based mechanism is how the firms will actually split their emissions.

The expected policy outcome is ___ tonnes at a marginal abatement cost of ___$/to. (Select two correct options)
P4, Q4 (point J)
The expected line, as said in the question is the higher MC curve and the expected policy outcome in the intersection of MD and MC (point J)

If the policy maker implements a carbon tax, the actual policy outcome is a carbon price of ____$/to and an emission quantity of ____to. (Select two correct options)
P4, Q1
The regulator sets a carbon tax equal to the expected optimal marginal cost — that’s P4.This means firms pay $P4 per tonne emitted. They look at their actual (realised) MC curve (the lower one). That intersection is at point b, corresponding to Q1.
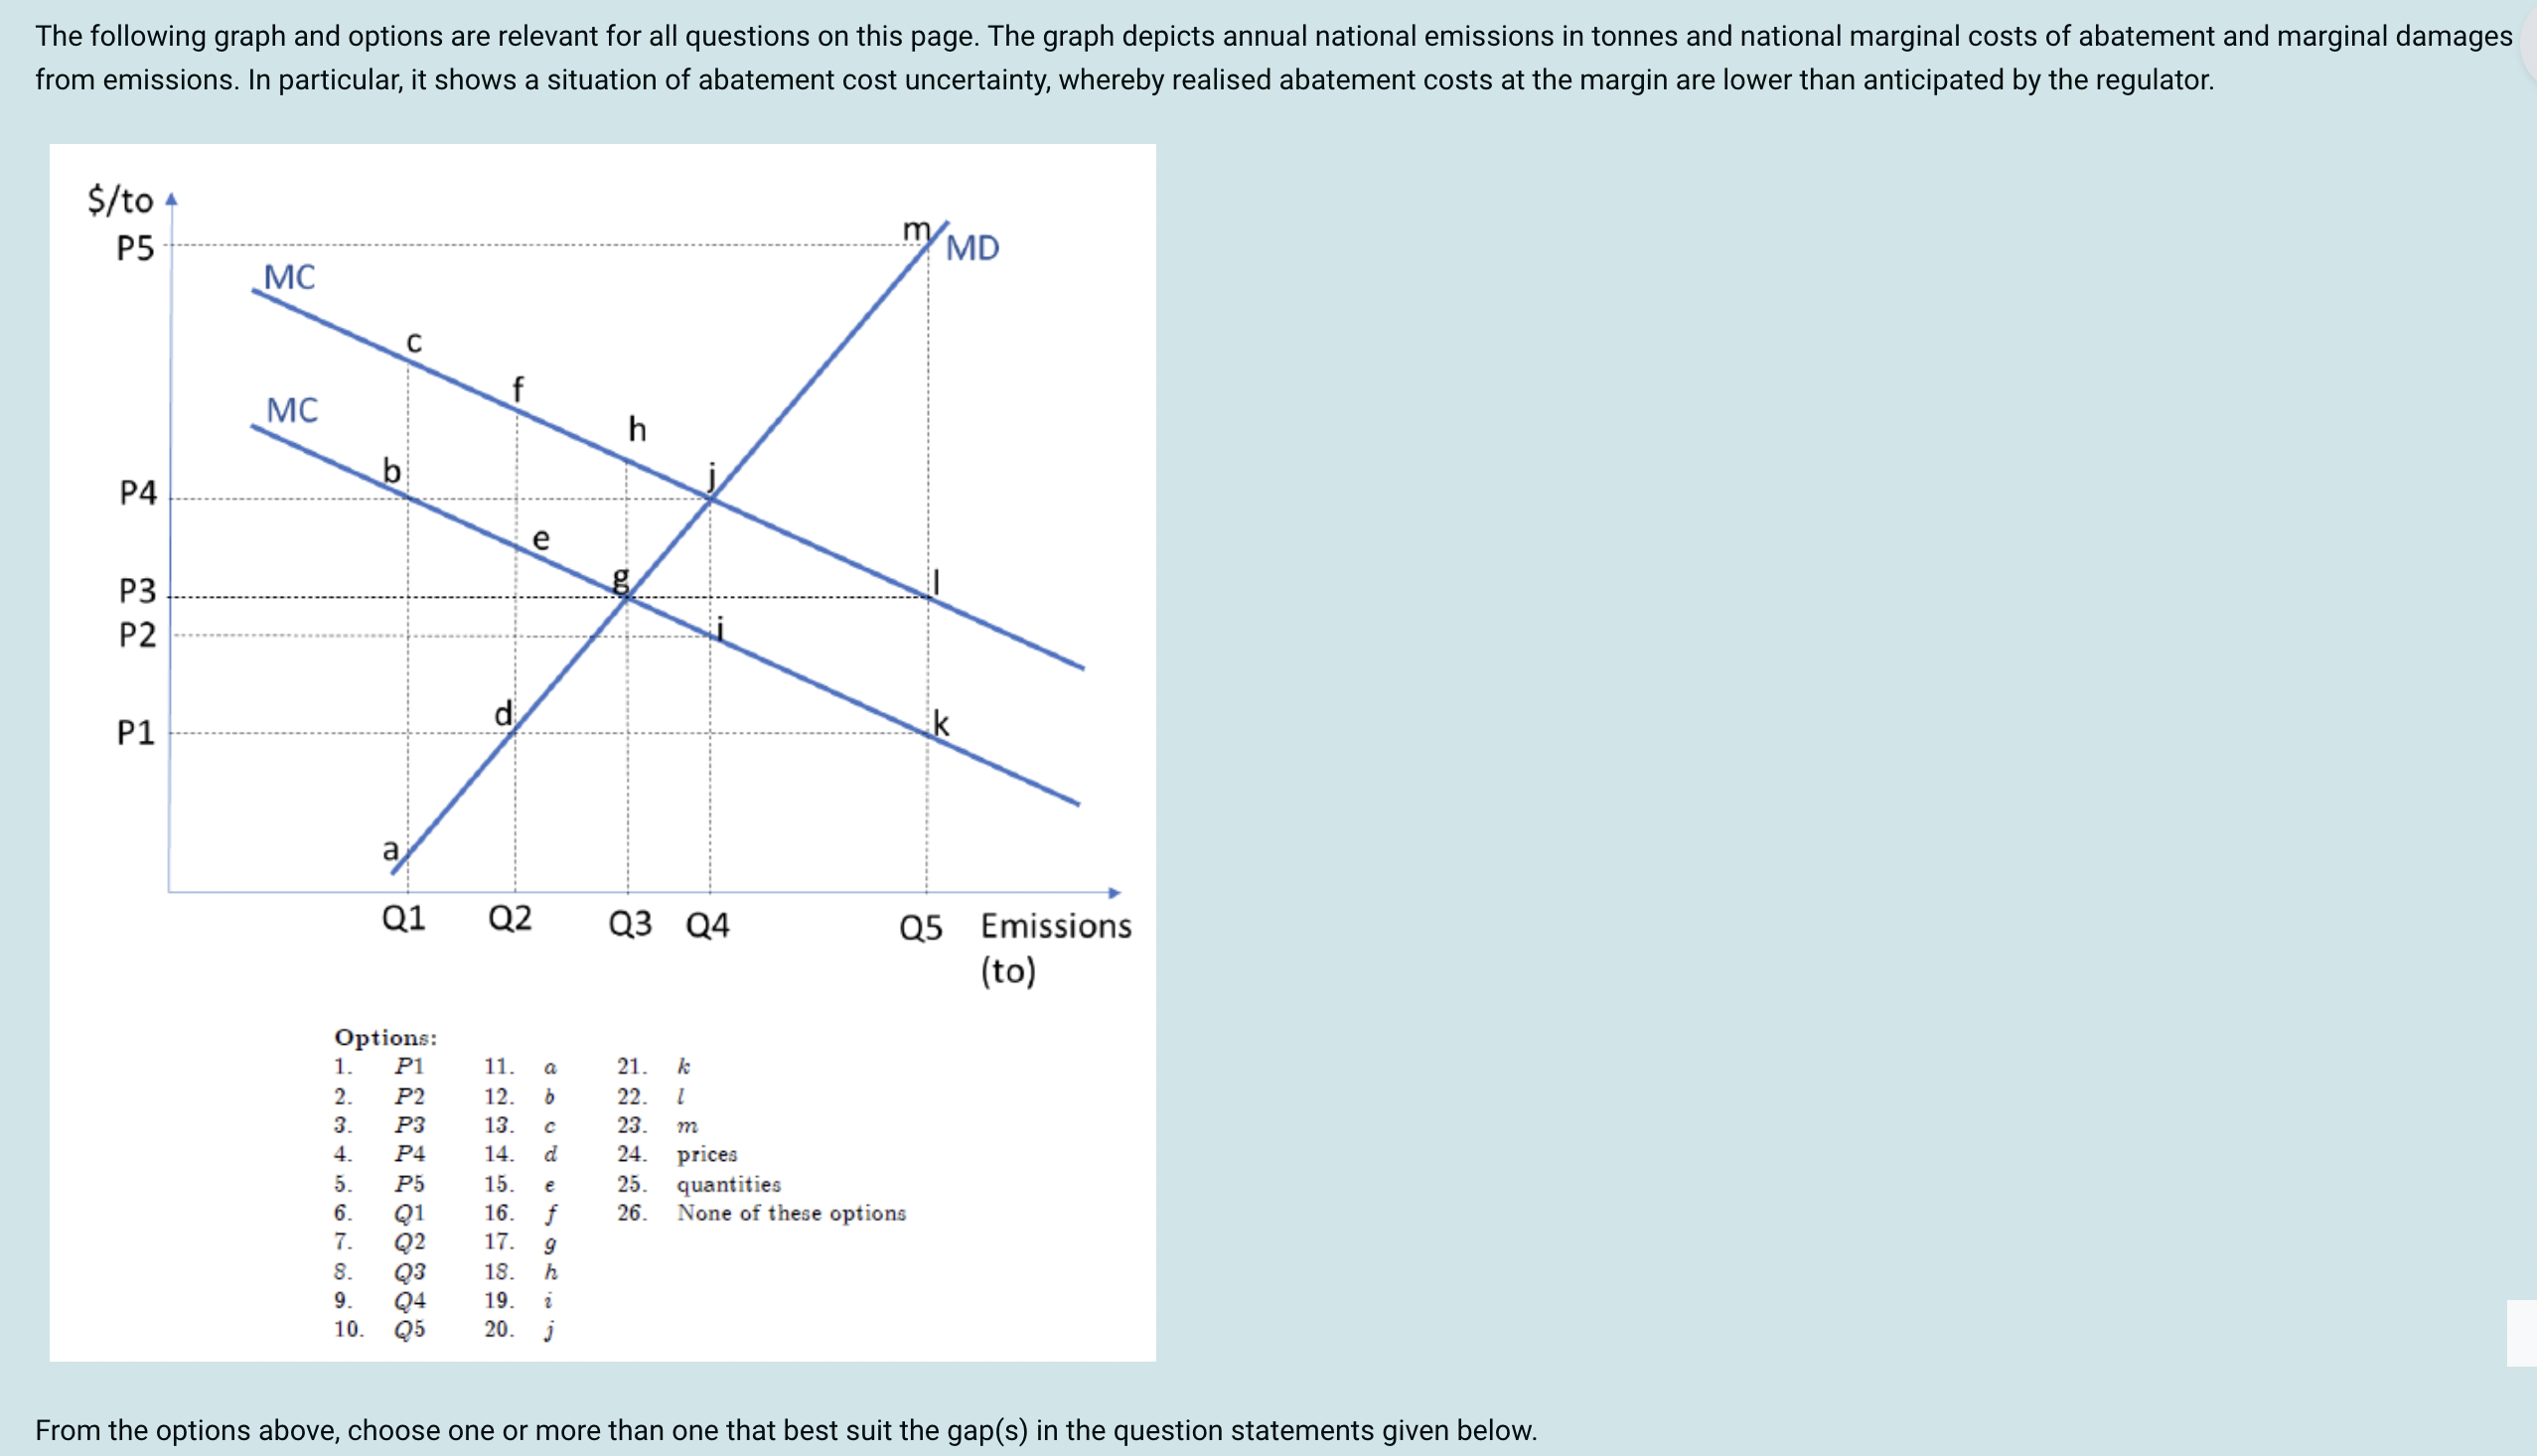
The inefficiency from the carbon tax under abatement cost uncertainty is given by the area ____. (Select three correct options)
A,b,g
Between Q1 (actual emissions under tax) and Q3 (true efficient emissions).
Within that range:
The MD curve represents the benefit of emitting more (reduces abatement costs).
The realised MC curve represents the cost of emitting more (more pollution).
So the welfare loss = the area between MD and realised MC from Q1 to Q3.
That’s the small triangle labeled a–b–g

If the policy maker directly regulates the quantity of emissions, the actual carbon price will be ____$/to of emissions and ______to will be emitted. (Select two correct options)
P2, Q4
Instead of a tax, the regulator sets a quantity cap equal to the expected efficient level — Q4. This might be, for example, an emissions trading cap. Go vertically up from Q4 until you hit the realised MC curve (lower MC).
That intersection is point i, where the price is P2.

The inefficiency from an emissions trading scheme under abatement cost uncertainty is ____. (Select three correct options)
G,i,j
The cap forces emissions = Q4, but the true optimal level is Q3 (less emissions). So the market emits too much (Q4 > Q3).
The welfare loss = the area between realised MC and MD from Q3 to Q4.

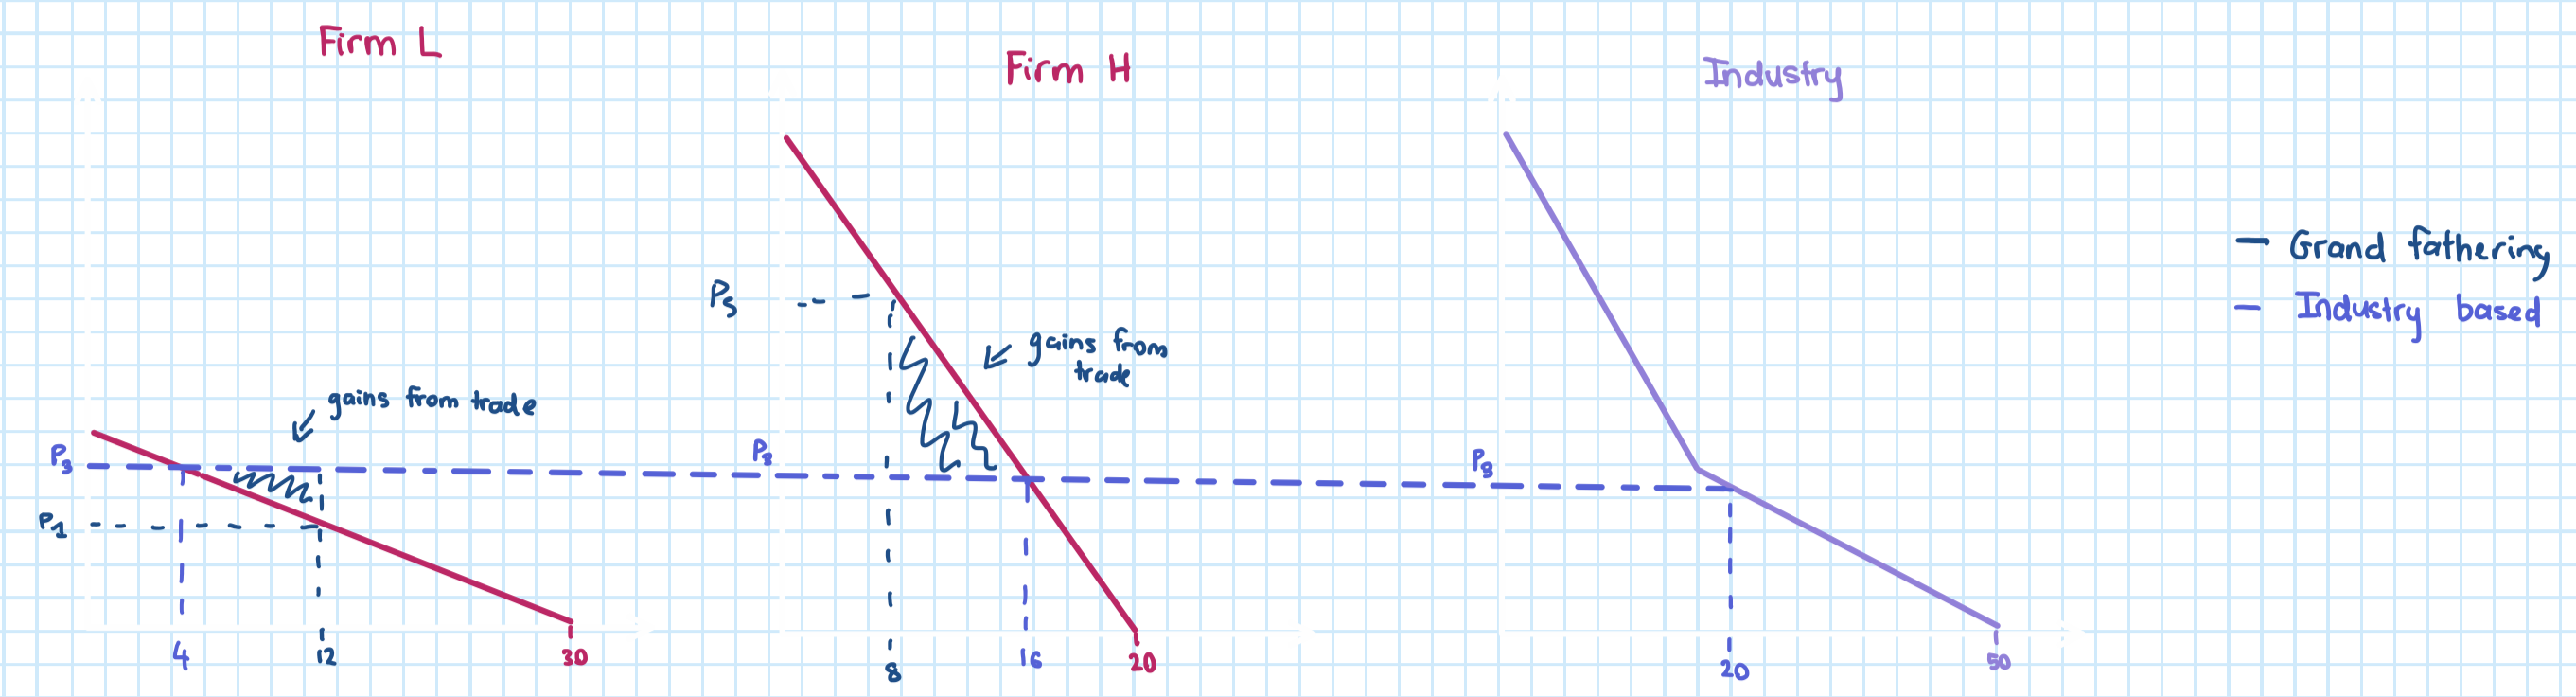
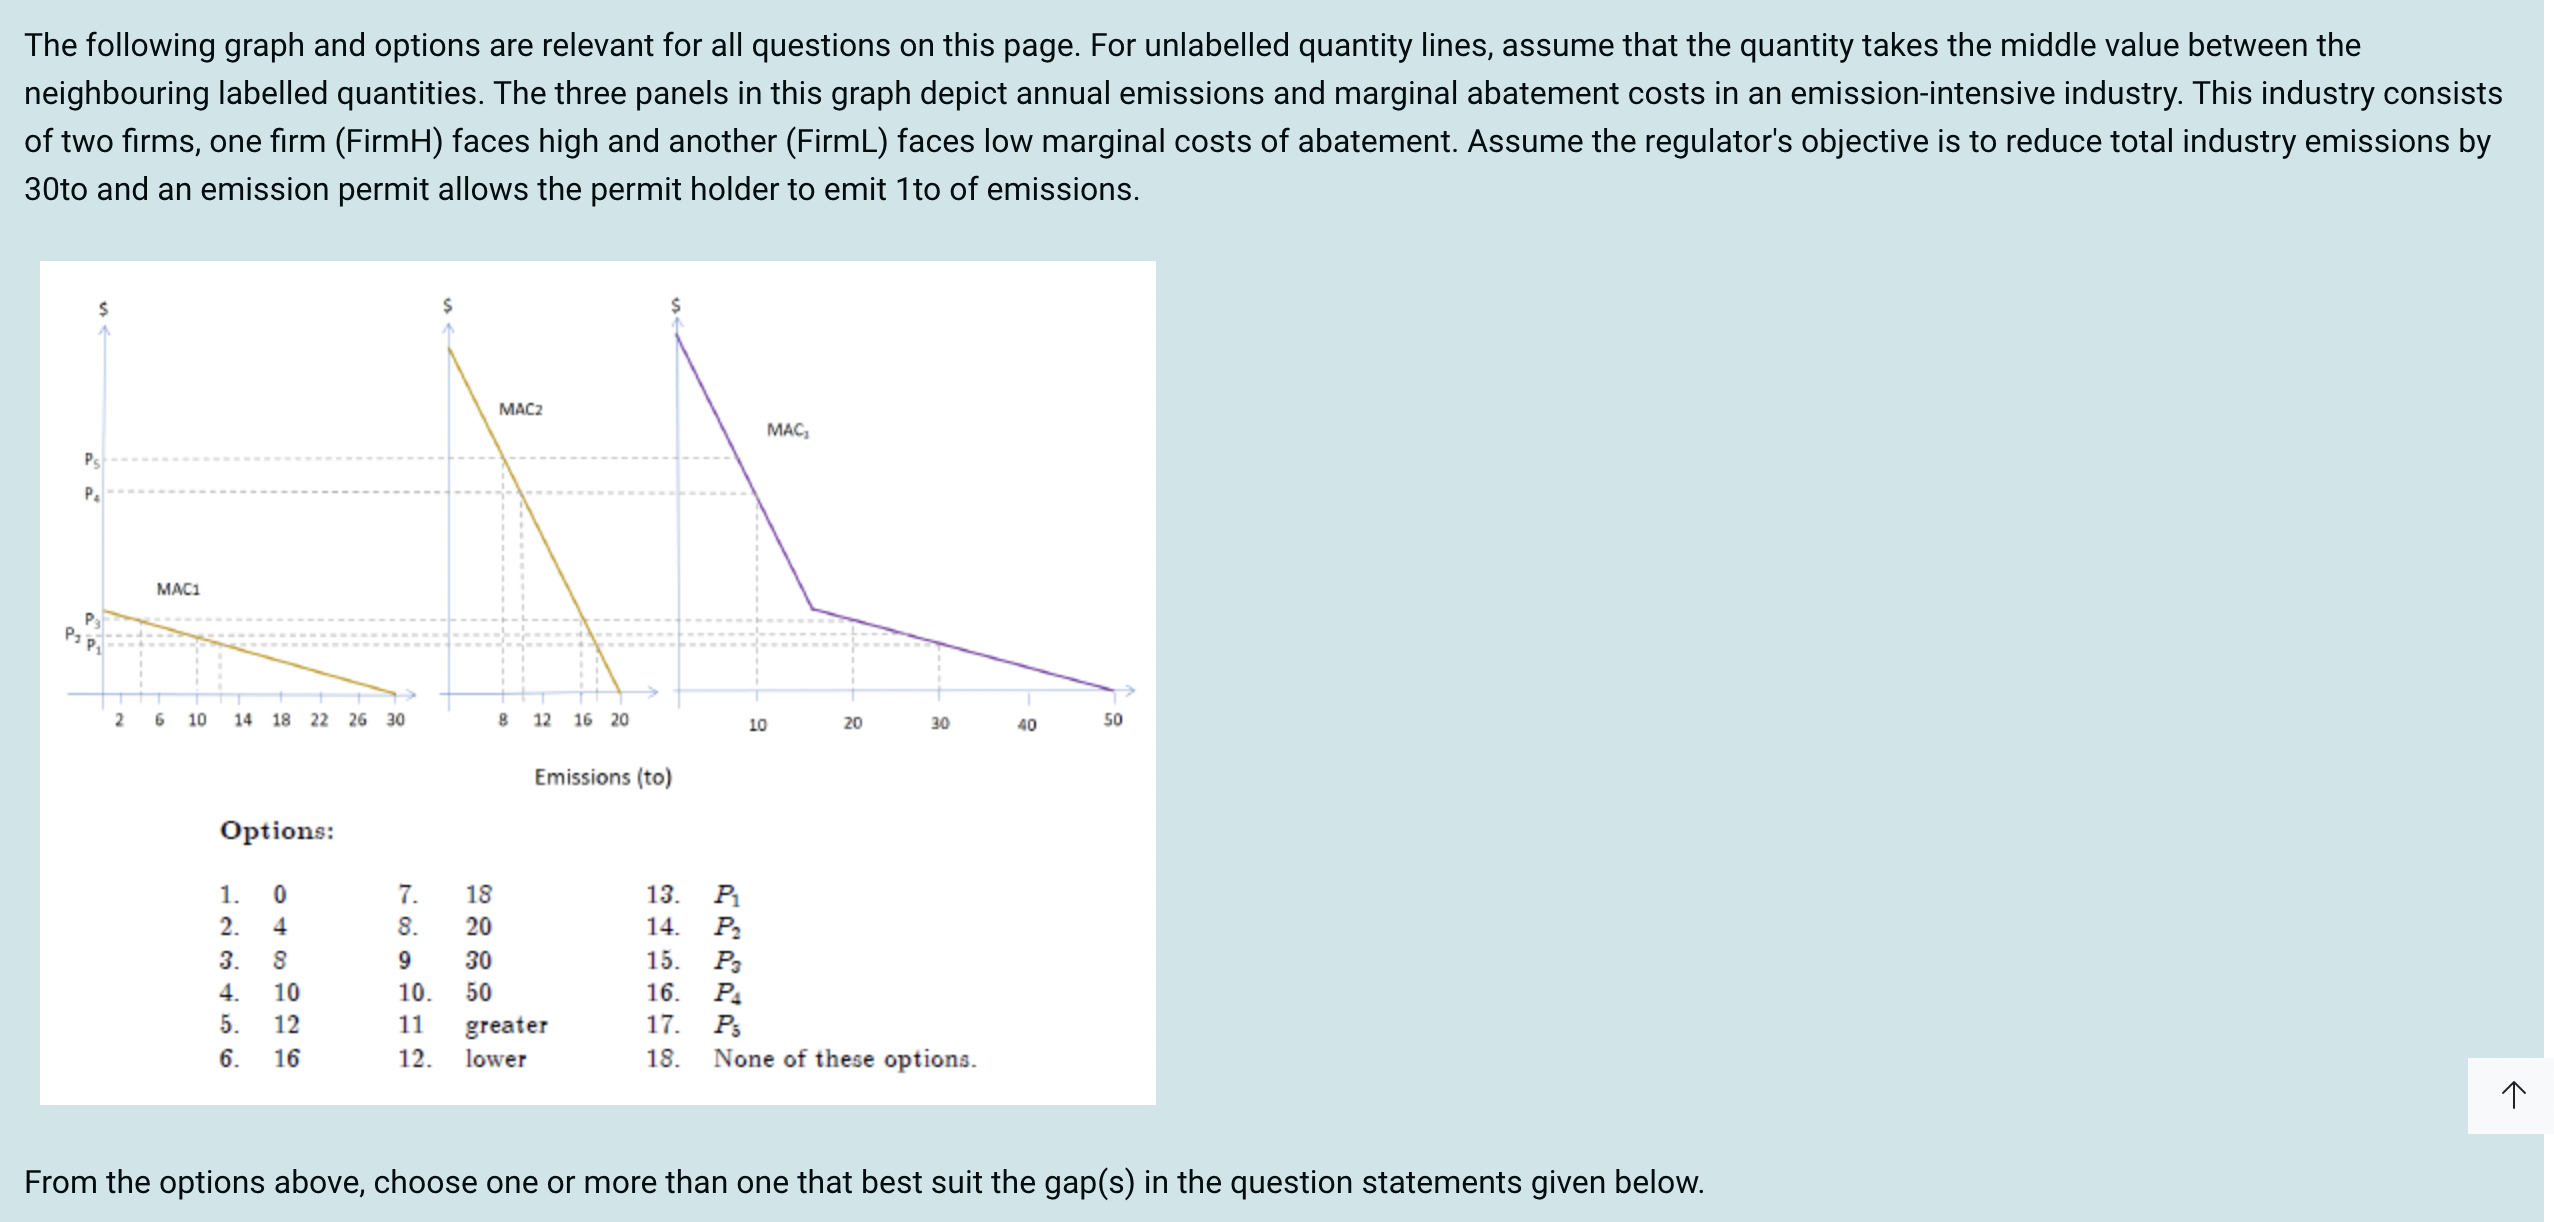
Without regulation, Firm H and Firm L in the industry emit _____ and ____ tonnes respectively. (Select 2 correct options)
30 and 20
Looking at the x axis for the left graph (firm L) emits 30 and the middle graph (firm H) emits 20

Under command and control regulation Firm L will emit ____tonnes at a marginal cost of ____, while Firm H emits ____tonnes at a marginal cost of _____. (Select three correct options)
10, P2, P4
So currently Firm L and H together emit 50 emissions. They want to reduce emissions by 30 to 20 tonnes. Under command and control this would be split evenly so each firm needs to reduce by 10 tonnes. Looking at Firm L's graph on the left, at 10 tonnes, MC is P2 and for Firm H at 10 tonnes, MC is P4

Under a price-based mechanism, Firm L emits ____tonnes, has a total carbon tax bill of ____x_____ and spends 0.5x____(____-____) on emission abatement. (Select three correct options)
Looking at the industry when there is 20 carbon emissions will show you the most efficient reduction for firm L and H. At 20 emissions, the cost is P3. P3 for firm L is when it emits 4 carbon tonnes. The carbon tax bill is the shaded diagram in orange which is given by P3 x 4. The abatement is the green triangle which is calculated by 1/2( P3 *(30-4))
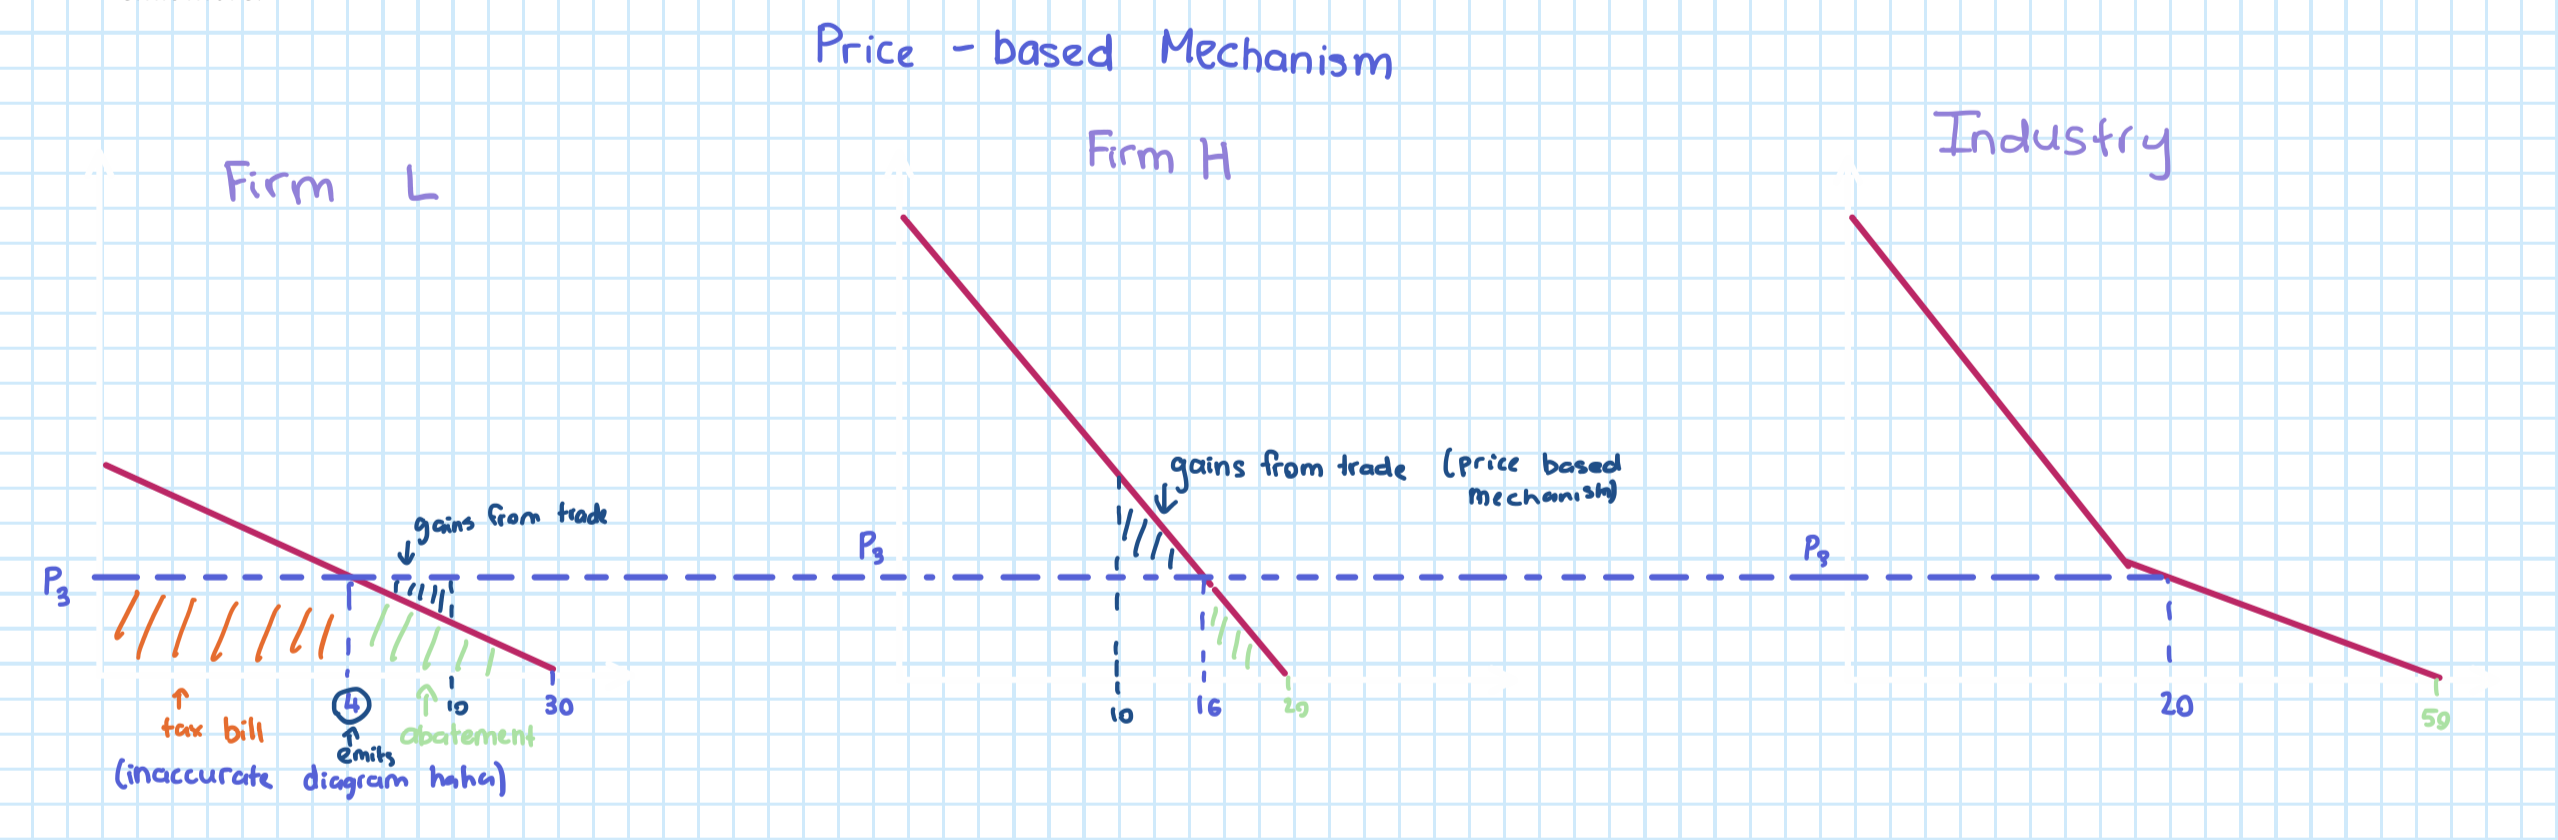

Considering transfers and abatement costs Firm L's total costs due to regulation are _____ when a price-based instrument is used than when regulation follows a command and control approach. (Select one correct option).
Greater as under a price based mechanism it pays P3 and abates 26 tonnes and under a C and C it pays P2 and abates 20 tonnes.

Firm H's total costs from command and control regulation are 0.5x____(____-____) and it has a _____ abatement cost at the margin than if an optimal carbon tax were imposed. (Select four correct options)
10,20, P4, greater
Looking above, the total abatement costs for command and control are in the green and it is 0.5 x P4(20-10). Compared to the triangle in C and C and under price-based, command and control has a greater marginal abatement cost.

If emission permits are grandfathered FirmH receives ____ and FirmL receives_____permits. (Select two correct options)
8 and 12
Looking at the industry emissions, which was originally 50 but now has to decrease by 20. So the emissions have to reduce 2/5 from the original amount (that’s the permits they will receive). This 2/5 original reduction is applied to both Firm H and L. 2/5 from the original amount for firm H (20) is now 8 emissions. So firm H will receive 8 permits. 2/5 the original amount for Firm L is 12, so firm L will receive 12 permits.
Under a grandfathered cap and trade scheme FirmL will emit ____tonnes at a marginal abatement cost of _____ and transacts in the market to _____ its permit holding by _____. (Select four correct options)
Emits 4 and a marginal abatement cost of p3 (as seen above in the price mechanism as the emission is still the same but under grandfathering Firm L receives more permits. It does get 12 permits so it can reduce its permit holding by 8.

In equilibrium the market price per emission permit is ____ and a total of ____ tonnes will be emitted by the industry. (Select two correct options)
P3, 20
So this is just the same as the price-based mechanism, looking at the industry graph, when there is 20 tonnes reduces, this costs P3

Under a grandfathered cap and trade scheme the gains from trade for FirmL are given by 0.5x___(____-____). (Select three correct options)
8, P3, P1
The gains from trade are seen in blue below. To find the area of the triangle it is 0.5 (12-4)(P3-P1)=0.5 8(P3-P1)