Averages and quartiles - including frequency tables and box plots
1/15
There's no tags or description
Looks like no tags are added yet.
Name | Mastery | Learn | Test | Matching | Spaced | Call with Kai |
|---|
No study sessions yet.
16 Terms
mean
add all values, divide by number of values
how to find mean from a frequency table
multiply each item by its frequency, divide by total frequency of all items
how to find find (estimated) mean from a grouped frequency table
find midpoint between values in each class, multiply by frequency, divide by total frequency of all items
median (Q2)
middle number (in a list of numbers in order)
how to find median from a frequency table
1. find total frequency
2. add 1, divide by 2 to find the median frequency
3. find cumulative frequency
4. find result which contains the median frequency
how to find the class interval containing the median
1. find total frequency of all items
2. find median of total frequency (add 1, divide by 2)
3. find cumulative frequency
4. from cumulative frequency, find the class which the median is included in
5. write this class interval as the answer
mode
most common number
can there be multiple modes or no mode?
yes
how to find mode from a (grouped) frequency table
find the item/class interval with the highest frequency
range
difference between highest and lowest values
how to find range from a grouped frequency table
find midpoints of highest and lowest classes, find the difference from them
cumulative frequency table
table with a running frequency (adding up the frequencies as you go down the list)
lower quartile (Q1)
value 1/4 along list of data, median of lower half of data
upper quartile (Q3)
value 3/4 along list of data, median of upper half of data
interquartile range
range/difference between upper and lower quartiles
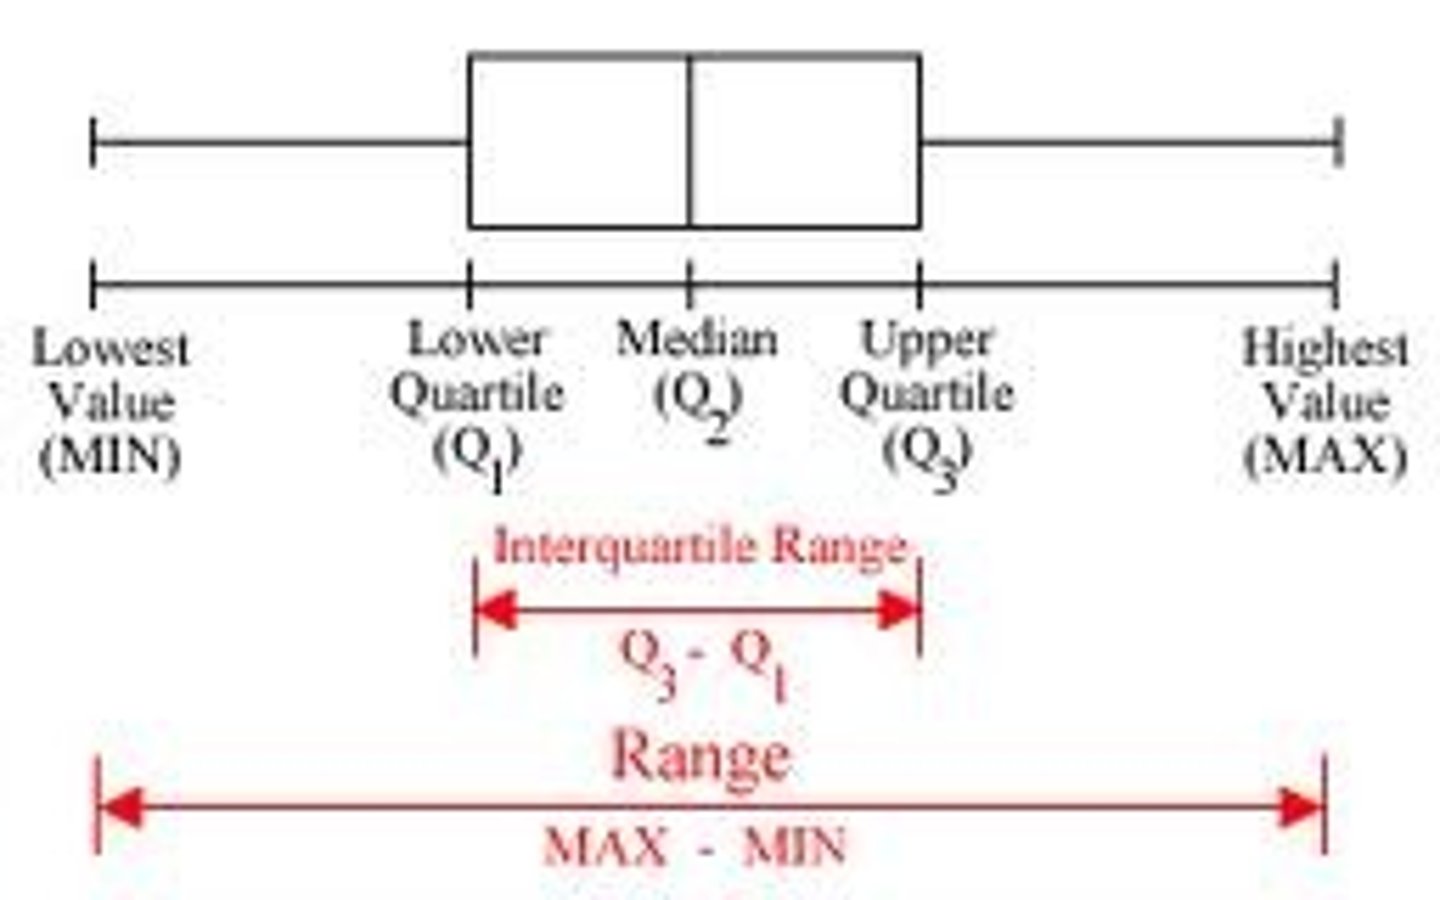
how to make a box plot
1. draw and label number line (if not given)
2. draw vertical lines to mark the minimum, maximum, lower and upper quartiles, and median
3. draw horizontal lines between min and Q1, Q3 and max
4. draw horizontal lines at the top and bottom of Q1 and Q3 lines to form a box
