RUTGERS quantitative methods in psych conceptual exam 2 (kilianski)
1/132
There's no tags or description
Looks like no tags are added yet.
Name | Mastery | Learn | Test | Matching | Spaced | Call with Kai |
|---|
No analytics yet
Send a link to your students to track their progress
133 Terms
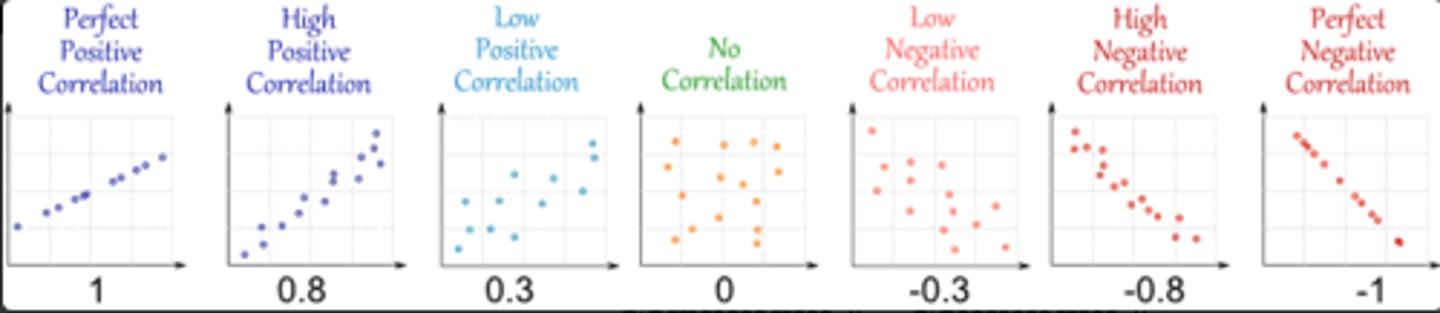
Correlation Coefficient (r)
ranges from -1 to 1
both variables must be interval/ratio level
anticipated relationship must be linear
homoscedasticity (relationship between x and y is constant from top to bottom) is assumed
range of values is not restricted
The negative/positive sign indicates the direction of the relationship (when r is positive, one variable increases as the other increases; when r is negative, one variable increases as the other decreases)
r of 0 means the two variables are unrelated—the value of one tells you nothing about the value of the other; r of 1 or -1 means the values fall along a straight line
With lower absolute values of r, we lose predictive accuracy
positive correlation - x goes up and y goes up (direct relationship)
negative correlation -x goes down and y goes up (inverse relationship)
values of r
values range from -1 to 1; 0 means no correlation
Pearson's r
finds correlation between IV and DV (relationship between DV and IV is expected to be linear)
need to find the cross product of the z scores to find Pearson's r
the bigger the r the smaller the denominator
Pearson's r null hypothesis
Ho: r(population) = 0
In a Pearson's r test, there is no restriction between of range within the range of possible values.
true
In a Pearson's r test, a significant correlation means there is a causal relationship between the IV and DV.
false
Coefficient of determination
r squared; effect size in a Pearson's r test; tells you what percent of the variability in the DV is accounted for by the IV
Fishers z
The Fisher Z-Transformation is a way to transform the sampling distribution of Pearson's r (i.e. the correlation coefficient) so that it becomes normally distributed. The "z" in Fisher Z stands for a z-score.
Fisher's z' is used to find confidence intervals for both r and differences between correlations. But it's probably most commonly be used to test the significance of the difference between two correlation coefficients, r1 and r2 from independent samples.
Paired Samples t-test
used for repeated measures in experiments; DV is measured, experimental manipulation is administered, DV is measured again
purpose is to find difference between two means
use the SAME people (before/after manipulation)
how increase/decrease in r values affect t in paired samples t-test
r increases t increases, r decreases t decreases
SD increases (numerator)
t decreases
null hypothesis
t=0
z=0
f=1
r population=0
SSw increases
f decreases
SSb increases
f increases
dfb increases
f increases
dfw increases
f increases
large f ratio
mean square bw is larger than mean square within, variability between the group is larger than variability occuring the groups
When retesting subjects, an independent samples t-test is not acceptable because scores within subjects are correlated.
true
Why is the SEd different in a paired samples t-test than an independent sample?
we must take within-subjects correlation into account (if significant)
one-way ANOVA test
finding differences between three or more sample means; finds ratio of variability between and within groups
looks at variance in the DV and what its sources are
From an overall F-test, we do NOT know where the specific mean differences are, so we must perform a follow-up test of Tukey's HSD
one-way analysis of variance (ANOVA) null hypothesis
Ho: μ1 = μ2 = μ3...
In finding the difference between three or more means, you cannot use multiple t-tests because the probability of falsely accepting the null hypothesis increases with each test.
false; more likely to falsely reject the null hypothesis
Tukey's HSD
used when there is a significant difference to find the specific mean difference; only used in a one-way ANOVA or a factorial ANOVA for every significant F with three or more levels
SS(w) means square within
find the mean for each level of the IV; subtract it from each individual score; square those differences; sum the squares; add the values together
Level of a IV refers to how many groups/conditions there are
SS(b) mean square between
find each condition mean; subtract the grand mean from each condition mean; square these differences; multiply them by the sample size for that condition; add those values together
The bigger the differences between conditions are, the bigger the sum of squares between will be.
true
factorial analysis of variance (ANOVA)
compares means across two or more IVs
DV must be interval/ratio
Explores the effects of each IV separately (i.e., main effects) and different combinations of IVs (i.e., interactions) (The significance of one (i.e., a main effect or interaction) does NOT depend
on the significance of another)
"main effect" in a factorial ANOVA
effects of IVs seperately
"interaction" in a factorial ANOVA
effects of different combinations of IVs
2 x 2 ANOVA
two IVs with two levels each
2 x 3 ANOVA
two IVs, one of which has two levels and one of which has three
When both the independent and dependent variables are interval/ratio level, which statistical test should be used?
Pearson's r
Why is the term 2r(SEM1)(SEM2) not included in the independent samples t-test?
r is assumed to be 0 in the independent samples t-test
The term -2r(SEM1)(SEM2) in the paired samples t-test causes the t-ratio to be ________ than it would if the term were excluded.
larger
With respect to the paired-samples t-test, as the size of the r increases, the t-ratio _____ making it ________ to reject the null hypothesis.
increases; more likely
If the Pearson's r between variables X and Y is -.50, how much of variance in Y can be predicted by X?
25%
Which of the following is used in determining the degrees of freedom between in the F-test?
the number of groups being compared
In the F statistic, the sum of squares between is influenced by
differences between each group mean and the grand mean
In an experiment, the numerator in the F statistic is a measure of
the effect of the IV on the DV
In a one-way ANOVA, as the sum of squares within increases, the probability of accepting the null hypothesis
increases
If the F statistic is significant in the 1-way ANOVA, the next step to take would be
to reject the null hypothesis and conduct a post-hoc test
Why do we conduct a post-hoc test if we find a significant F in a one-way ANOVA?
Because you don't know which means differ from which other ones when there are more than two of them.
Assuming that the mean differences and standard deviations are constant, you are less likely to reject the null hypothesis when using a paired-samples t-test than an independent samples t-test.
false
In a 1-way ANOVA, if the sum of squares between remains constant and the number of means being compared increases, you are more likely to find a significant difference among the means.
true
In an ANOVA, both the number of levels of the independent variable and the size of the sample influence the degrees of freedom within.
true
The reason there is only one number shown for degrees of freedom in any t-test is because the degrees of freedom between must always be 1.
true
For an independent samples t-test and a paired samples t-test with same number of subjects, the degrees of freedom would be the same.
false
With respect to a factorial ANOVA, if both main effects are significant, the interaction must also be significant.
false
In a factorial ANOVA, when neither main effect is significant, the interaction may still be significant.
true
When an ANOVA results in the rejection of the null hypothesis, the between-group variability must be greater than the within-group variability.
true
An interaction can only occur between ___ or more ___ variables
two; independent
In an analysis of variance, total variability results from the accumulated differences between each individual score and the _____.
grand mean
In an analysis of variance, within group variability results from the accumulated differences between each individual score and the ___.
group mean
When a calculated F ratio has a large value, it indicates that the variability between groups is ___ than the variability within groups.
larger
The variance, or mean square, results from diving the sum of squares by ___.
degrees of freedom
mean square
estimates of variance across groups; SS/df
signifies variance in an ANOVA
Type I error
incorrect rejection of a true null hypothesis
When alpha is .05, we have a 5% probability of incorrectly rejecting H0
Type II error
incorrect acceptance of a false null hypothesis
When alpha is .05, we have a 95% probability of incorrectly failing to reject H0
The total sum of squares is made up of two major components, the ___ and the ___.
SS(w); SS(b)
When an ANOVA results in the rejection of the null hypothesis, then the ___ variability must be larger than the ___ variability.
between group; within group
If the within group variability is small, then the separate sample groups are most likely to have ___ distributions.
leptokurtic
A five-group research design with six subjects in each group has ___ between degrees of freedom and ___ within degrees of freedom.
4; 25
The greater the spread among the various sample means, the larger is the ___ variability.
between group
The F ratio is a non directional, two-tail test of differences among sample groups used whenever the data are in interval form.
true
ANOVA demands that at least four sample groups must be compared.
false
On a four-group design, the between degrees of freedom for a one-way ANOVA must equal 4.
false
ANOVA assumes that the data are at least interval.
true
An F ratio of 5.00 indicates that the variance between groups is five times greater than the variance within groups.
true
The use of the factorial ANOVA is required whenever there is more than one independent variable and the data are in interval form.
true
On a factorial ANOVA, the interaction effect will always be significant if the main effects are themselves significant.
false
To do a factorial ANOVA, there must be a minimum of at least four different treatment conditions.
true
When the obtained value of F is larger than the table value of F for a given number of degrees of freedom, the null hypothesis cannot be rejected.
true
the greater the f statistic, the more likely to reject the null hypothesis
true
One way ANOVA can only be used for numerical data.
true
For pairwise post hoc comparisons, which one of these tests would be considered first choice, because it provides a 95% confidence interval?
Tukey's test
For continuous, normally distributed data with over 3 samples, which one of these tests should be used?
ANOVA
The ANOVA test splits up the variance of the dependent variable into what who groups?
- Between-group variance
- Within-group variance
Which one of these would provide the best visual display of the linear relationship between two numerical variables?
Scatterplot
ANOVA assumes that the data are at least interval.
True
Which one of these tests deals with both continuous and categorical variables?
ANCOVA
ANCOVA is a model with a continuous outcome variables and two or more predictor variables where at least one is continuous and at least one is categorical.
A Pearson r of .90 means the % of information about Y contained in X is roughly 81%.
true
An R^2 of _____ means that the DV cannot be predicted from the the IV.
0
Analysis of Variance involving 2 or more independent variables or predictors
Factorial ANOVA
A sample of n=25 individuals is selected from a population with= 80 and a treatment is administered to the sample. If the treatment is administered to the sample. If the treatment has no effect, then
The same mean should be close to 80 and should lead you to fail to reject the null hypothesis
Which of the following, if any, is true with respect to Pearson's r?
A. Either of the variables must be ordinal
B. The ranges of values for X and Y can be no greater than + or minus 1 SD of their means.
C. The form of the relationship between X and Y can be non-linear
D. None of the above are true
D. None of the above are true
In a 3 x 2 x 2 factorial ANOVA, how many variables and levels are there?
There are 3 variables. The first variable has 3 levels. The second and third variables
have 2 levels each.
After finding a significant F from a one-way ANOVA, what do you know and what do you not know?
You know that there is a difference between your groups, but not what groups specifically differ from each other. (Need Tukeys HSD to determine the specific differences).
What is the dfbetween and dfwithin for F (2, 98) = 3.96, p < .05?
dfbetween = 2, dfwithin = 98
What is the squared amount of variation between each score and the mean of the score's group called?
SSw
If SSbetween is large then you are more/less likely to reject the null?
more
I want to know whether extraversion (extraverted, introverted) and music ability (plays no instruments, plays many instruments) affects the number of tinder matches a person gets. I find that playing instruments while extraverted and introverted predicts more dates. Is this a significant main effect or interaction?
Main effect of music ability
True or false: the smaller the differences are between groups, the bigger the SSb will be.
False
What is the main difference between a one-way and a factorial ANOVA?
A factorial ANOVA has 2 or more IVs.
2 x4 ANOVA has how many null hypotheses?
3
I want to test the effect of drugs (placebo, 1 pill, or 2 pills) and sleep (10hrs, 8hrs, or 6hrs) on depression. What is the type of test will I use?
Factorial ANOVA
What is the F ratio?
The amount of variation between groups/amount of variation within groups
Which pearson's r value indicates a stronger relationship: r = .3 or r = -.6?
-.6
When you have a strong/large correlation between your before and after scores in a repeated measures design (i.e., paired samples t test) does it become easier/harder to reject the null?
Easier (you are more likely to reject the null b/c denominator of paired samples t becomes smaller)
What percentage of the variance is accounted for when you have a significant r = .6?
36% of the variance (use the coefficient of determination = r2 to determine the % of
variance one variable can explain for the other variable)
What is the null hypothesis in a correlation?
The null is that there is NO relationship between the variables; r = 0