6.5 - Urban fieldwork
1/27
Earn XP
Description and Tags
Name | Mastery | Learn | Test | Matching | Spaced | Call with Kai |
|---|
No analytics yet
Send a link to your students to track their progress
28 Terms
Urban enquiry questions
How does environmental quality in Llandudno change with distance from the north shore?
How does land use in Llandudno change with distance from the north shore?
Why Llandudno?
Location can be reached within day trip from Manchester
Data collection for coastal + urban can be carried out on same field trip
Shows range of diff land uses + environmental quality
Safe location, with low levels of traffic within study area
Examples of aims of enquiry
An investigation into the environmental impact of a new road/housing estate/business park in the city of Y
An investigation into changes in land use on the urban-rural fringe of the city of X
An investigation into environmental quality from the CBD to the urban fringe in the city of W
Hypothesis
Statements that are tested through fieldwork
e.g. Environmental quality improves with distance from CBD
Null hypothesis
Statement that is opposite to hypothesis
Ensures no bias when collecting evidence
Not ignoring evidence because it doesn’t prove statement
If you can’t prove statement, then opposite must be true
e.g. Environmental quality does not improve with distance from CBD
True sampling will:
Reduce bias
Provide overview of whole
Opportunistic approach
Opportunistic sampling
Approach may need to be taken in situations where access to sample site is limited
Should be as close as possible to site selected using sampling
Systematic sampling
Sampling of sites/people at regular intervals along transect line
Random sampling
All sites have equal chance of being selected
Stratified sampling
Sampling sites which represent whole
e.g. if 10% of population is over 65 then 10% of questionnaire sample should be over 65
Site locations
Can be recorded using GPS to give accurate location using latitude + longitude
Grid reference + compass points can also be used
Equipment for urban enquiry
Record sheets
Interview sheets
Pencil for completing record sheets
Camera to take photos of land use
Digital noise meter
Environmental Quality Surveys
Maps
Urban risks
Weather conditions
Working in unfamiliar place
Traffic
Getting lost
Speaking to strangers
Pollution
Cars
Data collection
Data collection methods depend on aims/hypothesis
In urban fieldwork, only equipment to use is digital decibel meter
Other data collection may include questionnaires, traffic counts, environmental quality surveys
Questionnaires
Used to gather opinions of locals on change in urban environment
Example of statement question
'The building of the new housing estate has increased traffic.' Do you strongly agree, agree, disagree or strongly disagree?’
Example of closed question
'How long have you lived in this area?'
Example of open question
'What are your views on the new housing development in ____?'
These can be used to gather large data sample
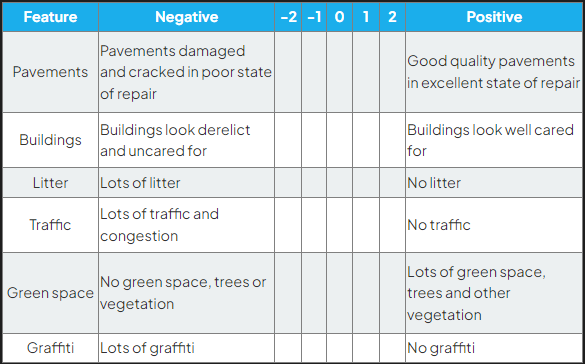
Environmental Quality Surveys
Can be used to compare diff sites within urban area
Survey completed for each site
Care must be taken to be as objective as possible

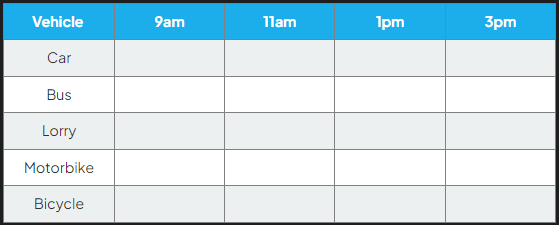
Traffic and Pedestrian Flow Surveys
Can be used to compare traffic + pedestrian levels at diff sample sites
Can be completed on tally chart at diff sites + diff times of day

Photos and Field Sketches
Qualitative data
In urban enquiry, photos + field sketches can be used to show changes in land use + impact on environment at sample sites
Photos useful for illustrating data collection methods used
Primary Data in Urban enquiry
Much of primary data collected in urban enquiry will be presented in graphs:
Each graph suitable for particular data set
Data presentation may also include maps:
Sample site location
Proportional circle maps to show traffic counts at diff sample sites
Bar graphs
To compare environmental quality scores at diff sample sites
Divided bar graphs
Show traffic counts
Scattergraphs
Show relationship between factors such as proximity to land use change and environmental quality of a site
Rose diagrams
Show noise levels
Secondary Data in Urban enquiry
Historical traffic counts
Maps of area where land use has changed
Newspaper articles/websites about land use change
Aerial photographs
Analysing & Interpreting Data
Data collected regarding rural environment change, such as EQS + traffic counts is quantitative data, needs to be analysed using statistical methods
Main statistical method is mean
Analysing Photographs & Field Sketches
Qualitative analysis
Can be used to analyse different features:
Features of diff land use at sample sites
Data collection techniques
Images of land use changes - new housing/road/industry
Conclusion
Should state whether hypothesis has been proved/disproved
Identify + explain anomalies, e.g:
Sample site that has low traffic count but high levels of noise pollution
Anomalies may occur due to natural cause or may be result of incorrect recording/human error when using equipment
Evaluation
Outlines how successful/unsuccessful enquiry was and what could be done differently if repeated, e.g:
Next time, I would take measurements over longer time period to ensure reliability
I completed EQS on my own, which is subjective, next time I would complete it in groups and take mode score
I think my investigation went well and I would like to repeat it at another time of year to see if this impacts environmental quality