BME 3271: Final Exam Review
1/40
There's no tags or description
Looks like no tags are added yet.
Name | Mastery | Learn | Test | Matching | Spaced | Call with Kai |
|---|
No analytics yet
Send a link to your students to track their progress
41 Terms
How is statistical significance determined? Specifically, when is the null hypothesis rejected?
Statistical significance is determined by observing if the p-statistic is greater/less than the α-statistic. The null hypothesis is rejected if p < α (note that usually α = 0.05).
What are the assumptions made when conducting an ANOVA?
Data is normally distributed
Equal varience between groups
Independent samples
Why/When would you perform a t-test vs an ANOVA?
T-test: when only two conditions are being compared
ANOVA: when three or more conditions are being compared
What’s the difference between random noise and experimental error?
Random noise: random varience that is not influenced/swayed by bias (harder to midigate)
Experimental error: random varience that is influenced/swayed by bias (easier to midigate)
Define instrumental error.
Errors or limitations in the measuring instruments themselves.
i.e. incorrect calibration, wear and tear, or inherent flaws in the design of the instrument.
Define observational error.
Errors due to the person conducting the measurement.
i.e. misinterpretation, misreading, or improper technique; human error.
Define environmental error.
Errors caused by external factors in the surrounding environment that can affect the accuracy of measurements.
i.e. temperature, humidity, pressure, magnetic fields, etc.
Define theoretical error.
Errors from simplifications, assumptions, or approximations made in the model or theory applied to an experiment or measurement.
i.e. when real-world complexity is simplified for practical analysis.
What should you do (i.e. what type of analysis should be performed) to determine what the sample size of an experiment should be?
Power analysis.
List examples of different (possible) distribution types.
Normal
Cauchy (heavy-tail kurtosis)
Weibull (sometimes characterized as postitive skewness)
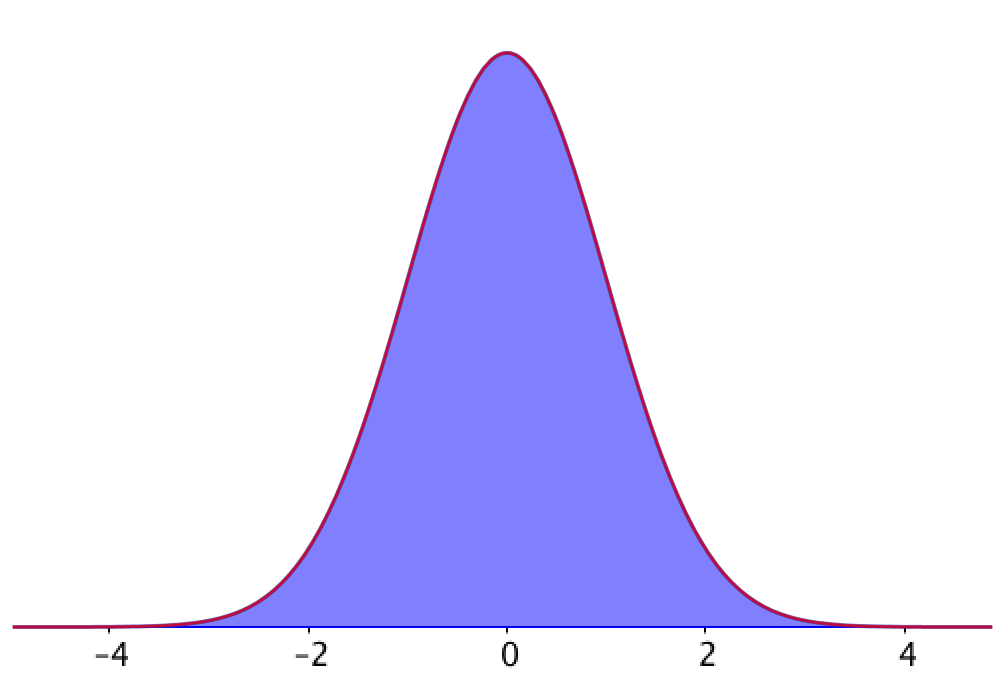
What type of (probability) distribution is shown in this image?
Normal distribution.
What are the assumptions made for a normal distribution?
Independent samples
Measurements of one sample are independent from the measurements of another
Continuous data
Data can be any value in a range (i.e. not confined to specific/whole numbers)
Symmetry
Equal probability in both directions (i.e. mean, median, and mode of data are equal to each other)
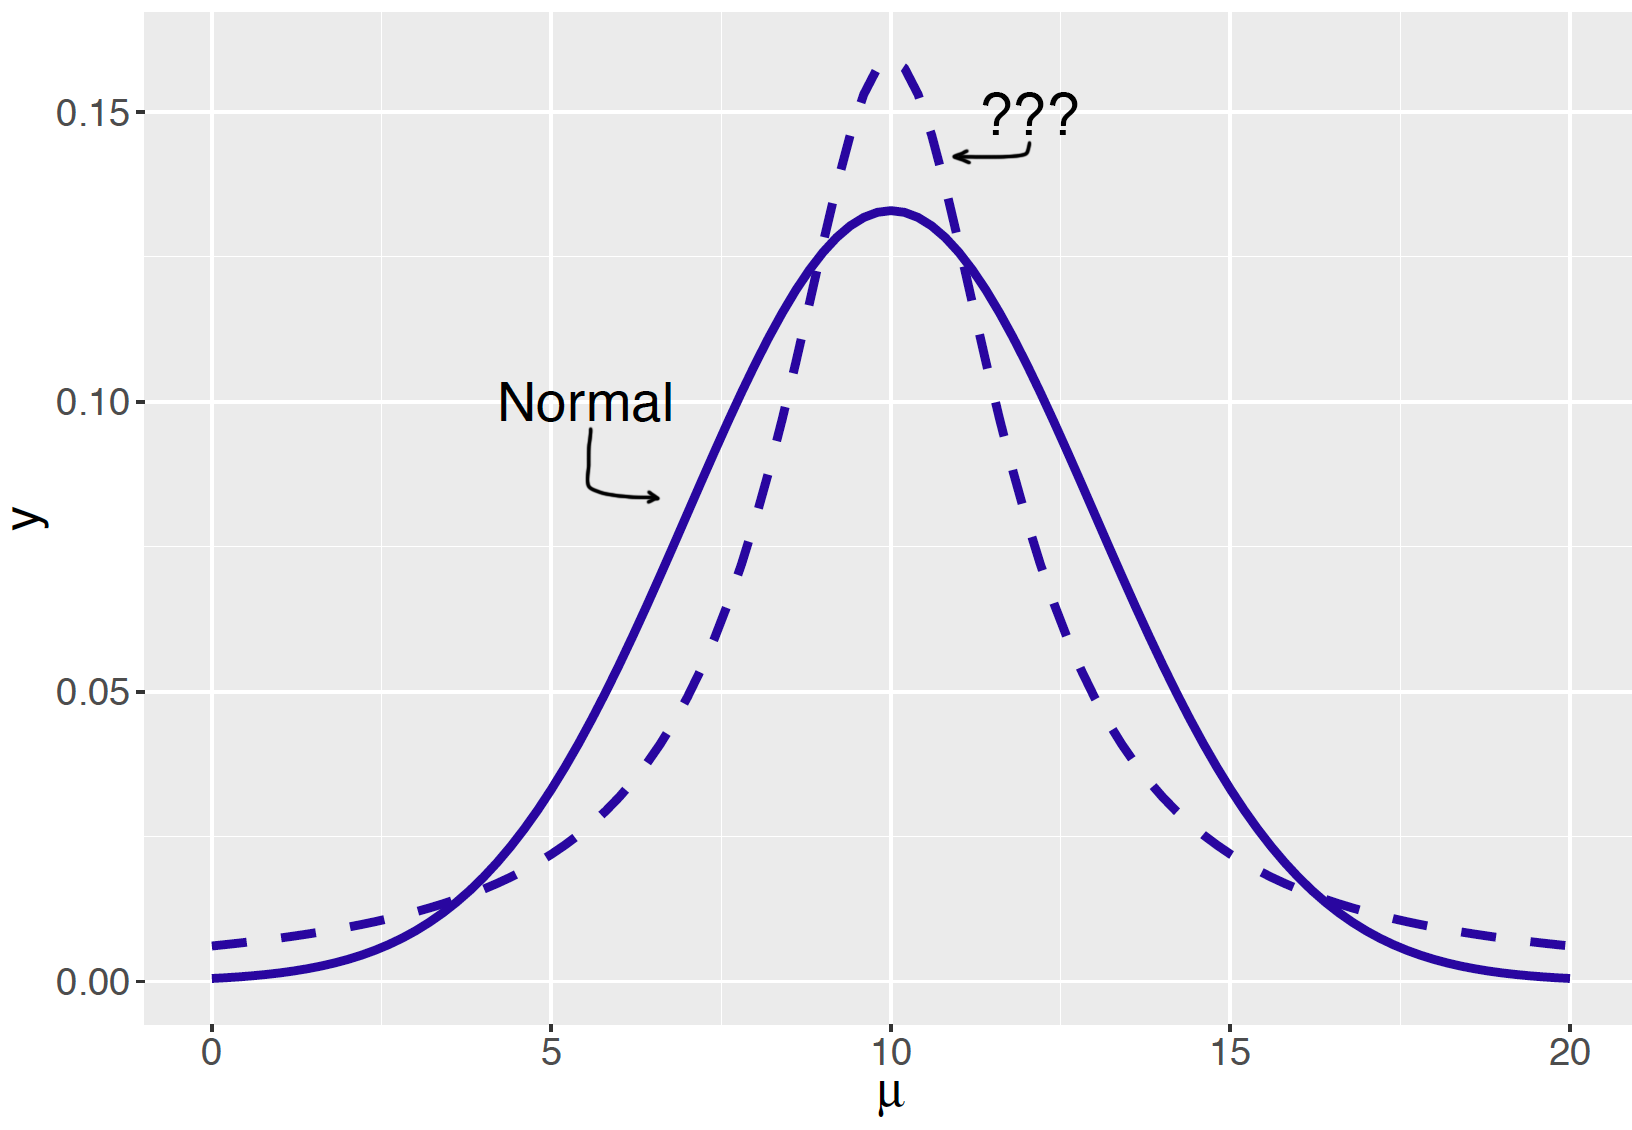
What type of (probability) distribution is shown in this image?
Cauchy (heavy-tailed) distribution.
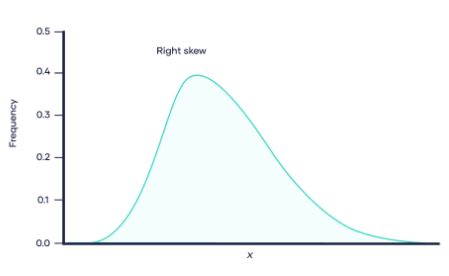
What is positive skewness of a normal distribution and what does it look like?
Positive (right) skewness is when more significant values are on the positive (right) side of the graph; the right tail is bigger than the left tail.
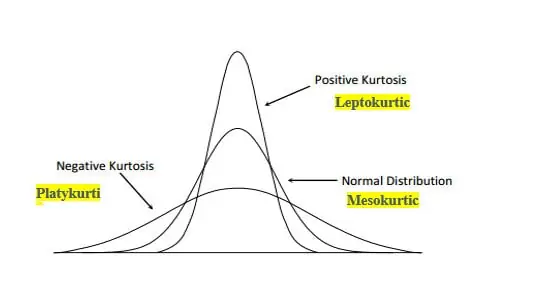
What is kurtosis of a normal distribution and what does it look like?
Kurtosis describes tail heaviness (i.e. the presence of outliers and how pronounced they are relative to a normal distribution).
When should you use choose to use a z distribution vs a t distribution?
z distribution: Larger sample size (~n > 30)
t distribution: Smaller sample size (~n ≤ 30)
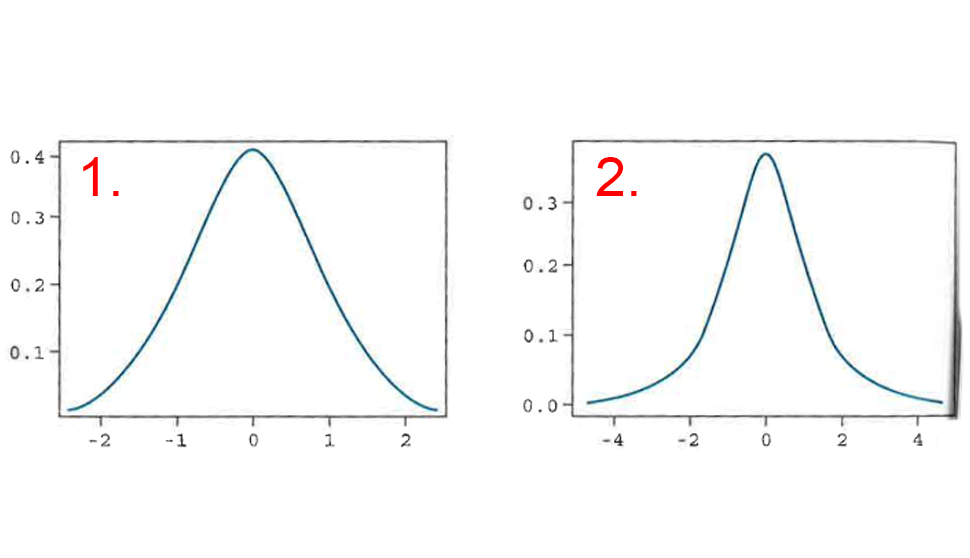
Of these two figures, which is the z distribution and which is the t distribution?
z distribution
t distribution
What is type 1 error (α)? What is it commonly called?
Rejection of the null hypothesis when it’s actually true
Commonly called a “false positive”
What is type 2 error (β)? What is it commonly called?
Acceptance of the null hypothesis when it’s actually false
Commonly called a “false negative”
Regarding proving significance, what happens when the sample size is increased?
It becomes easier to prove significance.
The student’s t-test is for when you’re observing how many samples?
Only for one sample.
What does the student’s t-test allow you to find?
Where or not the sample is within the population.
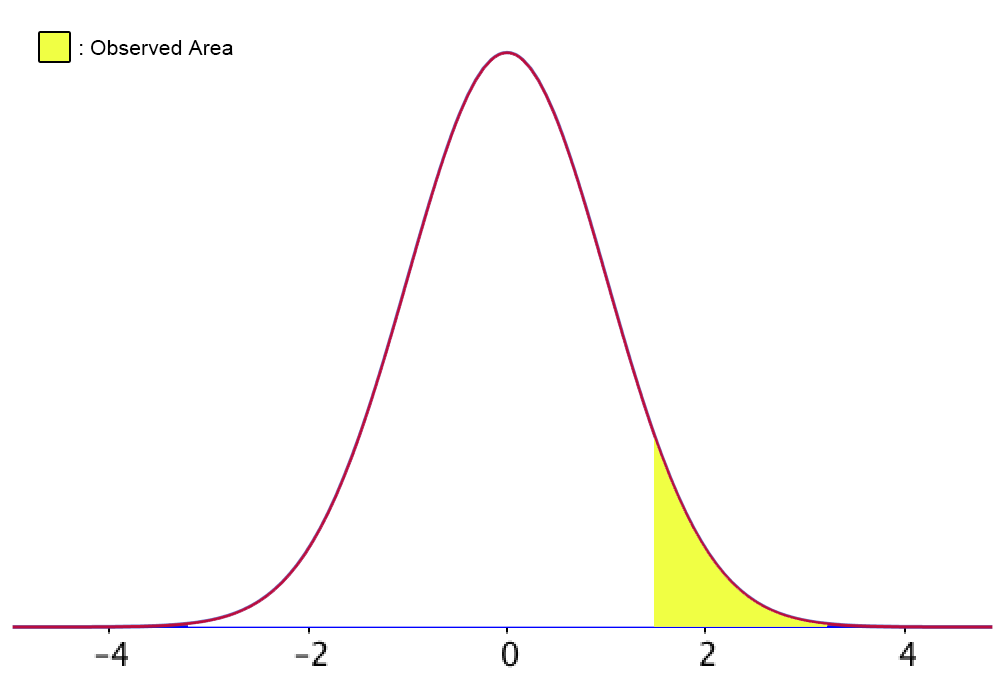
If the hypothesis is that “group 1” is greater than “group 2”, what type of t-test should be run and why? What part of the distribution are we looking at?
One-tailed t-test because we’re restricting the analysis; only seeing if “group 1” is (significantly) greater than “group 2.
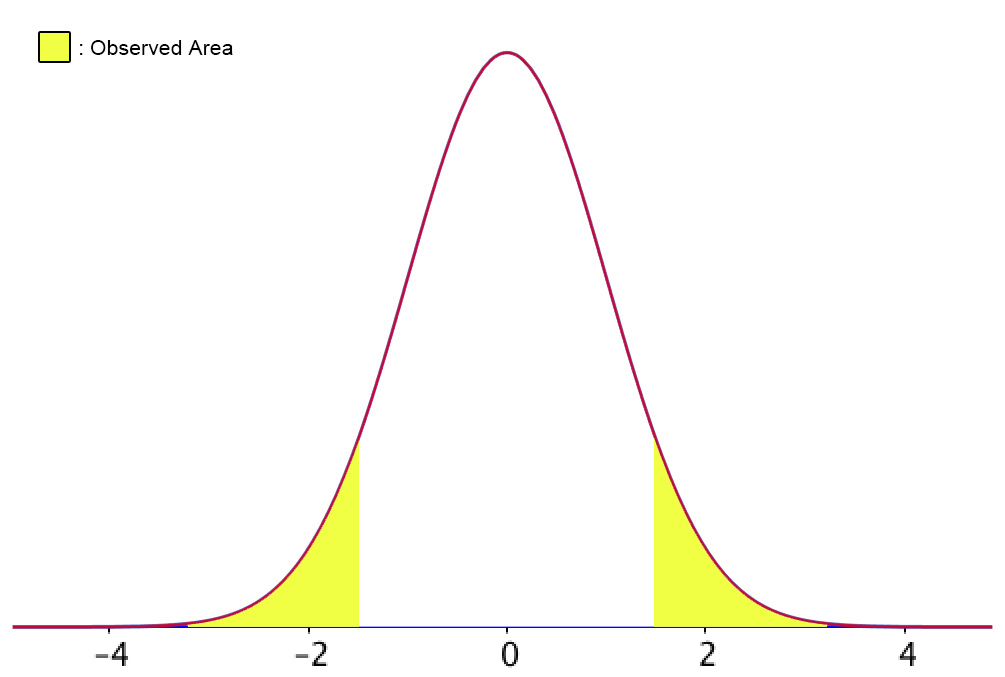
If the hypothesis is that “group 1” is different from “group 2”, what type of t-test should be run and why? What part of the distribution are we looking at?
Two-tailed t-test because the analysis is not restricted; observing any (significant) difference between “group 1” and “group 2.
What are the assumptions made for a one-sample t-test?
Random sampling
Sample is randomly selected from the population
Normal distribution
Independence
Observations in the sample are independent of each other
Equal variance (within each group)
What are the assumptions made for a two-sample t-test?
Normal distribution
Independent samples
Equal varience
If data is not normally distributed, what type of statistical analysis should be performed instead of an ANOVA?
A non-parametric version of an ANOVA (Kruskal-Wallis test).
How are multiple comparisons tests difference from t-tests?
Multiple comparisons tests consider the probability of a false positive for each individual comparisons (whereas t-tests don’t).
What is the “one-factor-at-a-time” strategy of experimentation?
Optimizing the first factor, then using the optimized value to then optimize the second factor, then using the two optimized values to optimize the thrid factor, and so on and so forth until all factors are optimized.
What are the advantages and disadvantages of the “one-factor-at-a-time” approach?
Advantages:
Fewer samples
Easier to show statistical significance
Disadvantages:
Doesn’t observe interactions between factors (i.e. misleading)
What is the “full factorial” strategy of experimentation?
Testing all possible combinations of the levels of factors to find most optimal combination.
What are the advantages and disadvantages of the “full factorial” approach?
Advantages:
Observes interaction between factors
Disadvantages:
Can be expensive
Large number of samples (typically) required
What’s the difference between statistical and practical significance?
Stastical: analysis shows that certain statistical values do (or do not) pass a threshold (e.g. significant if p < α)
Practical: if the results “actually matter” (i.e. even if it’s statistically significant, it might not have any bearing on practical applications)
What is characteristic of non-parametric analysis (specifically in regards to assumptions)?
Makes minimal assumptions about the underlying distribution.
What are the advantages and disadvantages of non-parametric analysis?
Advantages:
Fewer assumptions about data
Can handle outliers and non-linear relationships better
Accomodates wide variety of data
Disadvantages:
Generally less powerful than parametric
Difficult to interpret results quantitatively
May require transformations of data (e.g. ranking)
Assumptions are more characteristic of parametric analysis, but what assumption(s) is/are kept for a (non-parametric) rank sum test?
Equal varience
Independence.
What is statistical power?
The probability of not making a type 2 error (β); how likely you are to correctly observe a statistical difference.
For statistical calculations, how do you determine power (i.e. how do you determine type 2 error)?
Power = 1 - β
What are the advantages and disadvantages of a two-way ANOVA?
Advantages:
Can track factor interactions
Increased statistical power
Can handle multiple factors and levels
Disadvantages:
Complex interpretations
Generally larger sample sizes required
What are the assumptions made for a two-way ANOVA?
Normal distribution
Equal varience
Independent samples
Nothing on the other side of this, just review power calculations (cause they’re weird and he didn’t have a lot of notes for them in the slides).
Go fuck yourself.