Edexcel GCSE Statistics Revision Guide
1/388
There's no tags or description
Looks like no tags are added yet.
Name | Mastery | Learn | Test | Matching | Spaced | Call with Kai |
|---|
No analytics yet
Send a link to your students to track their progress
389 Terms
Raw Data
Unprocessed. Just been collected. Needs to be ordered, grouped, rounded, cleaned.
Qualitative
Non-numerical, descriptive data such as eye/hair colour or gender. Often subjective so usually more difficult to analyse.
Quantitative
Numerical data. Can be measured with numbers. Easier to analyse than qualitative data. Example, height, weights, marks in an exam etc.
Discrete
Only takes particular values (not necessarily whole numbers) such as shoe size or number of people.
Continuous
Can take any value e.g. height, weight.
Categorical
Data that can be sorted into non-overlapping categories such as gender. Used for qualitative data so that it can be more easily processed.
Ordinal (rank)
Quantitative data that can be given an order or ranked on a rating scale, e.g. marks in an exam.
Bivariate
Involves measuring 2 variables. Can be qualitative or quantitative, grouped or ungrouped. Usually used with scatter diagrams where the two axes represent the two different variables.
Multivariate
Made up of more than 2 variables e.g. comparing height, weight, age and shoe size together.
Grouping Data
Grouping data using tables makes it easier to spot patterns in the data and quickly see how the data is distributed.
Population
Everyone or everything that could be involved in the investigation e.g. when investigating opinions of students in a school the population would be all the students in the school.
Census
A survey of the entire population.
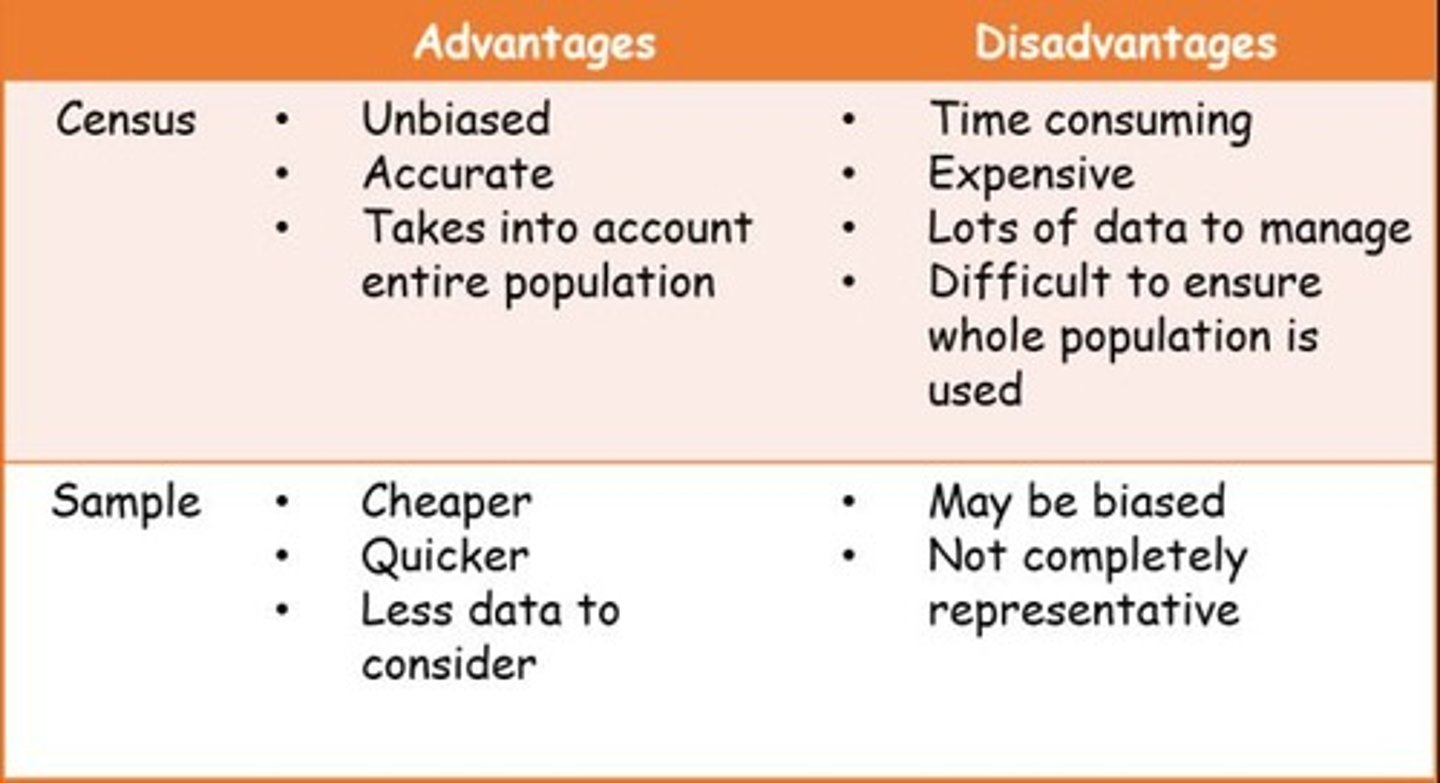
Sample
A smaller number from the population that you actually survey. The data obtained from the sample is then used to make conclusions about the whole population.
Sampling Frame
A list of all the members of the population. This is where you will choose the sample from.
Sampling Unit
The people that are to be sampled e.g. students in a school.
Biased sample
A sample that does not represent the population fairly. Example, if surveying students at a mixed school and the sample only contains girls.
Random Sample
Every item/person in the population has an equal chance of being selected.
Simple Random Sampling
A method where every member of the population has an equal chance of being selected.
Quota Sampling
A non-random sampling method where the researcher ensures equal representation of certain characteristics.
Stratified Sampling
A sampling method that involves dividing the population into subgroups and randomly sampling from each.
Systematic Sampling
A sampling method where members are selected at regular intervals from a sorted list.
Opportunity Sampling
A non-random sampling method where the researcher selects individuals who are readily available.
Judgement Sampling
A non-random sampling method where the researcher uses their judgement to select participants.
Cluster Sampling
A sampling method where the population is divided into clusters and entire clusters are randomly selected.
Random Sampling
A technique where every member of the population has an equal chance of being selected.
Advantages of Random Sampling
Sample is representative as every member of the population has an equal chance of being selected; it is unbiased.
Disadvantages of Random Sampling
Requires a full list of the population, which is not always easily obtainable; can be expensive and time-consuming; needs a large sample size.
Stratified Sample
The size of each strata (group) in the sample is in proportion to the sizes of strata in the population.
Stratified Sample Method
Split the population into groups and use the formula stratified sample = total × sample size to calculate sample size for each group.
Advantages of Stratified Sampling
Sample is in proportion to population, so it represents the population fairly; best used for populations with groups of unequal sizes.
Disadvantages of Stratified Sampling
Time-consuming.
Systematic Sampling
Choosing items in the population at regular intervals.
Systematic Sampling Method
Divide your population size by sample size to calculate the intervals and select every nth item based on a random starting point.
Advantages of Systematic Sampling
Population is evenly sampled; can be carried out by a machine; sample is easy to select.
Disadvantages of Systematic Sampling
Not strictly a random sample as some members of the population cannot be chosen.
Cluster Sampling
The population is divided into natural groups (clusters), groups are chosen at random and every member of the groups is sampled.
Advantages of Cluster Sampling
Economically efficient with less resources required; can be representative if lots of small clusters are sampled.
Disadvantages of Cluster Sampling
Clusters may not be representative of the population and may lead to a biased sample; high sampling error.
Quota Sampling
Population is grouped by characteristics and a fixed amount is sampled from every group.
Quota Sampling Method
Group population by characteristics and select quota for each group, obtaining the sample until the quota is reached.
Advantages of Quota Sampling
Quick to use; cheap; does not need a sample frame or full list of the population.
Disadvantages of Quota Sampling
NOT RANDOM; biased as the interviewer chooses who will be in the sample.
Opportunity Sampling
Using the people/items that are available at the time.
Advantages of Opportunity Sampling
Quick; cheap; easy.
Disadvantages of Opportunity Sampling
NOT RANDOM; the sample may not represent the population.
Judgement Sampling
When the researcher uses their own judgement to select a sample they think will represent the population.
Advantages of Judgement Sampling
Easy; quick.
Disadvantages of Judgement Sampling
NOT RANDOM; quality of sample depends on the person selecting it, which may introduce bias.
Petersen Capture-Recapture
Used to estimate the size of large or moving populations where it would be impossible to count the entire population; the answer is only an estimate.
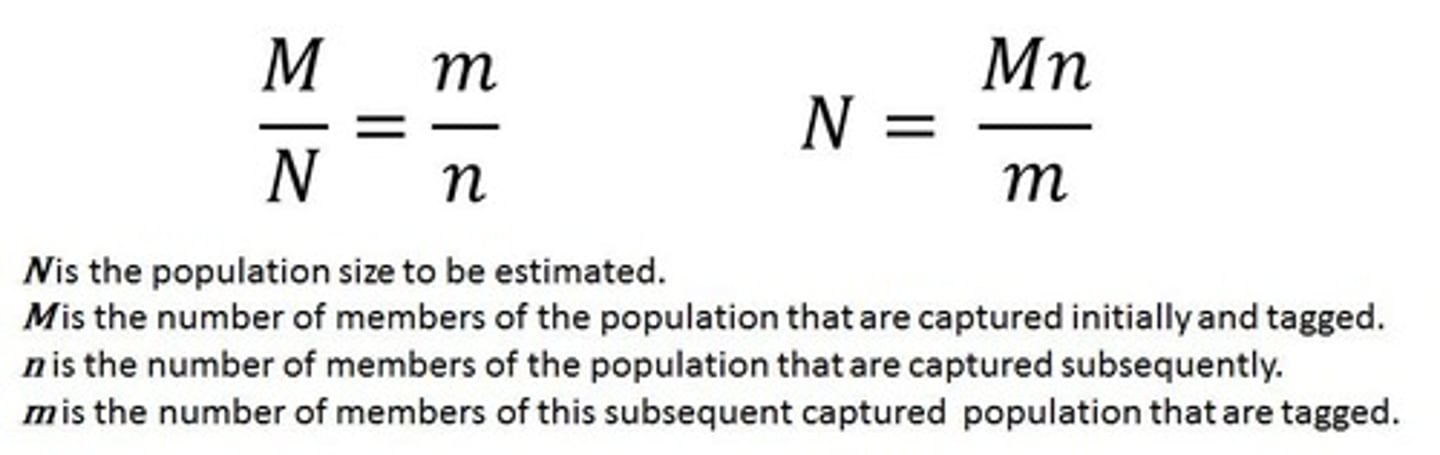
First Capture
Total (N) = Tagged
Second Capture Method
1. Take a sample of the population 2. Mark each item 3. Put the items back into the population and ensure they are thoroughly mixed 4. Take a second sample and count how many of your sample are marked 5. The proportion of marked items in your new sample should be the same as the proportion of marked items from the population in your first sample.
Assumptions of Capture Method
Population has not changed - no births/deaths, Probability of being caught is equally likely for all individuals, Marks/tags not lost, Sample size is large enough and is representative of the population.
Experiments
Used when a researcher investigates how changes in one variable affect another.
Explanatory (Independent) Variable
The variable that is changed.
Response (Dependent) Variable
The variable that is measured.
Extraneous Variables
Variables you are not interested in but that could affect the result of your experiment.
Laboratory Experiments
Researcher has full control over variables. Conducted in a lab or similar environment.
Example of Laboratory Experiment
Measuring reaction times of people of different ages.
Explanatory Variable in Lab Example
Age
Response Variable in Lab Example
Reaction time.
Extraneous Variables in Lab Example
Gender, health condition, fitness level etc.
Advantages of Laboratory Experiments
Easy to replicate - makes results more reliable. Extraneous variables can be controlled so results are more likely to be valid.
Disadvantages of Laboratory Experiments
People may behave differently under test conditions than they would under real-life conditions - could affect validity of results.
Field Experiments
Carried out in the everyday environment. Researcher has some control over the variables.
Example of Field Experiment
Testing new methods of revision.
Explanatory Variable in Field Example
Method of revision
Response Variable in Field Example
Results in exam
Extraneous Variables in Field Example
Amount of revision pupils do, ability of pupils.
Advantages of Field Experiments
More accurate - reflects real life behaviour.
Disadvantages of Field Experiments
Cannot control extraneous variables. Not as easy to replicate - less reliable than lab experiments.
Natural Experiments
Carried out in the everyday environment. Researcher has no/very little control over the variables.
Example of Natural Experiment
The effect of education on level of income.
Explanatory Variable in Natural Example
Level of education
Response Variable in Natural Example
Income
Extraneous Variables in Natural Example
IQ, other skills people may have, personal circumstances.
Advantages of Natural Experiments
Reflects real life behaviour.
Disadvantages of Natural Experiments
Low validity - extraneous variables are not controlled which may affect results instead of explanatory variable. Difficult to replicate. Cannot control extraneous variables.
Simulation
A way to model random events using random numbers and previously collected data.
Steps in Simulation
1. Choose a suitable method for getting random numbers - dice, calculator, random number tables. 2. Assign numbers to the data. 3. Generate the random numbers. 4. Match the random numbers to your outcomes.
Example of Simulation
You sell milk, dark and white chocolates in a shop. P(milk) = 3/6, P(white) = 1/6, P(dark) = 2/6.
Primary Data
Data collected directly from the source.
Questionnaire
A set of questions used to obtain data from the population/sample.
Respondent
The person completing the questionnaire.
Open Questions
Questions that allow any answer, making it difficult to analyze the data.
Closed Questions
Questions with a fixed number of non-overlapping option boxes for specific answers.
Features of a Good Questionnaire
Includes easy to understand language, avoids leading questions, and is relevant to the investigation.
Non-response
When people in the sample do not respond to the questionnaire.
Sensitive Questions
Questions about personal topics that may make respondents uncomfortable.
Random Response Method
Uses a random event to decide how to answer a question, ensuring anonymity.
Pilot Study
A small scale replica of the study to test the design and methods of the questionnaire.
Outliers
Values that do not fit in with the pattern or trend of the data.
Cleaning Data
The process of fixing problems with the data, including correcting or removing incorrect values.
Simulation
A method to mimic real-life situations to generate data.
Dice Roll Simulation
Rolling the dice 10 times to generate random numbers and record the results.
Data Analysis
The process of examining, cleaning, and modeling data to discover useful information.
Incentive for Questionnaire Completion
Offering a prize or reward to encourage respondents to complete the questionnaire.
Time Frame in Questions
Including a specific time period in the question to provide context.
Exhaustive Option Boxes
Option boxes that cover all possible answers in a questionnaire.
Ambiguous Questions
Questions that are unclear and can lead to confusion among respondents.
Response Rate
The percentage of respondents who complete the questionnaire.