EQ2- The consequences for people and the environment of our increasing demand for energy.
1/27
There's no tags or description
Looks like no tags are added yet.
Name | Mastery | Learn | Test | Matching | Spaced |
|---|
No study sessions yet.
28 Terms
Energy security
Having reliable, affordable + easy access to a natural resource for the purpose of energy consumption.
Energy consumption
Why it is increasing?
What is it measured by?
Energy demand is increasing as a result of: Global population growth and Development + rising standard of living
Measured by:
per capita: megawatt hours per person or kg of oil equivalent (KOE)
units of energy used per unit GDP: the fewer the units of energy, the more efficiently a country is using its energy supply. e.g. UK has <0.1 KOE
Energy mix
The combination of different energy sources that are used to meet a country’s total energy demand.
Primary vs secondary energy sources: Primary sources are those used in their raw form e.g. fossil fuels, nuclear + renewable energy. They can be used to generate electricity- a secondary energy source. These flow through power lines to reach homes + businesses.
Renewable vs non-renewable sources: In 2015, 25% of UK energy came from renewable sources- more than coal.
Domestic vs foreign: A decline in domestic natural gas + oil in the North Sea means the UK has an energy deficiency + is energy insecure- now requires imported energy.
Factors affecting access + consumption of energy
(compare UK + Norway)
Physical availability: If energy sources aren’t available/ accessible within the country, the energy will have to be imported, adding to overall cost of energy to consumers.
UK: North sea oil + gas altered energy mix
Norway: HEP is the natural energy choice. Most oil + natural gas is exported.
Cost: Cost of physical exploitation, cost of processing from primary to secondary energy, cost of delivery to consumer.
UK: North sea oil is expensive to extract, so UK imports more.
Norway: HEP costs are low, however transfer of electricity is expensive.
Technology: Modern technology makes energy more accessible e.g. oil that requires deep drilling into the earth, increasing energy consumption
UK + Norway: Deepwater drilling technology enabled both Norway + UK to develop North sea oil + gas extraction.
Public perception: Energy costs can be perceived differently in different countries. Public perception usually depends on the level of economic development + SoL.
UK: Public concern over new fracking + nuclear sites
Norway: Taxes go towards sale of fossil fuels but also to invest in sustainable projects
Level of economic development: Developed countries have relatively high levels of energy consumption as people have more domestic appliances that make everyday living comfortable + use more forms of transport.
UK: GDP per capita is $41 200, with energy usage of 2752 KOE
Norway: GDP per capita of $61 500, with energy usage of 5854 KOE
Climate: Regions like North America, Middle East + Australia have high levels of consumption as a result of extra energy required to adapt to extreme heat + cold.
Environmental priorities: Governments may opt for more expensive methods to meet their energy needs out of concern for the environment and the need to reduce carbon emissions.
UK: CO2 emissions were down from a peak of 11.5 tonnes in 1980.
Norway: CO2 emissions were up from 11.6 tonnes in 1989.
Energy pathway
The route taken by any energy from its source to its point of consumption.
-involve different forms of transport: tanker ships, pipelines, electricity transmission grids.
Energy players involved in consumption + production of energy resources
TNC’s
OPEC
Governments
Consumers
TNC’s- energy player
Locate, extract + distribute energy resources.
They provide the supply lines + distribution networks between where resources are found + who wants to use them- useful for politically unstable countries.
-50% of big players in oil + gas (e.g. BP) are state owned and so under gov. control.
Gazprom- Russian energy company which utilises gas reserves + provides 40% gas supply to EU, making it politically powerful.
OPEC- energy player
An IGO whose member nations produce and export oil.
81% of oil reserves are found in OPEC nations. It has monopolistic + price controlling power to significantly affect oil prices by increasing/ decreasing production.
Aims to ensure a steady income for producers, fair returns for investors + regular sufficent supply for consumers.
Governments
Gov’s are requires to meet international obligations in terms of reducing CO2 emissions, whilst securing current + future energy supplies. e.g. COP26
Can regulate private companies + set environmental priorities e.g. subsidising use of renewable energy- the company EDF supplying renewable energy
Geopolitical tensions can hinder energy supplies- Russia + Ukraine altering energy to rest of EU
Consumers
Create demand for electrical energy + for primary energy of a particular resource e.g. oil.
Consumer control over the energy they consume e.g. installing solar panels to reduce home energy costs + purchasing electric cars to be less dependant on oil
Protests against nuclear energy + fracking in the UK impact whether + where these fuels can be sourced
Global mismatch between supply + demand of fossil fuels
OIL
Venezuela + Saudi Arabia have the 2 largest oil reserves at 298B + 268B barrels..
-top 10 nations of oil supply are mainly emerging and developing countries
Economic development has led to oil consumption doubling between 2000 and 2010. China will be be the world’s largest energy importer by 2035.
Europe is also main consumer of oil.
GAS
Russia + Iran has the largest natural gas reserve- 47800B m3
-top 10 nations are mainly emerging + developing countries e.g. Iran, UAE
Significant mismatch as major importers include Western Europe + Japan.
COAL
USA + Russia have the largest coal reserves- 237 000M tonnes + 157 000M tonnes
-top 10 nations are mainly emerging + developing countries e.g. China, India
Slight mismatch as main producers of coal are usually the main consumers e.g. China + USA
Types of energy pathways
Pipelines: natural gas + oil can be transported overground, underground + along sea beds.
e.g. East Siberian Pacific Ocean (ESPO) pipeline is 4188km long + runs from Russia to China + South Korea
-damage to pipelines from natural disasters
-tension with source country- they can switch it off
Transmission lines: high voltage lines that carry electricity from power plants to generate them to where the energy is needed- factories, businesses, etc.
Shipping routes: 50% world’s oil transported by tankers on shipping routes.
Road + railway: USA uses rail as a way of transporting crude oil along west + east coast.
Disruptions caused on security
Shipping route chokepoints: Narrow channels where transport can be easily disrupted
Strait of Hormuz runs through Persian Gulf exporters- approx. 17M barrels of oil per day
A disruption in the strait would impede timely shipment of oil, causing exporters to lose significant revenue + importers face supply shortages + higher costs. May arise when Sunni + Shiite countries threaten to deny passage.
Piracy: Coast of Somalia- supertanker hijacked carrying $200M worth of crude oil off coast of Oman in 2011. Pirates flourish off coast due to no central gov. in Somalia.
Ships are frequently seized for hostage payments- happened over 500 times between 2009-2015.
Geopolitical conflict: Most gas exports go to Europe with 3 pipelines crossing Ukraine. 50% of Russia’s crude oil was exported to Europe in 2021.
-Ukraine can threaten to hike the price it charges for allowing transfer of gas across its territory + stop its flows altogether due to Russia’s military action there.
4 unconventional fossil fuels
Tar sands
Oil shale
Shale gas
Deepwater oil
Tar sands
A mixture of clay, sand, water + bitumen. Have to be mined + injected with steam to make the tar less viscous so it can be pumped out.
+support demand for energy as conventional fossil fuels become limited
-energy + water intensive- for ever 3 barrels of tar sand oil, 1 barrel of conventional oil is used. For every 1 barrel of tar sand oil, 2-5 barrels of water is used.
+Tar sands could meet 16% of North America’s oil need by 2030, offering energy security to Canada + USA(70% of Canadian oil is exported to USA)- 165bn barrels in Alberts tar sands
Work related to this is vital for local + national economies.
Oil shale
Found in sedimentary rock that has not had enough pressure, heat + time for conventional oil.
-must be heated to high temps to release the oil- expensive + releases GHG which affects carbon cycle.
-environmental impacts: disposal of the waste after processing (1 tonne of wasted rock for every barrel of oil) + overuse of water resources (2 barrels of water for every 1 barrel of oil produced).
Shale gas
Natural gas trapped in impermeable shale rocks. Uses fracking to free the gas- forcing water mixed with chemicals into the rock to split the rock + gas flows into a well.
-lowers groundwater levels, possible chemical contamination of groundwater + surface water, methane gas leaks, which all add to the greenhouse effect.
-risk of minor Earth tremors + ground subsidence from altering the rock underground.
-CO2 released when shale gas is combusted
+increases energy reserves of a country, reducing its need for imports. e.g. in 2015, in the USA, natural gas overtook coal as main generator of electricity (shale gas provided 25% of USA’s gas supply).
+carbon footprint of shale gas is about half that of coal + lower than liquified natural gas
Deepwater oil
Found in the Gulf of Mexico in one of the largest + deepest oilfields.
-Deepwater Horizon Oil spill in 2010 killed 11 crew + released 134M gallons of oil into the gulf of Mexico.
-oil spill of 2010 caused erosion rates in Louisiana to double + 2-7M fish affected by the oil
-spill has exceeded $1B in damages, including shrimp + oyster industries.
Renewable vs recyclable energy
Renewable: solar power, wind energy, HEP
Recyclable: nuclear power
Pros + cons of renewable energy
+will not run out + provides many environmental benefits- reduction of GHG
+reduces countries reliance on importing energy sources form abroad- Chapel Lane Solar Farm serves 75% of homes in Bournemouth
+creates employment- in the USA, renewable energy sector employs 3x the amount of people than the fossil fuel sector
-few countries will be able to completely replace fossil fuels as renewable energy is intermittent(doesn’t consistently produce energy) + physical geog limits it e.g. not all countries have coasts or ‘hot rocks’ heated by magma in geothermal energy
-as a result of oil prices falling during 2015, renewable energy became less attractive due to higher costs e.g. Chapel Lane Solar Farm costs £50M
-can have negative impacts on environment e.g. offshore wind turbines in Quarrendon Fields potentially harms birds
Recyclable energy with pros + cons
Energy derived from reusing energy that would otherwise be wasted- biofuels + nuclear
+nuclear waste can be reprocessed + reused, making it recyclable
+Hinkley Point C in the UK- an £18B project will provide energy for 60yrs and 25k jobs. Will provide 7% of UK energy needs alone.
-safety: nuclear incidents such as Chernobyl, Ukraine + Fukshima, Japan which released dangerous levels of radiation. Also highly toxic radioactive waste must be disposed of.
-cost of building + decommissioning are high. Also uses technology which is costly, limiting use to only developed countries.
Renewable energy on UK energy mix
Wind energy is projected to provide 25% of UK’s energy by 2020.
Solar power energy has increased by 86% between 2014-2015.
Renewables provided 40% energy in UK in 2022.
Biofuels
Fuels produced from organic matter + can be used in vehicles or to generate secondary energy. This can include biomass (burning of plant material + animal waste for energy).
Bio-ethanol: derived from sugar cane, beet + maize
Bio-diesel: derived from animal fats + vegetable oils
Bio-methane: derived from waste + sewage
Pros of biofuels
+readily grown + don’t need specialist machinery- compared to wind turbine installation which requires fossil fuels during construction- more affordable
+biofuels are degradable+ less toxic than fossil fuels
Impact of biofuels on food supply
-Land/ plants that would be used for food production is now used for fuel production- e.g. Maize in the USA, rapeseed oil in the EU.
-Food shortages can happen as a result of farmers changing to a cash crop like sugar cane. This can lead to rising food prices.
Biofuels being carbon neutral
+Cars running on bio-ethanol emit 80% less CO2 than petrol driven cars (use fossil fuels).
-Biomass needs a kick-start to start burning, which requires fossil fuels.This, with the carbon that is released from the burning of the biomass can produce 150-400% more CO2 than coal.
-Deforestation for crop production needs the carbon to sink + increases CO2 emissions.
-Need pesticides + fertilisers, which use fossil fuels in their production- these contaminate water resources with pesticides/ overuse of fertilisers
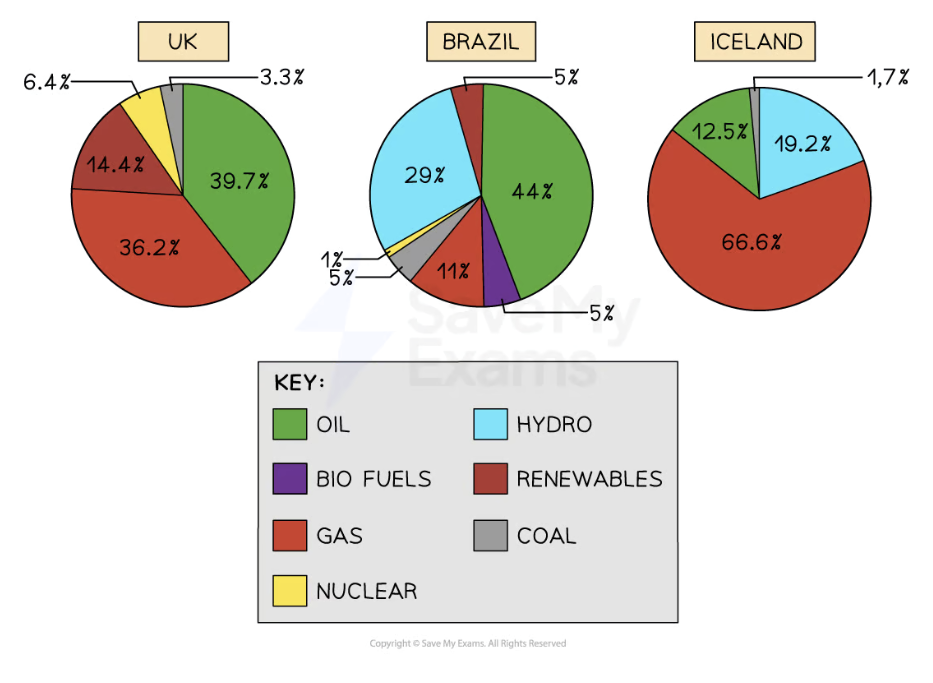
Biofuels in Brazil
Began to diversify its energy sources in the 1970s to improve energy security.
It’s now the largest producer of ethanol from sugar cane- used in a mix with petrol in most cars + vehicles.
+Barrels are worth $50B a year, employing 1.34M people + generating 16% of Brazil’s energy
+90% of vehicles sold can use a combination of petrol + ethanol, leading to a significant reduction in carbon emissions.
-Since 2003, the area used for sugar cane has increased massively + led to displacement of other types of agriculture e.g. cattle pasture, indirectly causing deforestation + therefore increasing carbon emissions in the Amazon Basin.
Radical technologies
Carbon capture + storage (CCS)
C02 is captured from emissions from coal/ gas powered power plants. It’s then compressed + transported by pipeline and then injected into underground reserves.
+could reduce carbon emissions by 19%
-expensive due to the advance technology required
-no one can be sure that the CO2 will stay underground + that it will not leak to the surface + enter the atmosphere.
Hydrogen fuel cells
Combine hydrogen + oxygen to produce electricity, heat + water. They produce electricity for long as hydrogen is supplied + never lose their charge.
+no harmful by-products e.g. CO2
-However, it doesn’t naturally occur as a gas, its always combined with other elements. It must be separated first- uses energy.
-electric cars are expensive -avg £25K, + have a limited distance range between charges (100-150 miles)