Geog 215 Final - Assesments
1/58
There's no tags or description
Looks like no tags are added yet.
Name | Mastery | Learn | Test | Matching | Spaced | Call with Kai |
|---|
No analytics yet
Send a link to your students to track their progress
59 Terms
RStudio
A programming environment (IDE) to help write and develop code
RMarkdown
A formatting language that allows code and text to be knitted into readable output
R
A computer language designed for statistical programming and data visualization
my value
What is not a valid variable name in R
quizGrade <- 5
Assign the value of 5 to the variable quizGrade
#
Symbol for comments
a. 100 <- 10
b. (download) <- file
c. print 10
d. sqrt (100) (CORRECT)
What is a valid FUNCTION call in R?
Integer
What type of variable name is x <- 100
Boolean/logical
What type of variable name is a <- true
floating point
What type of variable name is z <- 3.4
String/text
What type of variable name is y -"St. Louis"
b <- x*z
Write the code that would multiply x and z and put the result into a new variable called b
glimpse ()
Which tidyverse function lets you peek into the structure of the datasets?
select ()
Which tidyverse function lets you keep specific columns of data
mutate ()
Which tidyverse function lets you create and calculate values in a new column
flights |>
filter (month == 1)
Write and R code to filter just the first month (column month) out of a dataset called flights
myData |>
select (day, month, year) |>
glimpse()
Which of the following is a valid tidyverse code?
model
a representation of a process of phenomenon
outlier
An observation that falls far from the line of best fit for a model
residual
Distance from the line of best fit
linear regression
Creates a mathematical formula to see how independent variables impact a dependent variable
standard deviation
The most common method of measuring disparities or variability in a dataset is which of the following statistics?
What type of variation occurs within my variables?
Are there missing values in the dataset?
Which of the following questions are used to guide an Exploratory data analysis?
- What type of variation occurs within my variables?
- Who created the dataset?
- When was the created?
- Are there missing values in the dataset?
True
True or false: you can include all of your data, code, results, and write-up (Intro, Background, Data and Methods, Results, and Conclusion) in an RMarkdown file.
- Location is messy!
- Spatial Data often has spatial autocorrelation.
Why is spatial data "special"? SELECT ALL THAT APPLY
- Location is messy!
- Spatial Data often has spatial autocorrelation.
- Spatial data only applies to datasets that have latitude and longitude
- Spatial data exists separately from temporal data.
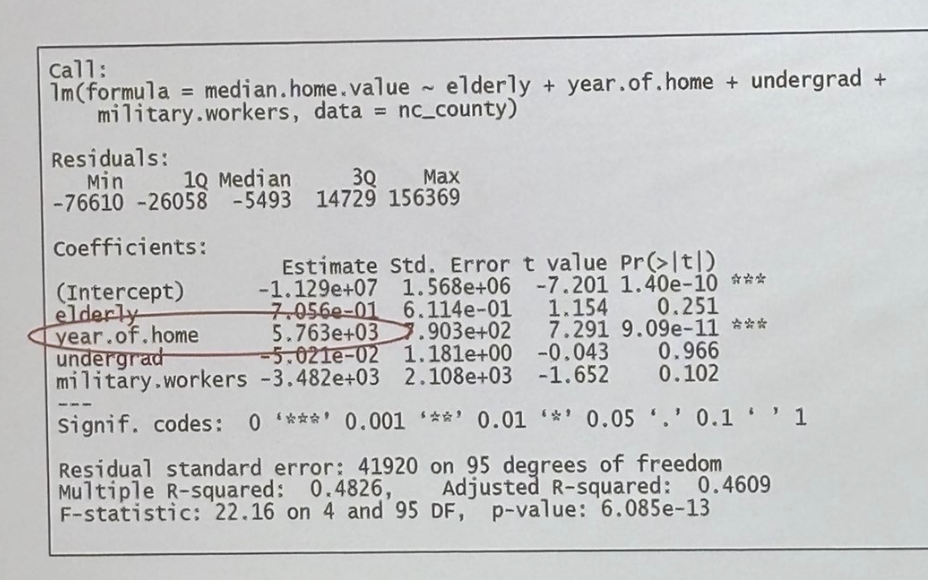
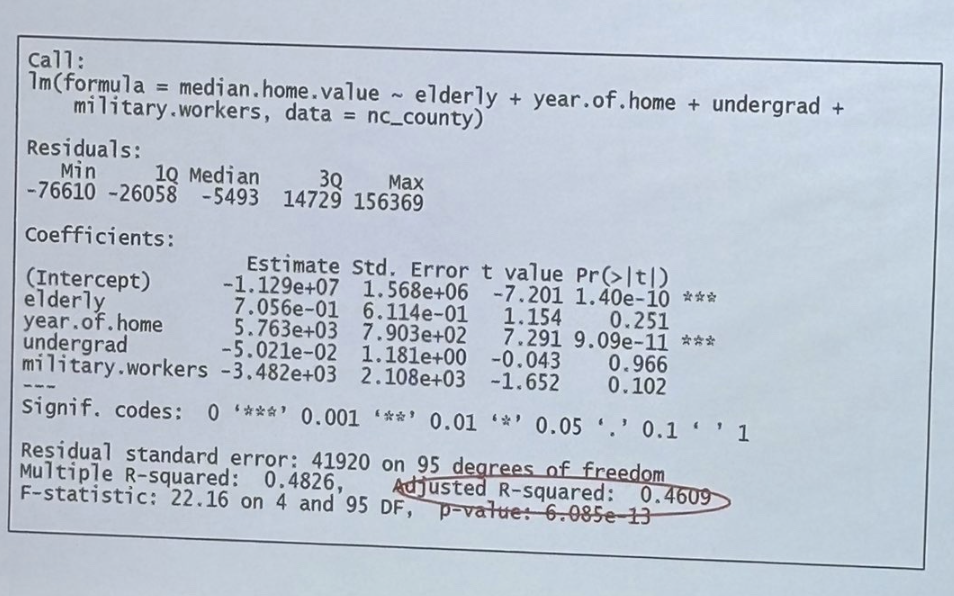
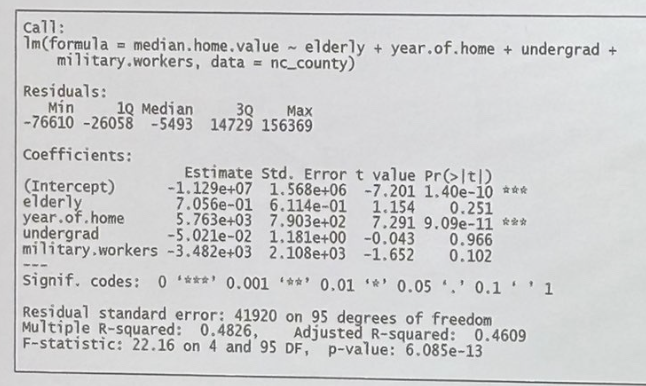
About 46 percent
how much variance in median.home.value does the model explain
Positively related.
Is the yearof.home positively or negatively related to the median.home.value?
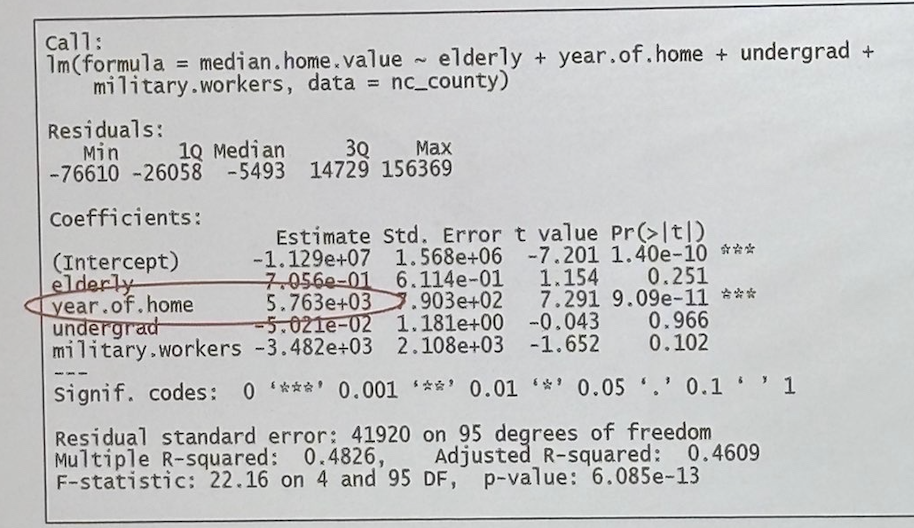
year.of.home
For the regression results above, which variables significantly impact the median.home.value?
.0000186
In the ANOVA results above, what is the numerical value of the p-value (ie, probability, not due to char….)

Yes
For the ANOVA results above, would we say that the median.age.male variable is statistically different between two or more classes?

Reproducible
Obtaining the same results with the same data methods
Replicable
Obtaining consistent results across multiple studies
Open Source
Software that is free to use and modify
Open access
Published research that is free to read and redistribute
Weighted Mean Center
The population center of the US is an example of which spatial statistic?
Standard deviation
The most common method of measuring dispersion or variability in a dataset is what?
What type of variation occurs within my variables?
Are there missing values in the dataset?
Which of the following questions are used to guide an Exploratory Data Analysis? (SELECT ALL THAT APPLY)
What type of variation occurs within my variables?
Who created the dataset?
When was the data created?
Are there missing values in the dataset?
IQR
The difference between the 75th and the 25th percentiles of a dataset are called its…
Equidistant
What map distortion is best preserved with distance?
Conformal
What map distortion is best preserved with shape?
equal-area
What map distortion is best preserved with area?
azimuthal
What map distortion is best preserved with direction?
Ellipsoid
The best model for the shape of the earth is used by computers commonly is…
False
True or False: table joins require both layers to be in the same projection in order to work
graticule
The lines placed on the map that represent longitude and latitude (or other X/Y values) are called the…
false
True or false: when working with spatial data, measuring distance in decimal degrees guarantees the most accurate results
Data structure that uses an open, standard format.
Data structure that stores vector data.
a GeoJSON is a…
Data model for raster data.
Data structure that uses an open, standard format.
Data structure that stores vector data.
Data abstraction for collected imagery.
table join
A join connecting two or more tables using attribute data.
Cardinality
The relationship between entities in a relational database
key
An attribute used to join tables.
Spatial Join
A join connected two or more tables via their locations.
True
True or false: the smaller the cell size in a raster, the better the resolution
attribute
a property of spatial data, often stored in columns in a table, is called a(n)
vector
model used for discrete data
raster
model used for continuous data
entities
real world objects
representation
features
true
True or false: regression models assume that the independent variables are unrelated to each other
Positively related
is the year.of.home positively or negatively related to the median.home.value?