ap stats final test review
1/102
There's no tags or description
Looks like no tags are added yet.
Name | Mastery | Learn | Test | Matching | Spaced | Call with Kai |
|---|
No analytics yet
Send a link to your students to track their progress
103 Terms
what is a quantitative variable
a numerical value
what is a categorical variable
variable that takes on groups and labels
what is association
when knowing the value of one variable helps to predic the value of the other variable
if theres no association on a bar graph, what should it look like
all bars are the same length
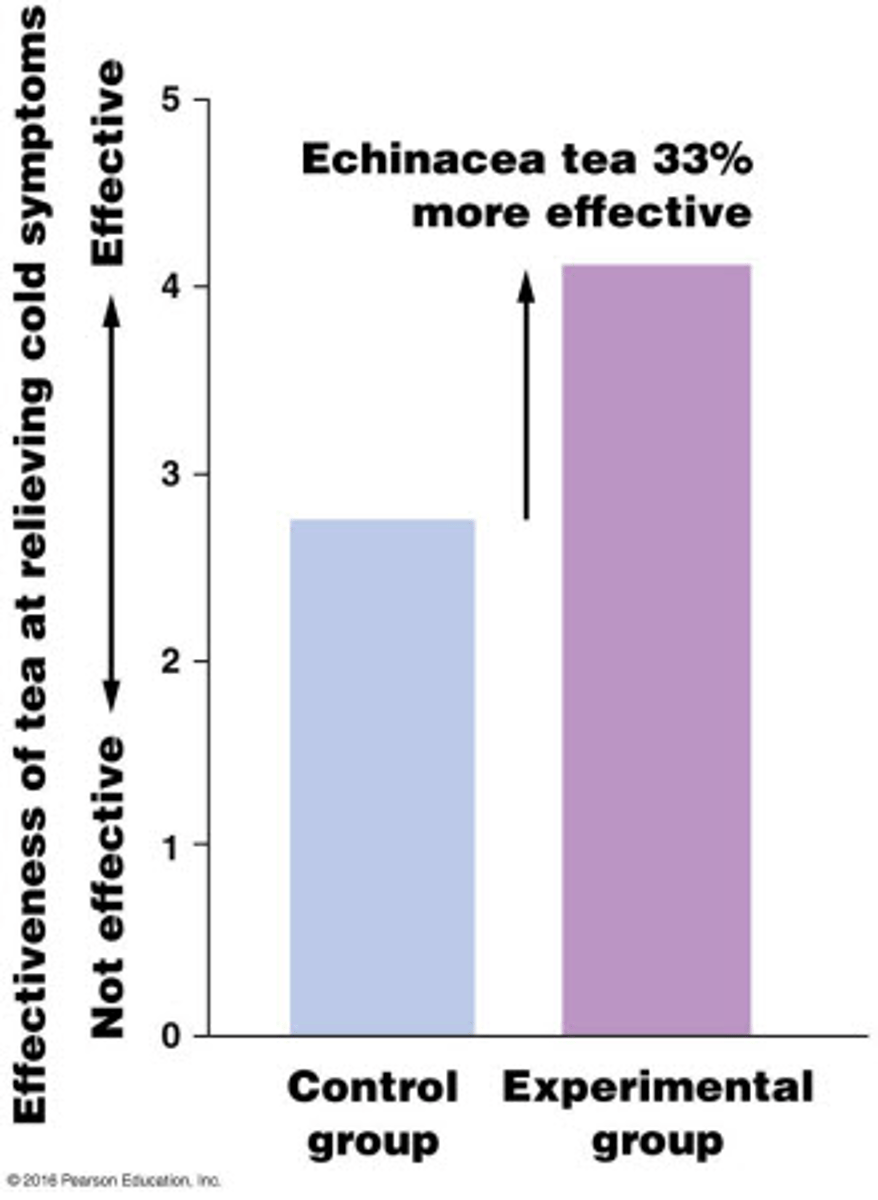
what are the features of misleading graphs?/
the axis doesn't start at 0
theres an image in a bar graph
what is a side by side bar graph
a graph where each bar represents the frequency or relative frequency for each group
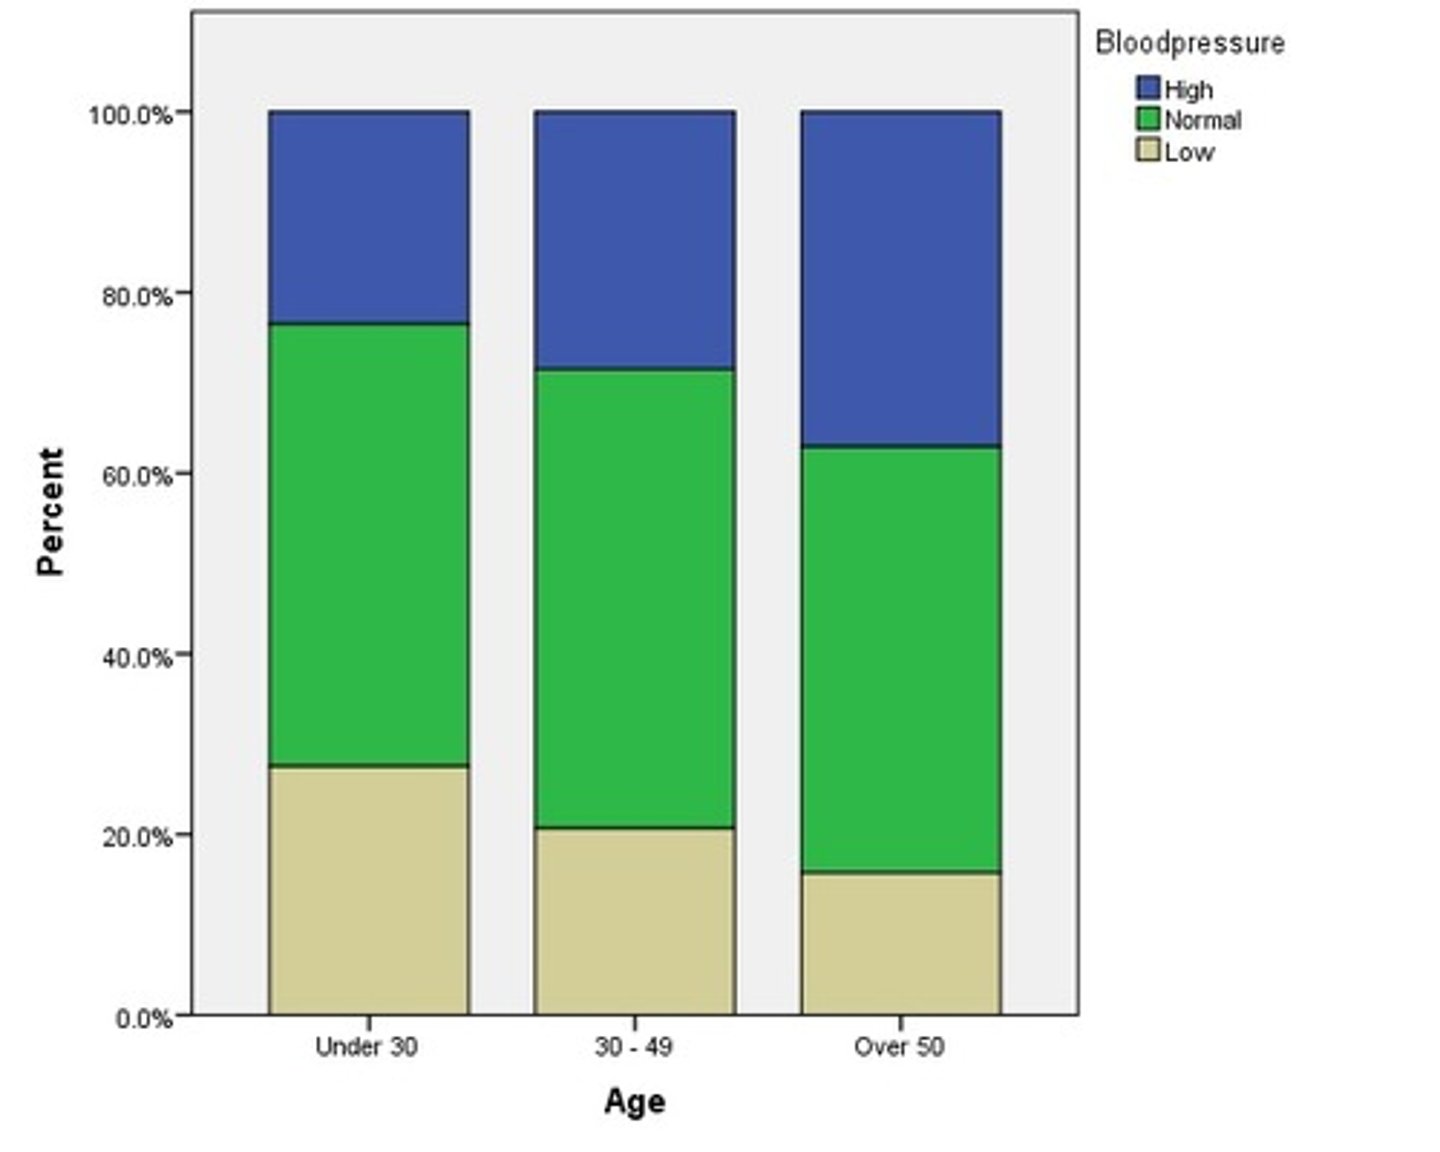
what is a segmented bar graph
graph where bars are staced to make 100%
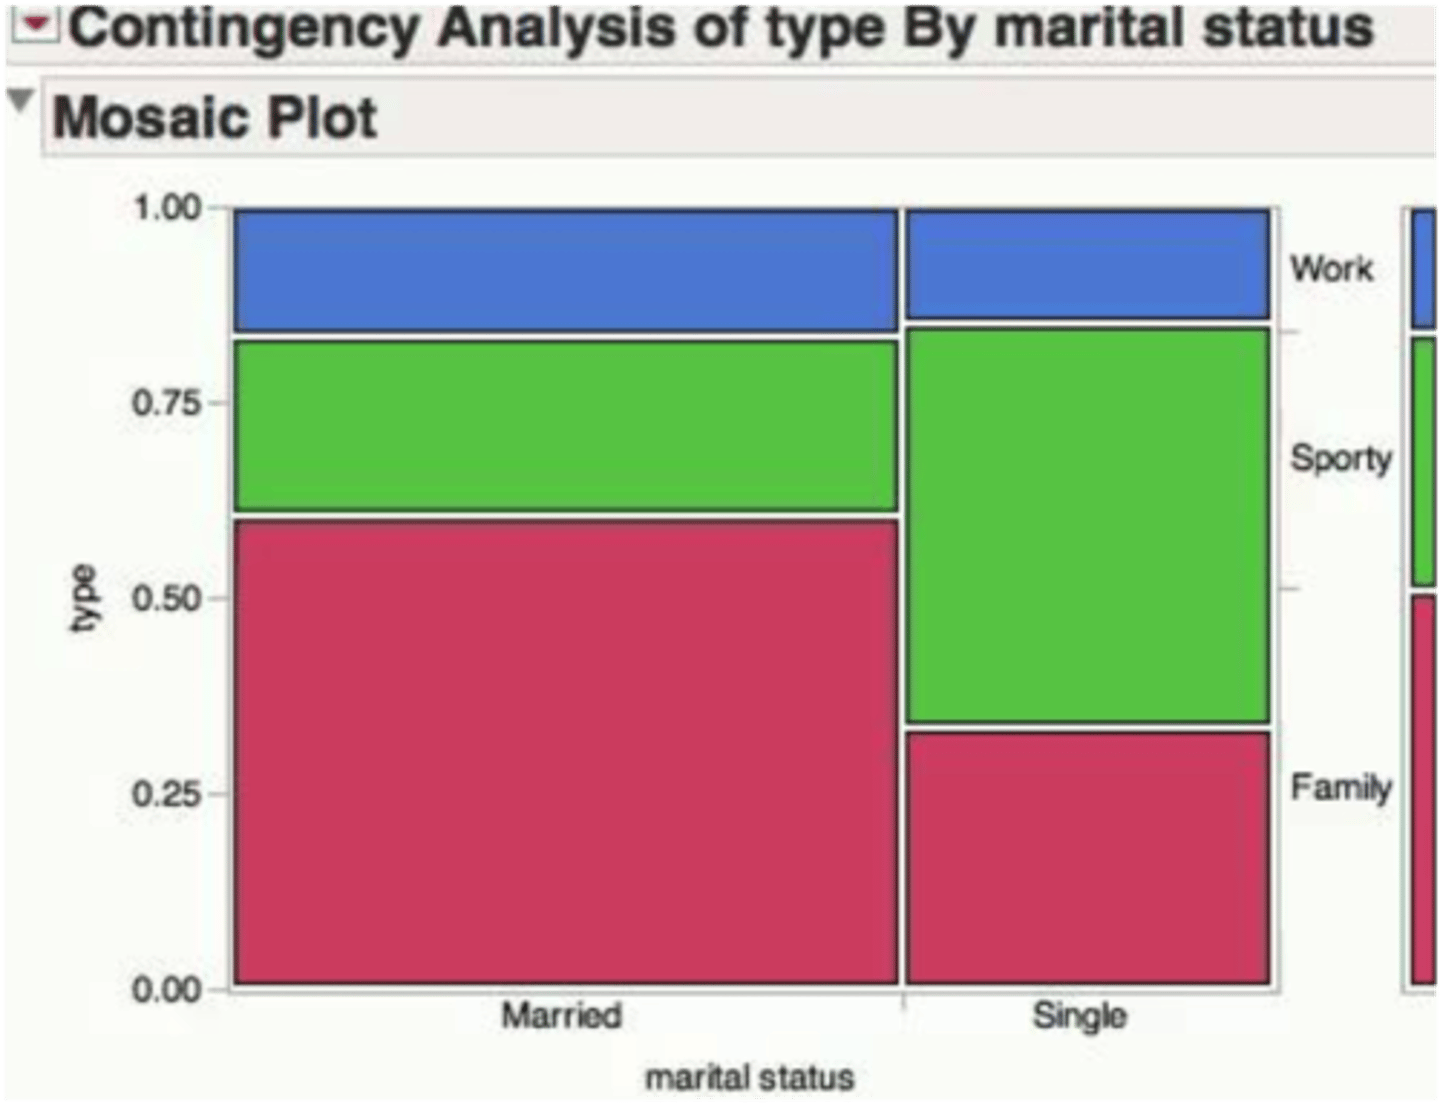
what is a mosiac plot
a segmented bar graph where the bar width is proportional to the group size
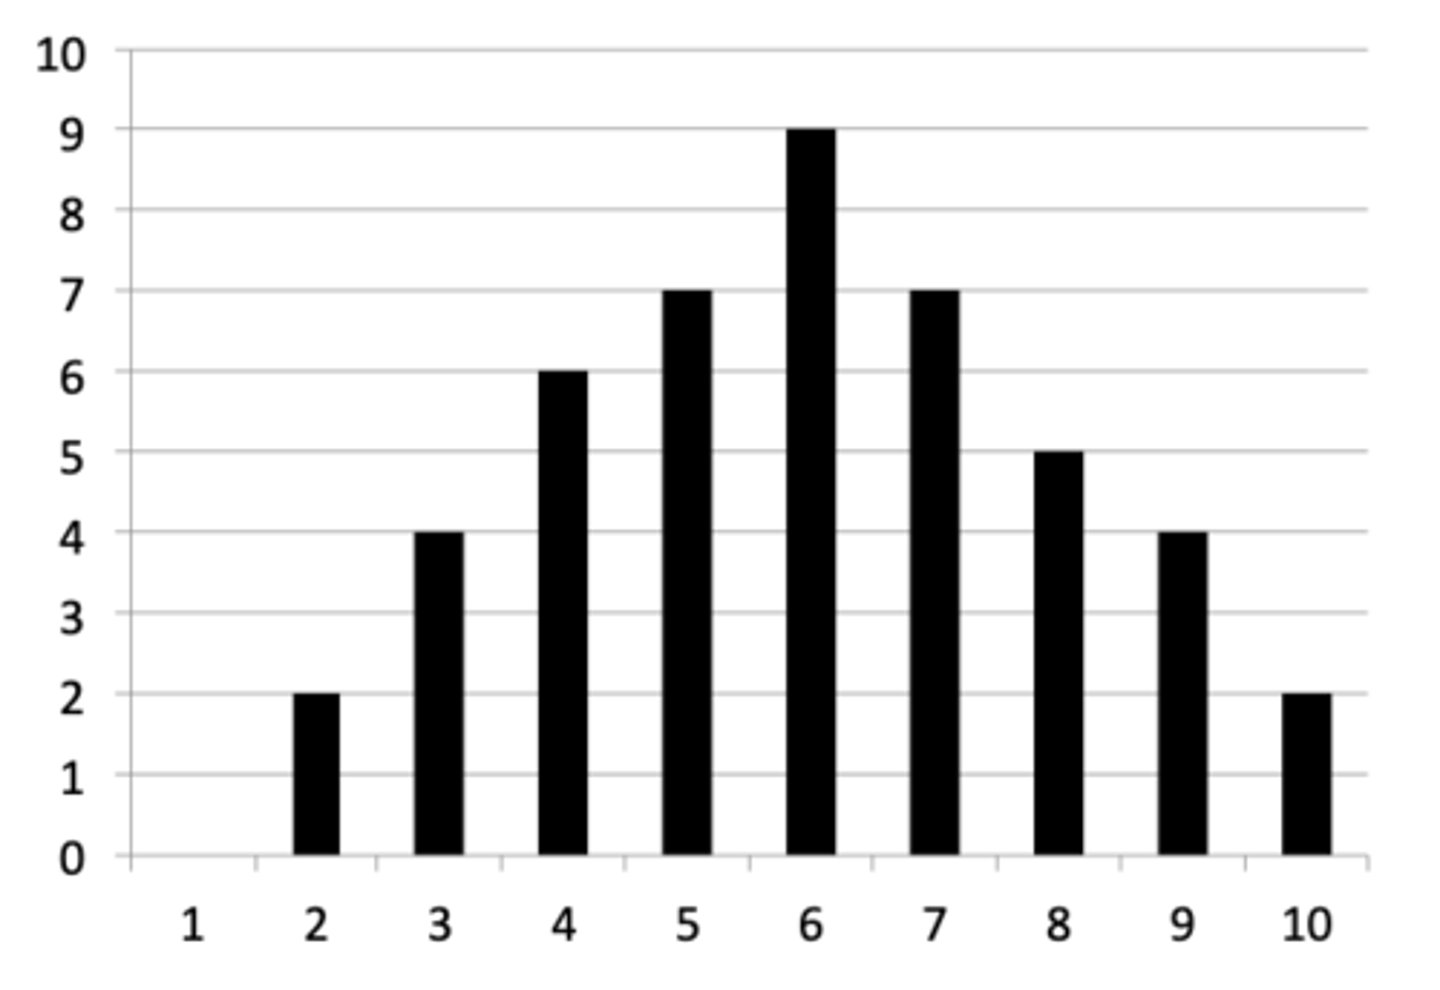
what does a symmetric graph look like
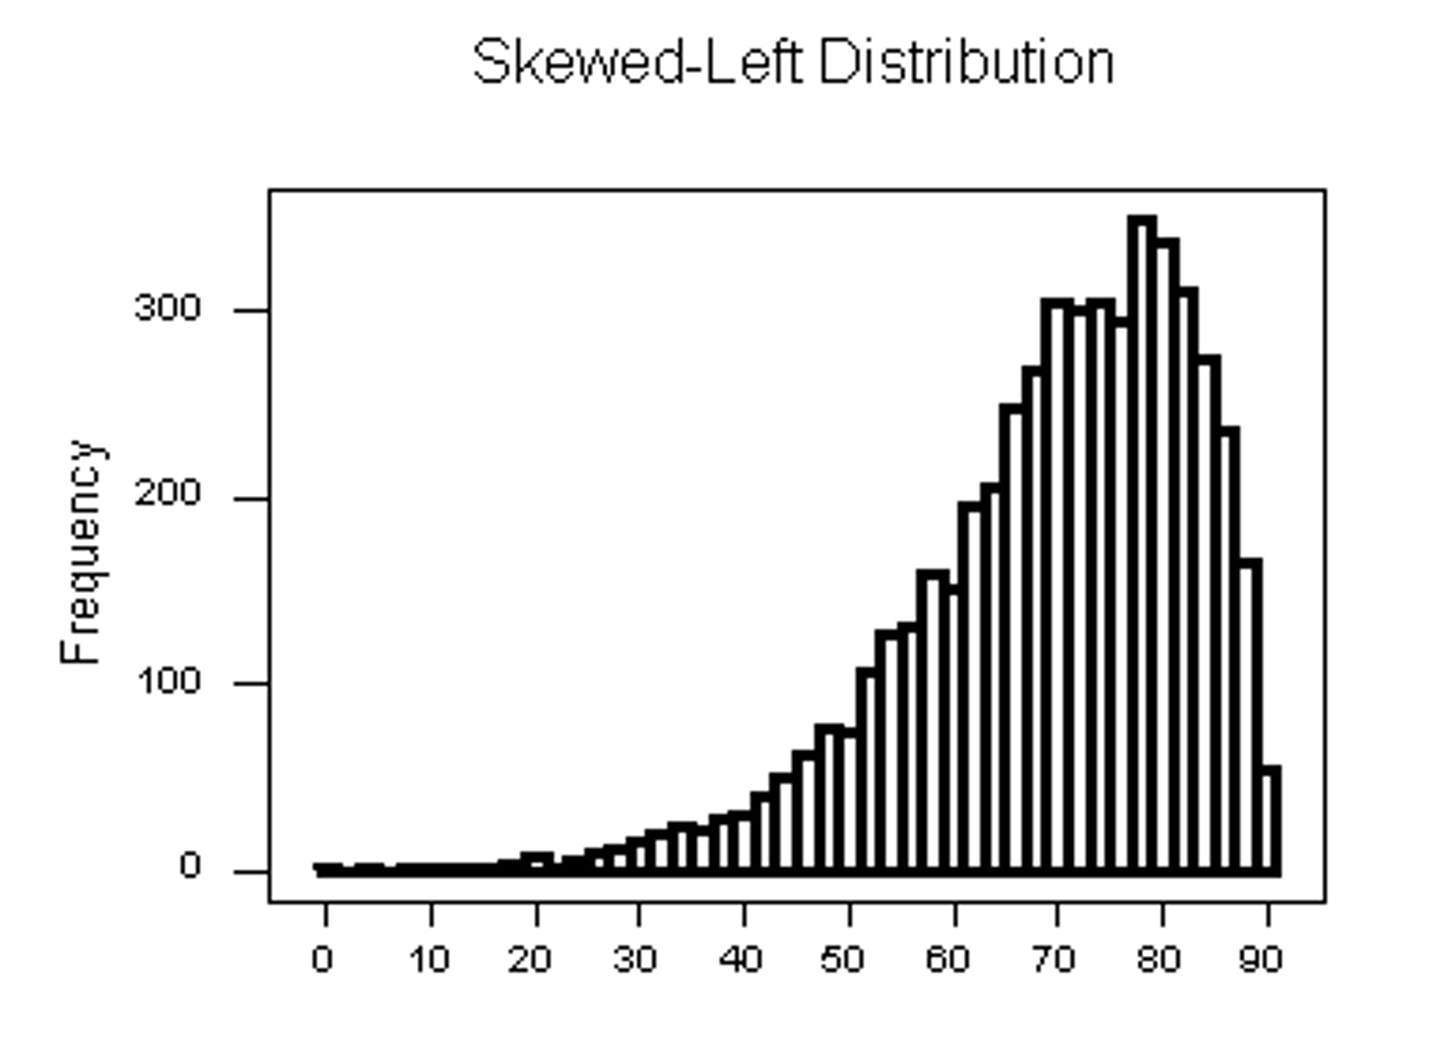
what does a skewed left graph look like
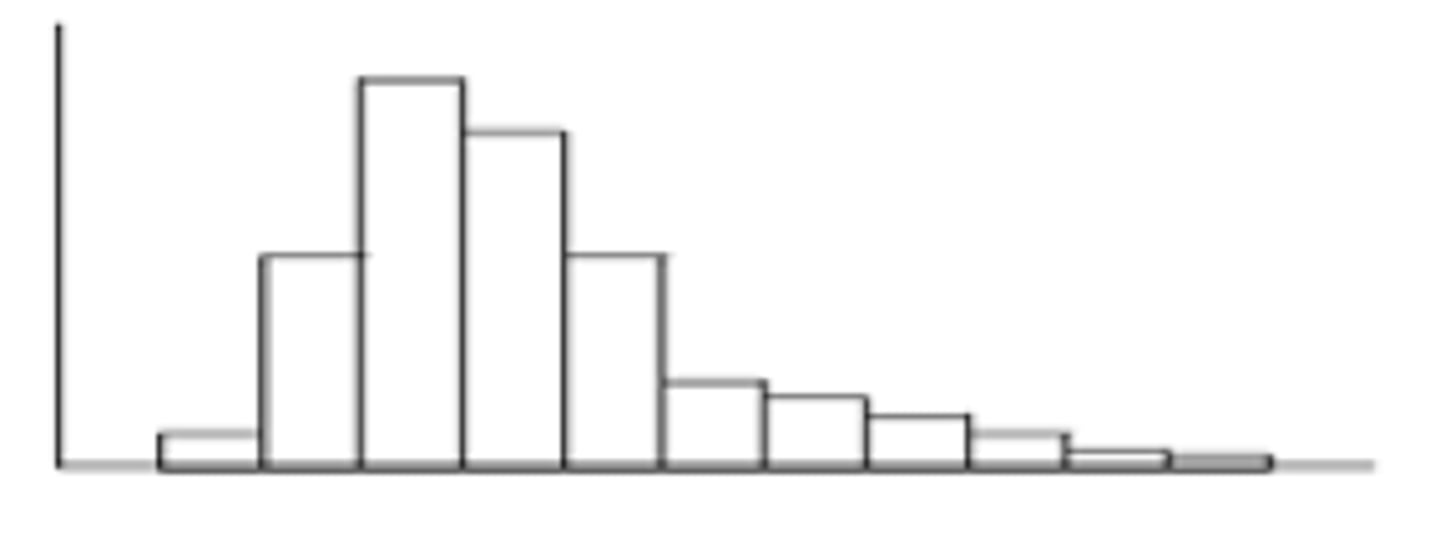
what does a skewed right graph look like
how do you describe a distrubution?
Shape
Outliers
Center
Variability
*make sure to use context
if the distribution is skewed we use the ________ as the center and the ______ to measure the variability
median, IQR
if the distribution is symmetric we use the ________ as the center and the ______ to measure the variability
mean, standard deviation
how do you calculate the range
max-min
what is standard deviation
how much the data typically varies from the mean
is the median resistant to outliers?
yes, its not greatly effected by outliers
are the mean/standard deviation resistant to outliers?
no, greatly effected by outliers
how do you calculate a low outlier?
Q1-1.5 x IQR
how do you calc. a high outlier?
Q3+1.5 x IQR
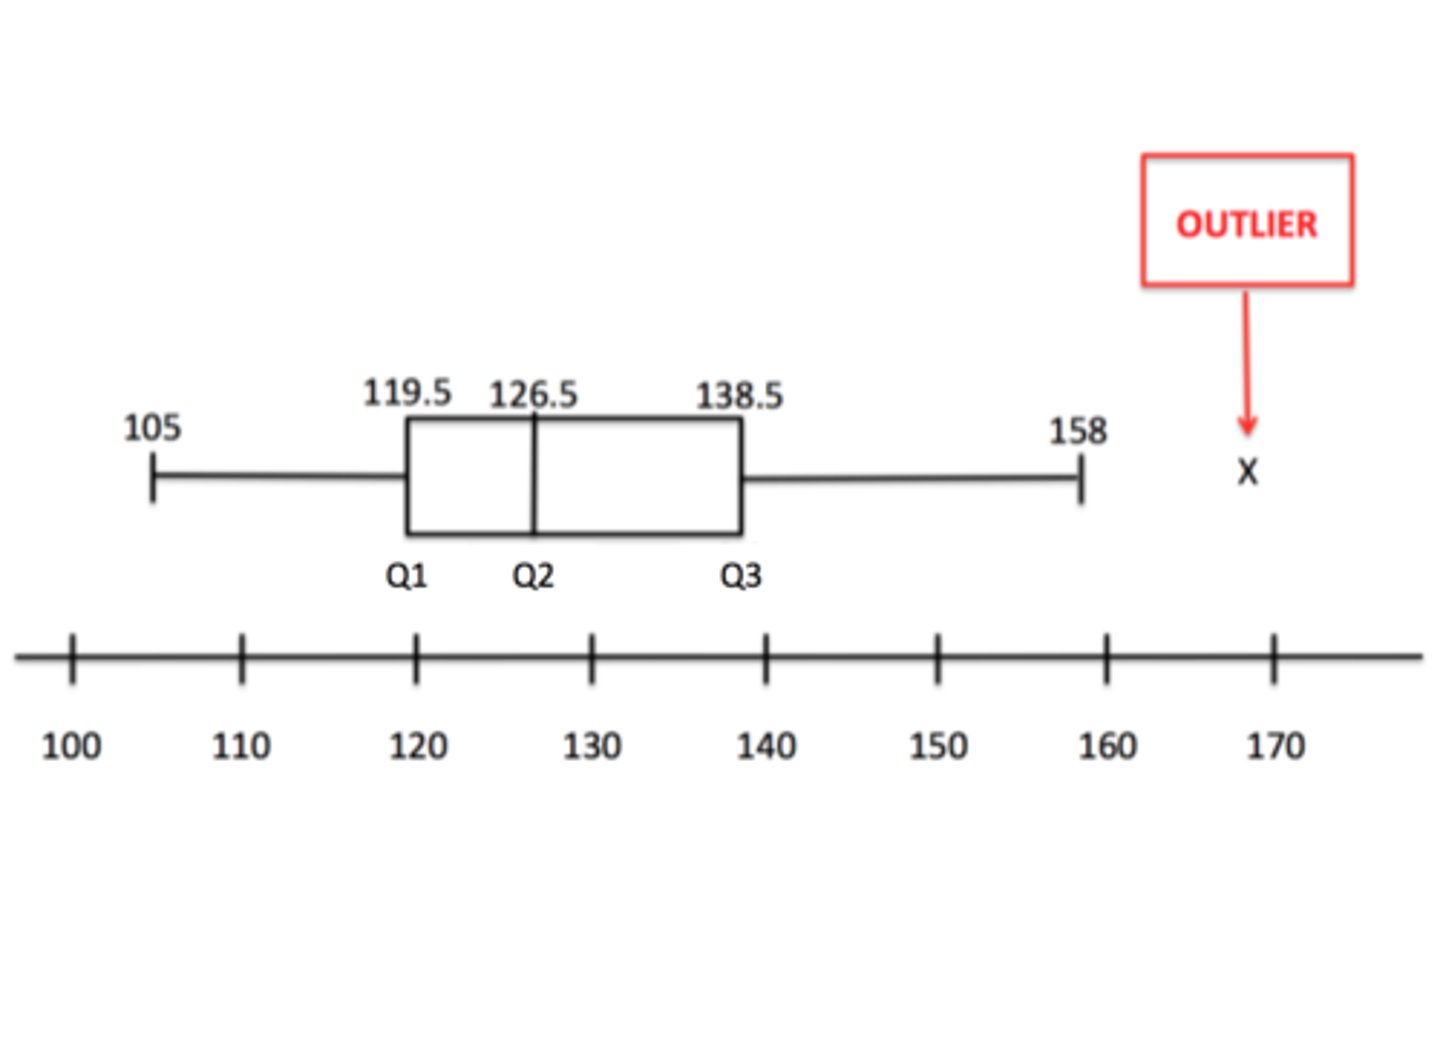
what is included in the 5 number summary?
minimum, Q1, median, Q3, maximum
how are outliers displayed in a modified box plot?
*
what is a percentile (relative cummalative frequency)
the percent of data values less than or equal to a given value
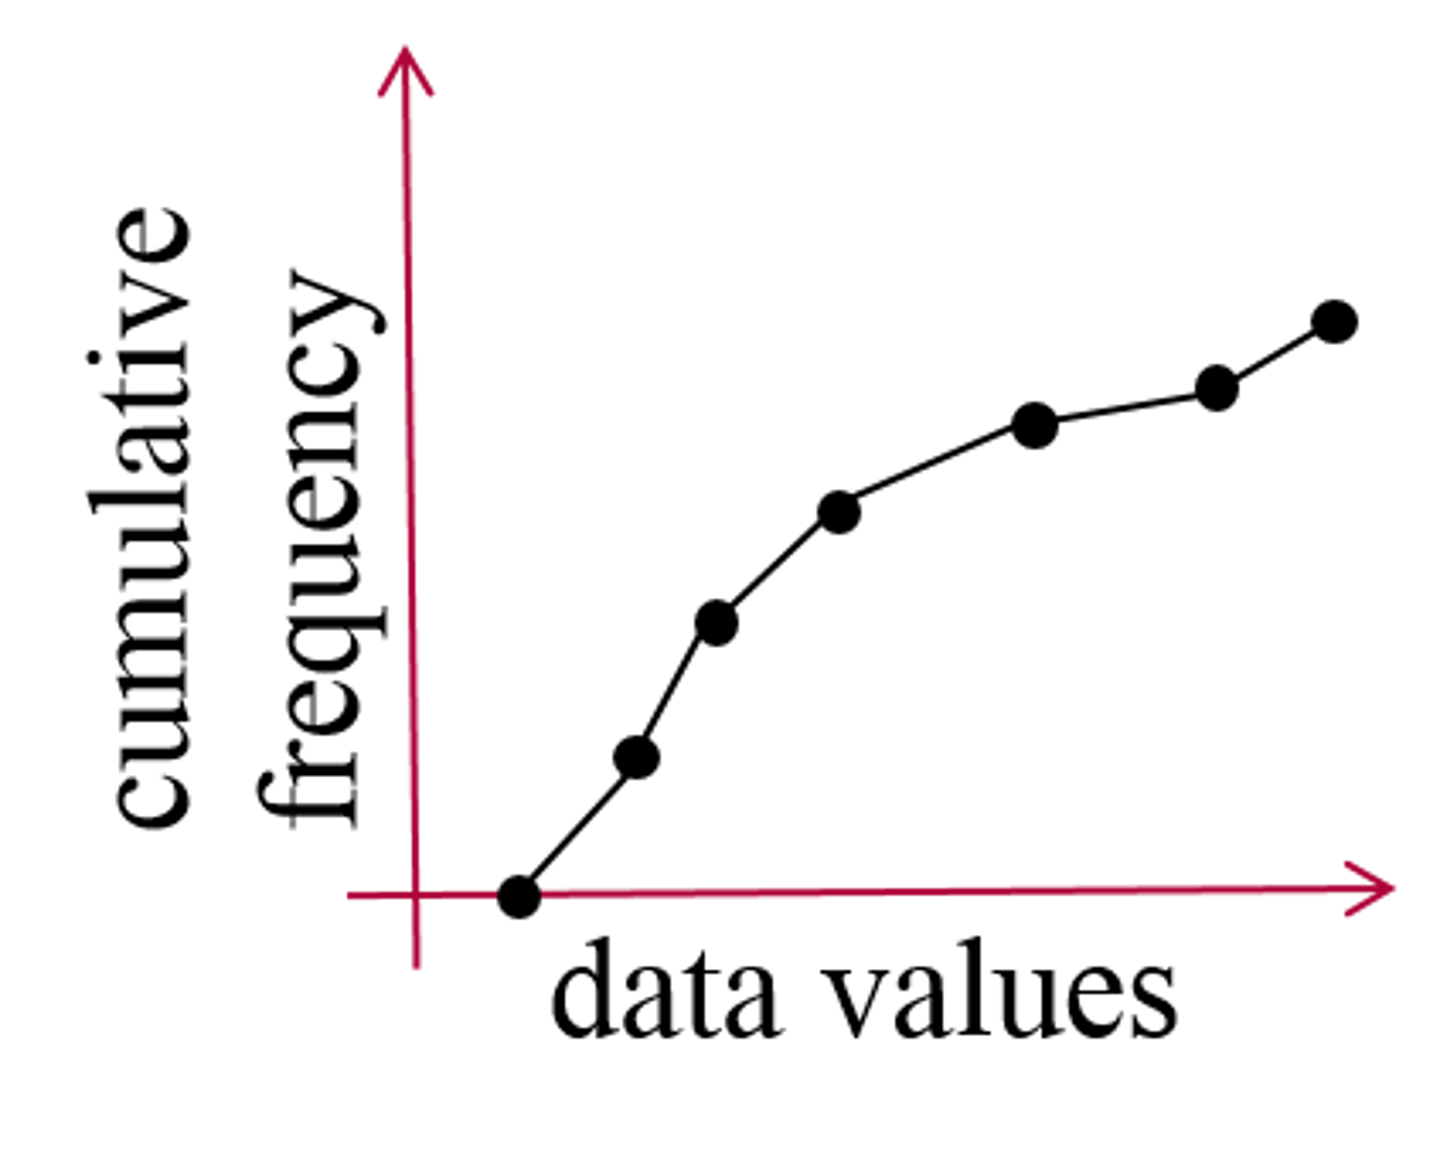
what is an ogive
a graph that represents the cumulative frequency or cumulative relative frequency for the class
in an ogive, which percentiles do the Q1, med, and Q3 represent
Q1= 25%
med=50%
Q3=75%
how do you calculate a z score
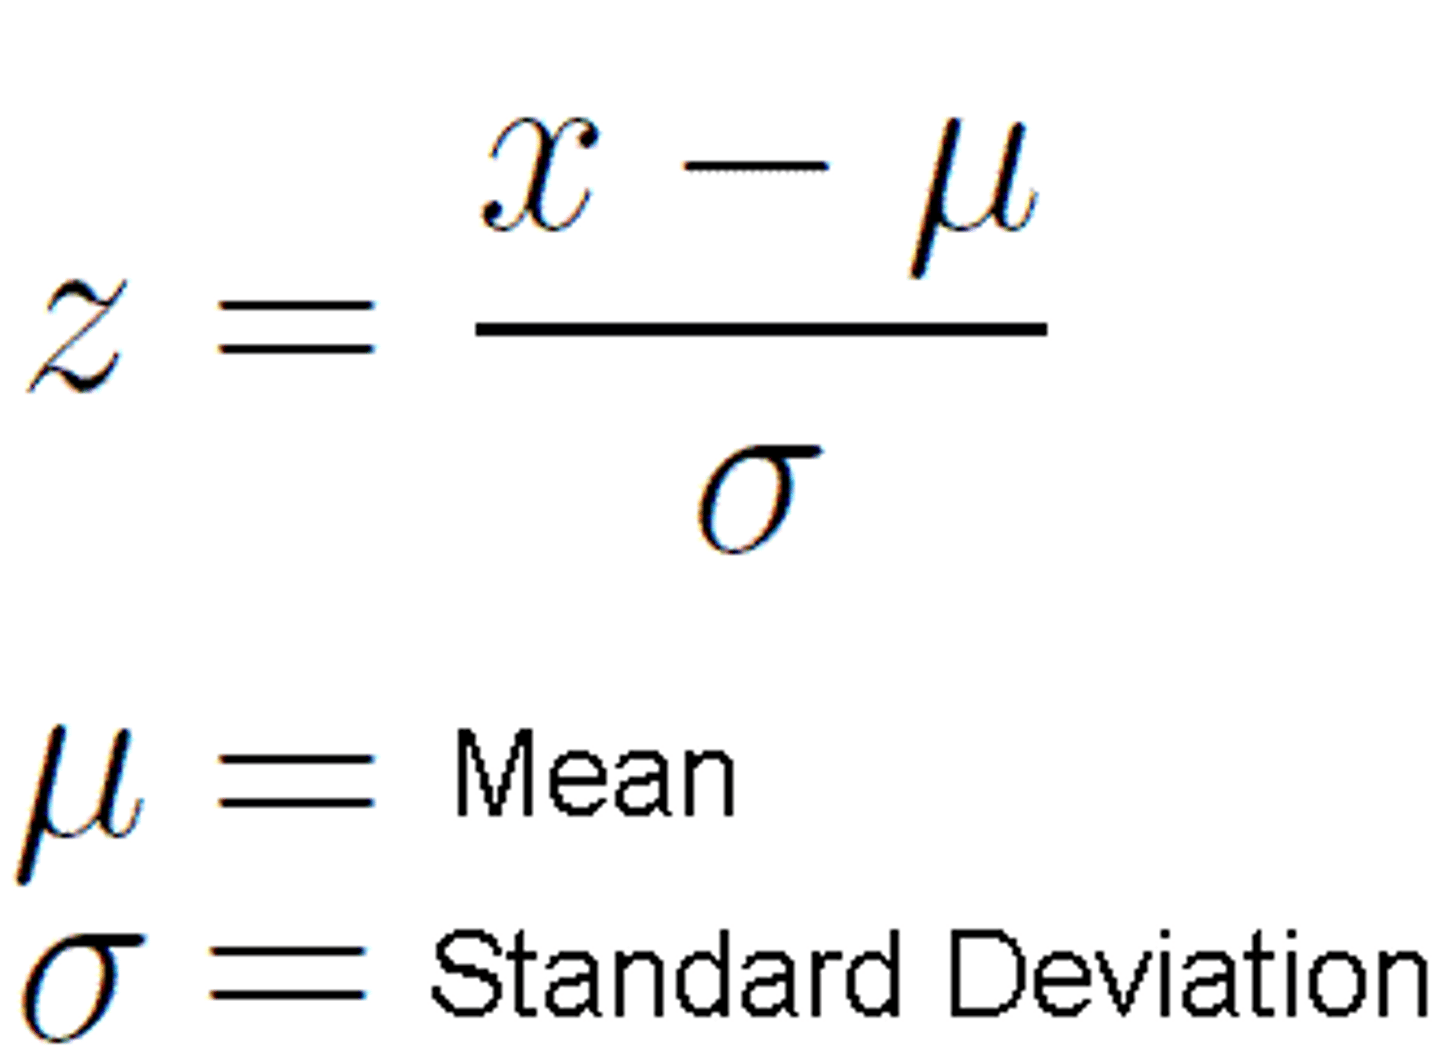
what does a z score tell us?
how many standard deviations above or below teh mean a data value is
how does the shape of linear data change with +/- of a constant
stays same
how does the shape of linear data change with multiplication/division of a constant
stays the same
how does the center of linear data change with +/- of a constant
+/- by the constant
how does the center of linear data change with multiplication/division of a constant
multiply/divide by the constant
how does the variability of linear data change with +/- of a constant
stays the same
how does the center of variability data change with multiplication/division of a constant
multiply/divide by the constant
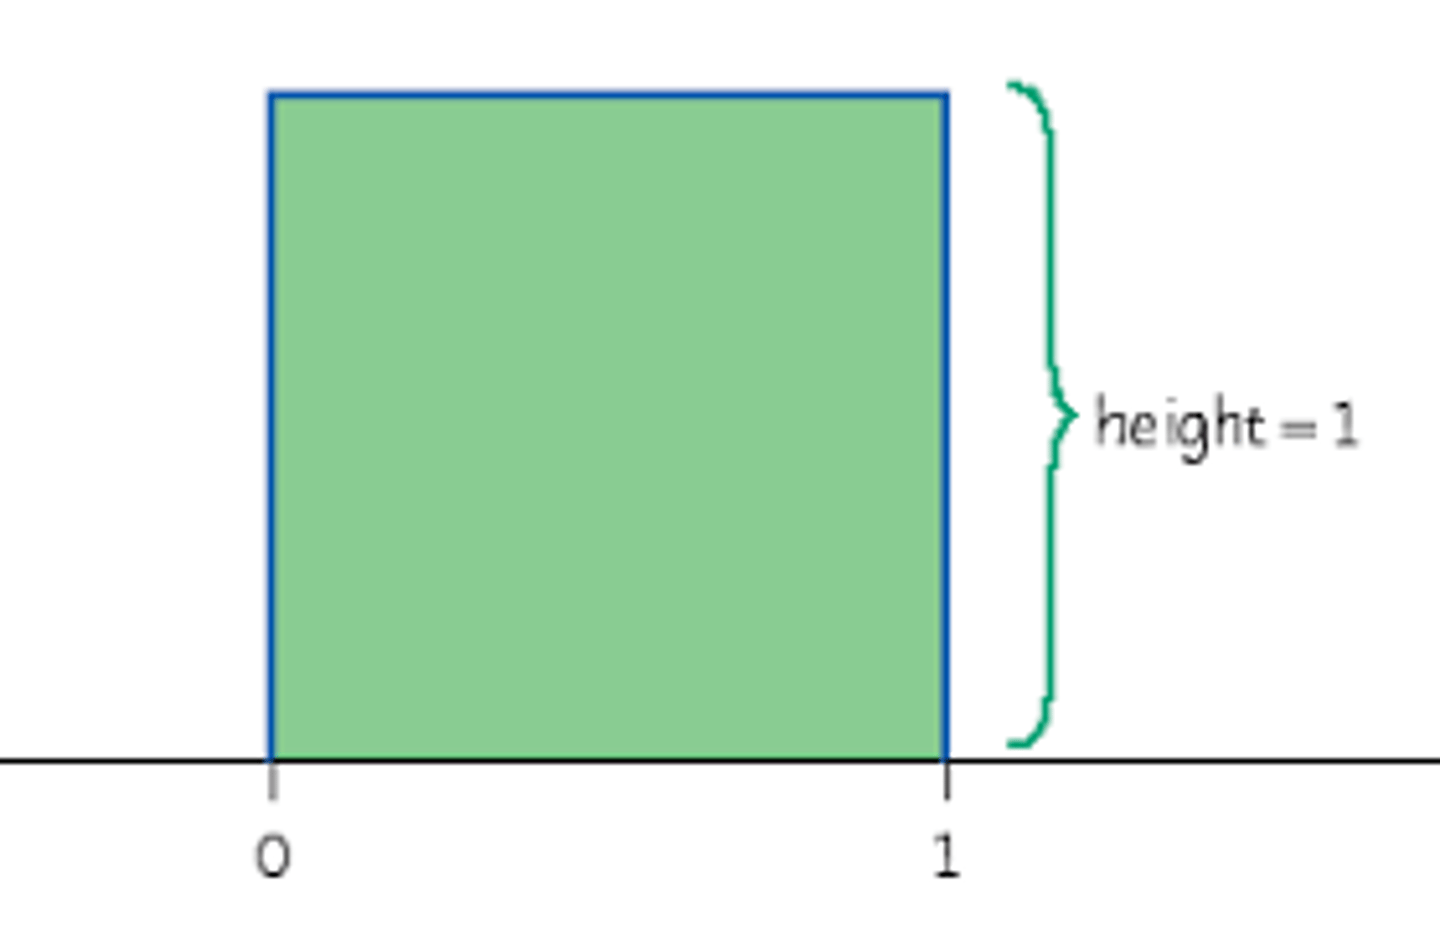
what is the total area of a density curve
1
what does a uniform curve look like
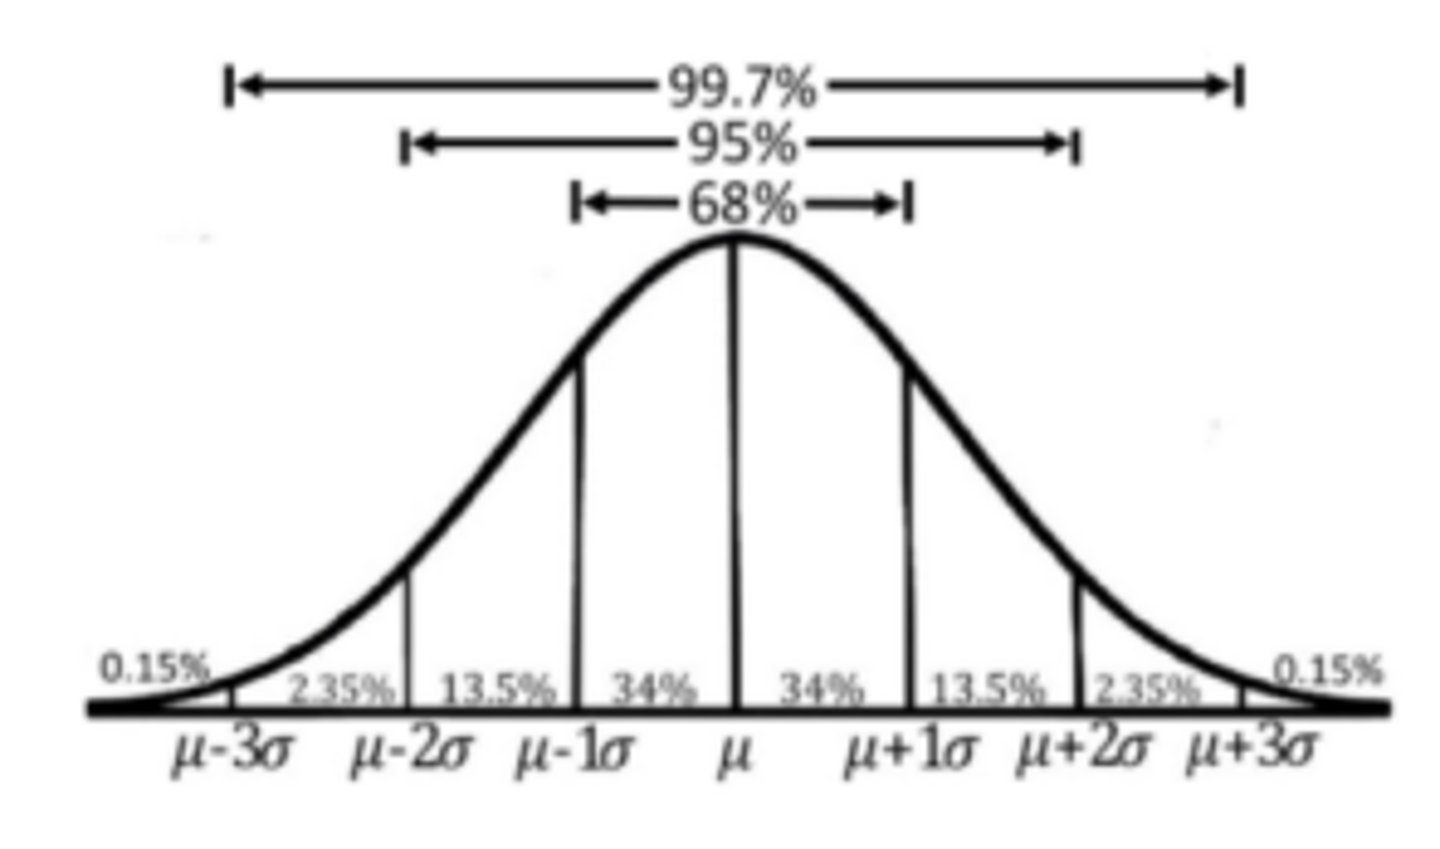
what is the empirical rule
if a distribution is approx. normal:
what is an explanatory variable
(x variable) used to predict/explain
what is a response variable
(y variable) outcomes of the study/experiment
how do you describe a scatterplot?
D: direction (+/-)
U: unusual features (odd points, gaps, clusters)
F: form (linear/non linear)
S strength (weak, moderate, strong) correlation
*context
what is correlation (r)
tells you the direction and strength of the linear relationship
interpret correlation (r)
the linear relationship between (x) + (y) is (strength) and (direction).
interpret coefficient of determination (r^2)
the percent of variation in (y) can be explained by the linear relationship with (x). *closer to 1/100% is good)
interpret y-int
when (x=0), the predicted (y) is (y-int)
interpret slope
for each additional (x) the predicted (y) increases/decreases by (slope)
how do you calculate a residual
actual-predicted
interpret residual
the actual (y) is (residual) below/above the predicted value
what is extrapolation
predicting data beyond the measured points
what does LSRL stand for and what does it do
least squares regression line; minimizes the sum of the squared residuals
what characteristics do you want in a residual plot?
- no pattern
- x values and residuals
how do outliers effect linear data sets?
horizontal: tilt the line
vertical: moves line up or down
what is a high leverage point
have large or small x values and horizontal outliers
what is an influential point
when removing the point changes the LSRL
describe how to perform a SRS
1) label (assign numbers)
2) randomize (random # generator)
3) select (find the things that correspond to the #'s)
what is a stratified random sample
a sample where we split the population into groups (strata) and take the SRS from each group
*each strata has individuals with similar characteristics
*must stratify ona variable that will effect responses
a good sampling method is....
-unbiased
-low variability
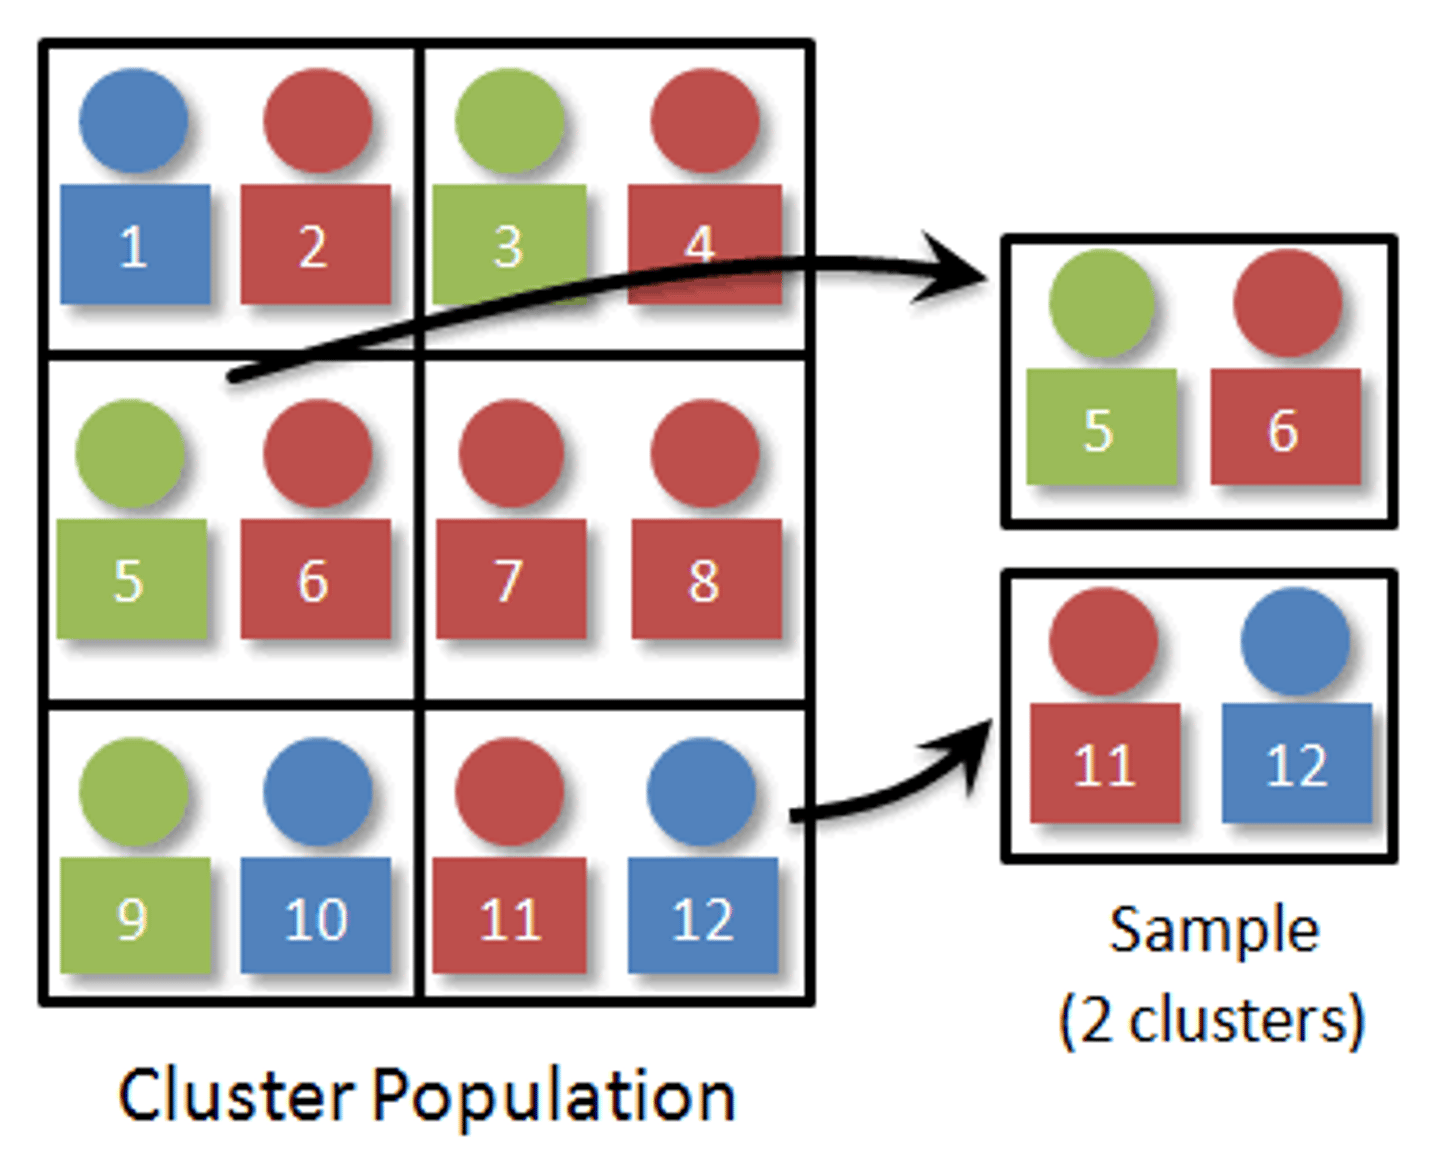
what is a cluster sample
sampling all from SOME groups
what is a systematic sample
choosing random starting points and systematically taking objects at certain # apart
"every 8th person"
what is undercoverage
when some members of population can't be included in the sample
what is nonresponse bias
whena an indivual chosen for a sample doesn't respond or can't be reached
what is response bias
bias in the wording of a question
-interviewer bias
-people lying
what is an observational study
using or observing data already collected, no treatments are imposed.
what is an experiment
impacts treatments and allows u to establish cause and effect
what is a confounding variable
an outside variable that could influence the explanatory and response variables
what are experimental units
the people (subjects) or things (units) the experiment is performed on
what is a treatment
what is done to the units/subjects
*determined by explanatory variable
describe an experiment
1) random assignment
2) replication: more than 1 in each group
3) comparison: 2+ treatments
4) control: other variables stay the same
describe random assignment
1) label
2) randomize
3) assign
* shows causation and minimizes confounding variables
what is placeabo effect
when a fake treatment appears to work
what is a randomized block design
separate the subjects into blocks, then randomly assign to treatments in each block
-block ona characteristic that can impact results
what is a matched pairs design
the subjects are paired up and randomly assigned to treatments
-each subject recieves each treatments in a diff. order
what does statistically significant mean
when results of a study are too unusual to happen by chance alone
*5%
what is the law of large numbers
if we do something many times, the proportion will approach the true probablity
what is a simulation
imitation of chance behavior based on a model that accurately reflects the situation
describe a simulation process
1) describe how you will simulate one trial
2) perform many trials
3) use the results to answer the question
what is a compliment
the probability of an eent NOT happening
what is the probability of a compliment
1-P(A)
what are mutually exclusive events (disjoint)
events that can't happen at the same time
if mutually exclusive:
P(A or B) = P(A)+P(B)
what is a probability model
lists all possible outcomes and their probabilites
-probabilites must add to 1
-all probabilities between 0-1
what is the general addition rule
what is conditional probability
P(A/B) "probability of A given B"
-look at a specific row or column in table
what does it mean to be independent
when knowing one event has or has not occured does not affect the probability of the second event
if:
P(A)= P(A/B) = P(A/complliment of B)
then: A and B are independent
what is the general multiplication rule
P( A and B ) = P(A) P(B/A)
This is NOT on the formula sheet.
how do you calculate the P(at least one)
1-P(none)
what is a discrete random variable
fixed number of values with gaps in between
how do you "add" standard deviaiton
add the VARIENCES (SD^2+ SD^2)
how do you know if something is binomial
B: binary- success and failure
I: independent trials
N: number of trials (FIXED)
S: same probability of success
*binomcdf(n,p,k)
n=number of trials
p=probability of success
k=number of successes
how do u calculate mean and SD for binomial dist.
mean= n times p
SD= sqrt (n times p) (1-p)
what are the conditions for a geometric distriution:
B: binary
I: independent
T: trials til success
S: same probability of success
what is parameter
a number that describes a population
what is a statistic
a number that describes a sample
what is a sampleing distribution
the dist. of values of a statistic for all possible samples of a given size from the population
as sample size increases, variability ____
decreases
what is a point estimate
a statistic that provides a reasonable estimate for the population parameter
interpret confidencelevel
if we take many many samples of the same size, and calculate confidence intervals about __% of them will capture the true (parameter in context).
what are the conditions for a confidence interval for p
1) random
2) n<10% of pop.
3) approx. normal (n times p)
what is the 4 step process for population proportion
state: parameter and confidence level
plan: name procedure,conditions
do: p hat +/- Z* times (standard error)
if you don't know p hat, use what value?
.5
4 step process for confidence interval for p1-p2
state: true diffeence in proportions
plan: 2 sample z interval for p and conditions
do: p1-p2 +/- Z* (formula sheet)
what is null hypohesis (ho)
assuned true by default
alternative hypothesis (ha)
what you are trying to prove