STATS Test 2
1/44
Earn XP
Description and Tags
Describing Quantitative Data
Name | Mastery | Learn | Test | Matching | Spaced | Call with Kai |
|---|
No study sessions yet.
45 Terms
Finding the “center”
measures of central tendency show where the “center” of the data point lies
The Central Value
May or may not be a typical or frequent value in the data set
The common measures in a data set
Mean
Median
Mode
Mean Definition
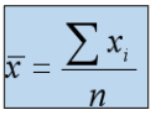
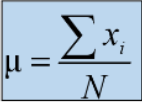
the sum of the values divided by the number of values
if the data is from a sample the mean is shown as x bar
if the data is from a population the mean is shown as mew
X Bar
If you are working with a sample
Mew
If you are working with a population
Calculating the mean
Add up everything (ex. the ages of all the supreme court justices)
Divide the sum by the amount there are (ex. how many ages are there to count up?)
sum over the number for the mean = #
interpretation: if (ex. age) were divided evenly among (ex. 9) judges, each would be (ex. 67.8) years old.
Median Definition
The median identifies the data set center by establishing a value such that at least half the numbers in the data set are at or above that value and at least half the numbers are at or below that value
Median Facts
the median is the middle value in an ordered list of the data (order it from smallest to largest)
when data has extreme values, the median is usually preferred to find a central location. it is less affected by extremes than the mean.
if there are an even number of its, the median is the value of the middle item (n+1)/2 in an order
if there are an even number of its, the median is the value of the average between the two middle items. (n/2) and (n/2)+1 in an order
Calculating the Median
Ex.
Order the list from smallest to largest
There are 9 values
so (n+1)/2 is (9+1)/2 which is 5
the median is the 5th value in the ordered list
the median, in this case, is 65 (don’t forget the unit. in this case, years)
Interpretation: at least half of the justices are 65 years old or older and at least half are 65 years old or younger
Mode Definition
The mode of a data is the most frequently occurring value
a data set can have zero/none, one (unimodal), two (bimodal), or more (multimodal) modes
Measures of Dispersion Definition
Measures of dispersion tell us how much variation or dispersion there is in the data around the central value. in other words, how spread out are the data points?
Common Measures of Dispersion
Range
mean absolute deviation (MAD)
Variance
Standard Deviation
Range Definition
the difference between the smallest and the largest values in the data set
the simplest measure of variability
very sensitive to the smallest and largest data values
Range Example
Order from smallest to largest
Largest number - smallest number = range (units)
Interpretation: There is a (#) difference between the (ex. oldest and youngest justices)
Mean Absolute Deviation (MAD) Definition
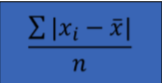
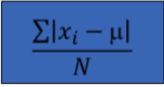
The MAD measures the average absolute distance (or deviation) of values in the data set from the data set mean
if the data set is a population or sample it changes the equation slightly between X bar and Mew
Mean Absolute Deviation (MAD) Types
If the data is a sample
if the data is a population
Mean Absolute Deviation (MAD) Sample
X Bar
Mean Absolute Deviation (MAD) Population
Mew
Mean Absolute Deviation (MAD) Example
organize the data in smallest to largest order
have the mean
Study the equation

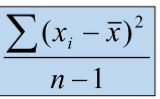
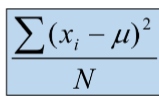
Variance Definition
The variance is the average of the squared differences between each data value and the mean
if the data set is the sample, the variance is denoted by s2
If the data set is a population the variance is denoted by o2
Variance Sample
s2= image
Variance Population
O2=Image
Distribution of Shape
symmetric
bimodal
positively skewed
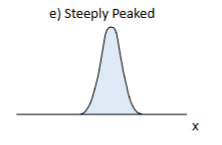
steeply peaked
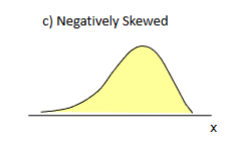
negatively skewed
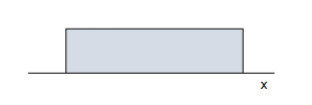
flat
Distribution of Shape: Symmetric
cut in half it would look the same

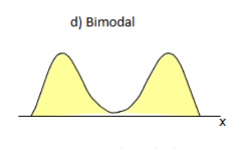
Distribution of Shape: Bimodal
2 humps
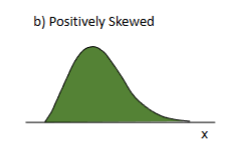
Distribution of Shape: Positively Skewed
skewed right?
Distribution of Shape: Steeply Peaked
One giant peak and not much (if anything) on the sides
Distribution of Shape: Negativly skewed
Skewed Left
Distribution of Shape: Flat
A flat graph like a box or rectangle.
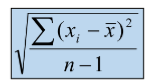
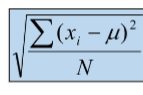
Standard Deviation Definition
The standard deviation of a data set is the positive square root of the variance
it is measured ion the same units as the data, making it more easily interpreted than the variance.
Standard Deviation Formula Sample
if the data set is a sample, the standard deviation is denoted by s= image
Standard Deviation Formula Sample
if the data set is a population the Standard Deviation is denoted by o = Image
Distribution Shapes (Vocab)
Symmetric
Skewness
Kurtosis
Symmetric Definition
Can split the distribution into two identical halves
Skewness Definition
An asymmetry in which an elongated tail extends in either the right-hand direction (positive skewness) or the left hand direction (negative skewness)
Kurtosis Definition
The degree of peakedness or steepness in a distribution
The Effect of Distribution Shape on Descriptive Measures
the shape of the distribution influences nearly every summary measure
when distribution is perfectly symmetrical, the mean and median values are the same
when distribution is skewed this equivalence disappears. this is when the median is more representative of the data set than the mean.
extreme values affected most of the common measures of disposition
the range is radically affected by a single extreme value
this is also true to a lesser extent of the variance and standard deviation. the MAD is somewhat less susceptible.
Distribution Shape: Frequency Distributions Definition
When the data set has a small number of possible values that occur with some frequency, a frequency distribution can reveal the distribution shape.
Building a Frequency Distribution
A frequency distribution is a tabular summary of a set of data showing the frequency (or number) of items in each of sever nonoverlapping classes
the objective is to provide insights about the data that cannot be quickly obtained by looking only at the original “raw“ data
for each qualitative data, this means simply counting the number of times each value occurs
for quantitative data, this means either counting values for variables that take a small number of discrete values or grouping the values for variables that take many values over a continuous range.
Distribution Shape: Bar Chart
A bar chart is a graphical device for depicting qualitative or quantitative data that have been summarizing in a frequency, relative frequency, or cumulative frequency distribution
on the horizontal axis, specify the tables/values that are used for each of the classes/values
a frequency, relative frequency, or cumulative frequency scale (but only one) can be used for the vertical axis
using a bar or fixed width drawn above each class label/value, we extend the height appropriately
the bars are separated to emphasize the fact that each class/value is a sperate category/discreet value
Distribution Shape: Group Data
when the data takes a large number of values, and few (if any) observations have the same value, the observation need to be grouped in order to see the distribution shape
Grouping the Data Guidelines
classes should touch but nit overlap
classes should be of equal width
open ended classes should be avoided
the number of classes should be close to the smallest value of k for which 2k > n or N
the upper and lower boundaries for each class -the class limits, but be set in a way that makes them readable and intuitive (ex. chooses 1 to 4.99 not 1.13 to 5.13)
approximate class width: largest value - smallest value /divided by number of classes
Histograms Definition
another common graphical presentation of quantitative data is a histogram.
the variable of interest is placed on the horizontal axis and the frequency or relative frequency (only 1) is placed on the vertical axis
a rectangle is drawn above each class interval with its height corresponding to the interval’s frequency or relative frequency (use only 1)
unlike a bar graph, a histogram has no natural separation between rectangles of adjacent classes.
Approximating Descriptive Measures
Therse measures can be used to obtain approximations of the mean, variance, and standard deviation for the frequency distribution of grouped data
to compute the weighted mean, treat the midpoint of each interval (mi) as a representative value for all of the group (or class) members
compute the weighted average of the class midpoints using the class frequencies as weights (fi)
similarly, in computing the variance and standard deviation, the class frequencies are used as weights.
for a relative frequency distribution, substitute the relative frequencies pi for fi in the formulas and do not divide by N