Chapter 9: Intro to the Analysis of Variance
1/30
Earn XP
Description and Tags
pg. 377 - vocab
Name | Mastery | Learn | Test | Matching | Spaced | Call with Kai |
|---|
No analytics yet
Send a link to your students to track their progress
31 Terms
Analysis of Variance (ANOVA)
The statistical procedure for testing variation among the means of more than two groups.
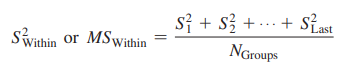
Within-Groups Estimate of the population variance (S2Within or MSWithin)
An estimate of the variance of the population of individuals based on the variation among the scores in each of the actual groups studied.
Between-groups estimate of the population variance (S2Between or MSBetween)
An estimate of the variance of the population of individuals based on the variation among the means of the groups studied
F ratio
The ratio of the between-groups population variance estimate to the within-groups population variance estimate
F distribution
A mathematically defined curve that is the comparison distribution used in an analysis of variance.
F table
A table of cutoff scores on the F distribution.
S2Within or MSWithin
Within-groups estimate of the population variance.
grand mean (GM) )
Overall mean of all the scores, regardless of what group they are in; when group sizes are equal, mean of the group means.
S2Within or MSBetween
Between-groups estimate of the population variance
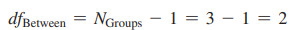
Between-groups (or numerator) degrees of freedom (dfBetween)
degrees of freedom used in the between-groups estimate of the population variance in an analysis of variance (the numerator of the F ratio); number of scores free to vary (number of means minus 1) in figuring the between-groups estimate of the population variance
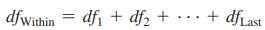
Within-groups (or denominator) degrees of freedom (dfWithin)
degrees of freedom used in the within-groups estimate of the population variance in an analysis of variance, denominator of the F ratio; number of scores free to vary (number of scores in each group minus 1, summed over all the groups) in figuring the within-groups population variance estimate.
Planned contrasts
A comparison in which the particular means to be compared were decided in advance. Also called planned comparison.
Bonferroni procedure (aka Dunn’s test)
You use a more stringent significance level for each contrast. The result is that the overall chance of any one of the contrasts being mistakenly significant is still reasonably low. Ex. If each of two planned contrasts used the .025 significance level, the overall chance of any one of them being mistakenly significant would still be less than .05. (That is, .05>2 = .025.) With three planned contrasts, you could use the .017 level 1.05>3 = .0172
Post hoc comparisons (aka posteriori comparisons)
These are comparisons figured after an analysis of variance, such as between two groups, that were not planned in advance. With multiple comparisons, not specified in advance; this procedure conducted as part of an exploratory analysis after an analysis of variance
Scheffé test
A method of figuring the significance of post hoc comparisons that takes into account all possible comparisons that could be made.
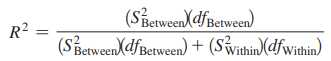
Proportion of variance accounted for (R2)
A proportion of the total variation of scores from the grand mean that is accounted for by the variation between the means of the groups.
eta squared (η^2)
Another common name for R2, which is known as the correlation ratio
Structural model
A way of understanding the analysis of variance as a division of the deviation of each score from the overall mean into two parts: the variation in groups (its deviation from its group’s mean) and the variation between groups (its group’s mean’s deviation from the overall mean); an alternative (but mathematically equivalent) way of understanding the analysis of variance.
Analysis of Variance Table
A chart showing the major elements in figuring an analysis of variance using the structural model approach.
When can you use an analysis of variance?
Analysis of variance can be used when you are comparing means of samples from more than two populations
What is the within-groups population variance estimate based on?
The within-groups population variance estimate is based on the variation among the scores in each of the samples.
How is the within-groups population variance estimate affected by the null hypothesis being true or not? Why?
It is not affected. Whether the null hypothesis is true has to do with whether the means of the populations differ. The within-groups estimate is not affected by whether the null hypothesis is true because the variation within each population (which is the basis for the variation in each sample) is not affected by whether the population means differ.
What is the between-groups population variance estimate based on?
The between-groups population variance estimate is based on the variation among the means of the samples. (b) It is larger when the null hypothesis is false
How is the between-groups population variance estimate affected by the null hypothesis being true or not? Why?
It is larger when the null hypothesis is false. Whether the null hypothesis is true has to do with whether the means of the populations differ. When the null hypothesis is false, the means of the populations differ. Thus, the between-groups estimate is bigger when the null hypothesis is false, because the variation among the means of the populations (which is one basis for the variation among the means of the samples) is greater when the population means differ.
What are two sources of variation that can contribute to the between-groups population variance estimate?
Two sources of variation that can contribute to the between-groups population variance estimate are (1) variation among the scores in each of the populations (that is, variation due to chance factors), and (2) variation among the means of the populations (that is, variation due to a treatment effect).
What is the F ratio?
The F ratio is the ratio of the between-groups population variance estimate to the within-groups population variance estimate.
Why is the F ratio usually about 1 when the null hypothesis is true?
Both estimates are based entirely on the same source of variation—the variation among the scores in each of the populations (that is, due to chance factors)
Why is the F ratio usually larger than 1 when the null hypothesis is false?
The between-groups estimate is also influenced by the variation among the means of the populations (that is, a treatment effect) whereas the within-groups estimate is not. Thus, when the null hypothesis is false (and thus the means of the populations are not the same), the between-groups estimate will be bigger than the within-groups estimate.
SSTotal
Sum of squared deviations of each score from the overall mean of all scores, completely ignoring the group a score is in.
SSWithin
Sum of squared deviations of each score from its group’s mean.
SSBetween
Sum of squared deviations of each score’s group’s mean from the grand mean.