STATS 250
1/9
There's no tags or description
Looks like no tags are added yet.
Name | Mastery | Learn | Test | Matching | Spaced |
|---|
No study sessions yet.
10 Terms
Z-test
a statistical hypothesis test that determines if there is a significant difference between the mean of a sample and a population mean, or between the means of two populations
z-score: indicates the position of the sample data within the distribution relative to the population mean; BASICALLY how many standard deviations your sample's average is from the population's average
\frac{\pî-\pi_0^{}}{\sqrt{\frac{\pi_0\cdot\left(1-\pi_0\right)}{n}}}
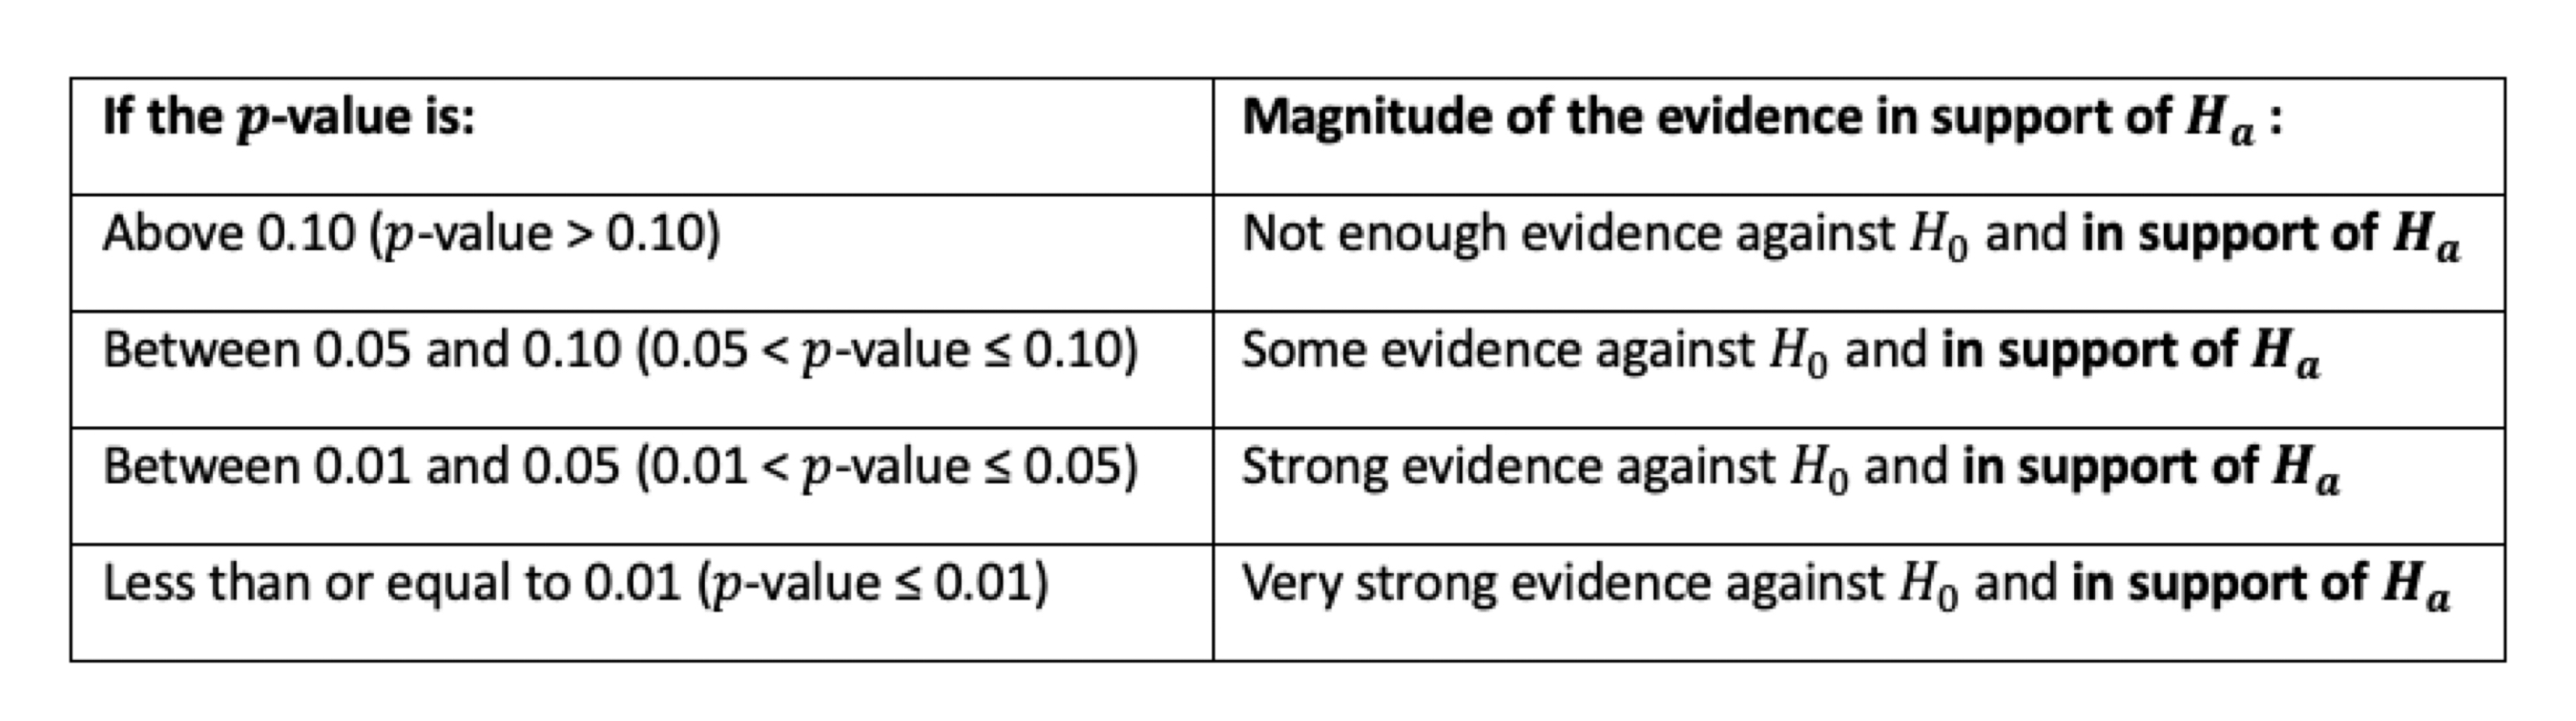
p-value
the probability of obtaining the observed data, or more extreme data, if the null hypothesis is true; measure of how likely the results are to have occurred by random chance and
Extreme Results: The p-value represents the probability of observing results at least as extreme as the actual observed results.
Evidence Against Null Hypothesis: A smaller p-value indicates a greater incompatibility between the observed data and the null hypothesis, suggesting stronger evidence against it.
Statistical Significance: P-values are used in statistical significance testing to help decide whether to reject the null hypothesis in favor of an alternative hypothesis.
Standard error
measures the precision of a sample mean as an estimate of the true population mean, showing how much the sample mean is likely to vary from the true mean
What it is: A statistic that quantifies the uncertainty or precision of your sample mean's estimate of the population mean.
What it tells you: How much the sample mean is likely to vary from the true population mean.
When to use it: When you are performing experiments and comparing means between groups or when you want to infer conclusions about a population from a sample.
How it's affected: It decreases as sample size increases, because larger samples are more likely to be accurate representations of the population. It is calculated by dividing the standard deviation by the square root of the sample size.
Standard deviation
What it is: A descriptive statistic that shows how much individual data points are spread out around the mean of a single sample.
What it tells you: The natural variability within a dataset.
When to use it: When you want to describe the characteristics of the individuals in your dataset.
How it's affected: Larger values mean data points are more spread out.
Effect Size
a standardized measure of how far the observed statistic is from the null value, scaled by the overall variability of the observed data — not by sample size; unlike a test statistic, which moves further from zero as the sample size increases, the effect size reflects the magnitude of difference itself
EXAMPLE OF USING EFFECT SIZE:
Program A has an estimated effect size of 0.36 (moderate) and Program B has an estimated effect size of 0.04 (very small/negligible). Which intervention is worth expanding, given limited budgets? PROGRAM A
Quantifies Strength:
It measures the strength of the association between variables or the magnitude of the difference between groups.
Indicates Practical Significance:
Unlike p-values, which only show if an effect is statistically significant, effect size indicates how much of a difference a treatment or intervention makes, rather than just whether the result is due to chance.
Allows for Comparison:
Because effect sizes can be standardized, they can be used to compare findings across different studies, making it possible to pool information in a meta-analysis
FORMULA (for proportions):\frac{\pi.hat-\pi^{}}{\sqrt{\pi\cdot\left(1-\pi\right)}}
OR:\frac{z}{\sqrt{n}}
FORMULA (for means): \frac{\mu.hat-\mu.null}{\sigma}
OR:\frac{t}{\sqrt{n}}
P-Value vs. Effect Size
the p-value tells us the magnitude of evidence in support of the alternative hypothesis,, whereas the effect size tells us the magnitude of the difference between the sample data and the null hypothesis
ex. Notice that the alternative is Ha: μ < 7. Suppose our p-value is small, and therefore we conclude that there is strong evidence for this alternative hypothesis. Still, we don't know where μ falls, and we only have evidence that the average pH is below 7 based on our sample. μ can be 3 (very acidic) or 6.9 (slightly acidic).
Key takeaway: Results that are statistically significant (p-value) may or may not be practically significant/important (effect size).
Power
the probability that a test correctly produces strong or very strong evidence against the null hypothesis test when the alternative hypothesis test is actually true; a test’s power measures its ability to detect an effect size whenever one truly exists
power increases as the effect size increases — larger effect sizes are easier to detect in general, while smaller effect sizes are more difficult to detect
power increases as sample size increases — larger sample sizes reduce the amount of sampling variability (“noise”) that sample statistics display over repeated random samples, making it easier to detect an effect if one truly exists
how to calculate: \frac{strong+verystrong}{n}
Sample Size
number of observations or data points included in a testing procedure,n
Limitations of Hypothesis Tests
Test statistics and p-values are both influenced by two factors of a hypothesis testing procedures
The true discrepancy between a parameter’s true value and the null value claimed to be correct by H0 (variability).
The amount of data you sampled at random from the population (sample size).
Thus, it can be difficult to determine whether the results of a hypothesis test are driven by variability, sample size, or a combination of both when drawing a conclusion from the test statistic and p-value in isolation
Hypothesis tests are disconfirmatory.
They can formally generate evidence against a claim about a parameter.
Two Sample t-test Formula
(observed sample statistic - null value) / standard error
when standard deviation and sample size are the same, then simply compare the difference in observed sample statistic
\frac{\mu.hat_1-\mu.hat_2}{\sqrt{\frac{\left(\sigma.hat_1\right)^2}{n_1}+\frac{\left(\sigma.hat_2\right)^2}{n_2}}}